WORKING PAPER SERIES
NO 1389 / OCTOBER 2011
by Anneke Kosse
DO NEWSPAPER
ARTICLES ON CARD
FRAUD AFFECT DEBIT
CARD USAGE?
CONFERENCE ON THE FUTURE OF RETAIL PAYMENTS: OPPORTUNITIES AND CHALLENGES
CONFERENCE ON THE FUTURE OF RETAIL PAYMENTS: OPPORTUNITIES AND CHALLENGES
This paper can be downloaded without charge from http://www.ecb.europa.eu or from the Social Science Research Network electronic library at http://ssrn.com/abstract_id=1932647.
NOTE: This Working Paper should not be reported as representing the views of the European Central Bank (ECB). The views expressed are those of the author and do not necessarily reflect those of the ECB.
W O R K I N G PA P E R S E R I E S
N O 13 8 9 / O C T O B E R 2 011
DO NEWSPAPER ARTICLES
ON CARD FRAUD AFFECT
DEBIT CARD USAGE?
1by Anneke Kosse
2 In 2011 all ECB publications feature a motif taken from the €100 banknote.© European Central Bank, 2011 Address
Kaiserstrasse 29
60311 Frankfurt am Main, Germany
Postal address
Postfach 16 03 19
60066 Frankfurt am Main, Germany
Telephone +49 69 1344 0 Internet http://www.ecb.europa.eu Fax +49 69 1344 6000
All rights reserved.
Any reproduction, publication and reprint in the form of a different publication, whether printed or produced electronically, in whole or in part, is permitted only with the explicit written authorisation of the ECB or the author.
Information on all of the papers published in the ECB Working Paper Series can be found on the ECB’s website, http://www. ecb.europa.eu/pub/scientific/wps/date/ html/index.en.html
The future of retail payments: opportunities and challenges
The way people pay is continuously changing, as a result of innovations in retail payments, improvements in efficiency and regulatory changes. This changing environment creates opportunities for some and challenges for others in the retail payments sector. The impact of these changes on the future of retail payments was the main theme of the biannual retail payments conference organised by the European Central Bank (ECB), this time in cooperation with the Oesterreichische Nationalbank (OeNB), on 12 and 13 May 2011 in Vienna. More than 200 high-level policymakers, financial sector representatives, academics and central bankers from Europe and other regions attended this conference, reflecting the topicality of and interest in the retail payments market.
The aim of the conference was to better understand current developments in retail payment markets and to identify possible future trends, by bringing together policymaking, research activities and market practice. A number of key insights and conclusions emerged. The Single Euro Payments Area (SEPA) project is recognised as being on the right track, even though some further work needs to be done in the areas of standardisation of card payments and migration towards SEPA instruments. The European Commission’s proposal for a regulation setting an end date for migration to SEPA credit transfers and SEPA direct debits is welcomed. For SEPA to be a success, it is essential that users are involved, in order to ensure acceptance of the SEPA instruments. Moreover, innovations in retail payments are taking place more rapidly than ever, and payment service providers and regulators need to adapt quickly to this changing business environment.
We would like to thank all participants in the conference for the very interesting discussions. In particular, we would like to acknowledge the valuable contributions and insights provided by all speakers, discussants, session chairpersons and panellists, whose names can be found in the conference programme. Their main statements are highlighted in the ECB-OeNB official conference summary. Six
papers related to the conference have been accepted for publication in this special series of the ECB Working Papers Series.
Behind the scenes, a number of colleagues from the ECB and the OeNB contributed to both the organisation of the conference and the preparation of these conference proceedings. In alphabetical order, many thanks to Nicola Antesberger, Stefan Augustin, Michael Baumgartner, Christiane Burger, Stephanie Czák, Susanne Drusany, Henk Esselink, Susan Germain de Urday, Monika Hartmann, Monika Hempel, Wiktor Krzyzanowski, Thomas Lammer, Tobias Linzert, Alexander Mayrhofer, Hannes Nussdorfer, Simonetta Rosati, Daniela Russo, Wiebe Ruttenberg, Heiko Schmiedel, Doris Schneeberger, Francisco Tur Hartmann, Pirjo Väkevainen and Juan Zschiesche Sánchez.
Gertrude Tumpel-Gugerell Wolfgang Duchatczek
Former member of the Executive Board Vice Governor
Abstract 6
1 Introduction 7
2 Literature 8
3 Data 9
4 Methodology and empirical model 11
5 Results 13
6 Conclusions 14
Bibliography 15
Figures and table 17
Abstract
This paper investigates the impact of newspaper publications about debit card skimming fraud on debit card usage in the Netherlands using daily information from January 1st 2005 to December 31st 2008. Time-series analyses are employed to assess the daily fluctuations in aggregate debit card usage. The results show that newspaper articles that somehow make mention of the phenomenon of skimming fraud significantly affect the number of debit card payments. The direction of the effect depends on the type of skimming fraud addressed. Newspaper articles on fraud at points-of-sale (POS) and ticket machines depress the number of debit card payments. News on ATM fraud, by contrast, has a positive effect on debit card payments. This indicates that the temporarily created fear for using the debit card at the ATM is not automatically translated into fear for using the debit card at the POS. Instead, ATMs and POS terminals are perceived as substitutes. Although significant, all media effects found are relatively small in comparison with other factors such as calendar and holiday effects and daily rainfall. Moreover, the effects only last for one day, with consumers immediately reverting back to their regular payment behaviour. This corresponds to earlier results found in other research fields and suggests that consumers’ confidence in the debit card is relatively sturdy and not easily affected. Moreover, it might be an indication of consumers having a short memory when it comes to newspaper articles.
Keywords: debit card, fraud, payment behaviour, media communication JEL-codes: C22, C23, D12, E21
1. Introduction
Since their introduction in the late 1980s, debit cards have rapidly gained popularity in the Netherlands. Whereas cash transactions still outnumber debit card transactions, the debit card has gained the lead with respect to total value; in 2009, around 54% of total sales at the counter was paid by debit card versus 43% in cash. And the substitution is still ongoing: recent figures show that the yearly number and value of debit card transactions is still increasing, while the number of cash withdrawals and payments has stabilised.
The ongoing increase in its acceptance and usage has made the debit card increasingly attractive for fraud. The most important type of debit card fraud in the Netherlands is skimming fraud, where the data on the magnetic stripe is copied and the PIN is captured in order to produce a counterfeit card. Total skimming fraud increased materially over the past few years, from less than EUR 4 million in 2005 to EUR 36 million in 2009. Initially, debit cards were mainly copied at ATM’s, but since 2008, the fraud has spread towards payment terminals in shops, petrol stations and ticket machines as well. Dutch banks compensate for the financial damages incurred when the afflicted cardholders have taken reasonable safety measures.
Compared to the size of the Dutch debit cards market, the scale of skimming fraud is still relatively small: in 2009, around 0.3% of all debit cards were copied, 0.4% of all ATMs and payment terminals were sabotaged and total financial damages amounted up to 0.03% of total debit card sales. Yet, all stakeholders in the payment chain are giving high priority to its prevention and fight, because of the general notion that the total consequences could eventually be more widespread than just the sum of the direct fraud losses and the indirect costs of inconveniences and preventive measures to afflicted cardholders, retailers and banks. Debit card fraud incidents receive a fair amount of attention from the media in which not only the victims but the entire population is addressed1. This might affect overall payment behaviour, as consumers may lose their confidence in the safety of debit cards and shift away to other means of payment. Cheney (2006) expresses real concern for a possible erosion of consumer confidence in electronic payment instruments due to the increase of safety incidents. Since earlier studies have demonstrated that the debit card is often a fast and cheap way of paying (Brits and Winder, 2005; EIM 2007), a substantial substitution away from debit cards could eventually harm the efficiency of the entire payment system.
Clear evidence of safety incidents affecting consumer confidence and payment behaviour, however, is lacking. Therefore, the aim of this paper is to examine the impact of newspaper publications about skimming fraud on debit card usage. Time-series analyses are employed, using daily debit card data and newspaper announcements from January 1st 2005 to December 31st 2008. The key finding is that debit card usage is significantly affected by newspaper reports on skimming fraud. The direction of the effect depends on the type of
1
According to Statistics Netherlands (CBS), about half the Dutch population is subscribed to a daily newspaper (2008), 70% watches the news each day (2007) and 74% is regularly reading the news on the internet (2010).
fraud addressed: articles on skimming fraud at points-of-sale (POS) result to depress card usage, whereas news on ATM fraud increases the number of debit card payments. Although significant, all media effects are economically small in comparison with other factors such as calendar and holiday effects and daily rainfall. Moreover, the effects only last for one day, with consumers immediately reverting back to their regular payment behaviour. This suggests that consumers’ confidence in the debit card is relatively sturdy and not easily affected.
2. Literature
Role of safety in payment choice
The introduction of new electronic payment instruments has given rise to a stream of payment research examining consumer payment choice in response to incentives and payment characteristics. Theoretical papers depart from the idea that payment instruments differ from each other with respect to costs, safety, anonymity, speed, acceptance and other characteristics and that consumer’s choice of which payment instrument to use is based on their net benefits received (Bolt and Chakravorti, 2010). When studying consumer demand for cash, Alvarez and Lippi (2009) explicitly account for the probability of cash theft and assume that consumers keep smaller cash balances and increase the number of cash withdrawals when the probability of theft increases. Bolt and Chakravorti (2008) and Kahn and Roberds (2009) too consider the probability of getting mugged as a proxy for the safety benefit of cards over cash. None of these theoretical papers, however, take into account the safety costs of cards.
There is a substantial amount of self-reported survey data that suggests that debit card usage is influenced by relative prices, demographics such as age, education and income, transaction variables such as type of goods, spending place, transaction amount, and characteristics of the market infrastructure (e.g. Bounie and François, 2006; Rysman, 2007; Zinman, 2009). The survey-based literature, however, does not give a unanimous answer regarding consumers’ attitudes towards risks and safety. Some (e.g. Cheney, 2006; Jonker, 2007; Borzekowski et al., 2008; Kosse, 2010) find that safety is one of the factors considered when choosing a particular instrument. Others on the other hand (such as Yin and DeVaney, 2001; Schuh and Stavins, 2010) find no evidence of safety playing an important role.
In addition, there are some articles analysing payment usage over time using aggregate country data (e.g. Jonker and Kettenis, 2007; Amromin and Chakravorti, 2009; Bolt et al., 2008). Overall, they find that price and non-price variables have played an important role in the adoption of debit cards in many countries. No attention is paid to the role of safety and security, however, in either study. This makes the paper by Humphrey et al. (1996) a sole exception. They study the factors influencing the substitution between debit cards and other non-cash instruments in 13 developed countries from 1987 to
1993 and include a measure of crime into the model. They find that debit card usage is negatively correlated with rates of violent crime.
Contribution of this paper
This paper contributes to the existing literature in several ways. First, it is based on actual payment behaviour instead of individual perceptions and self-reported stated behaviour. Due to this, measurement errors, such as incomplete recall, telescoping or social desirability are minimised (Jonker and Kosse, 2009). Second, consumers’ payment behaviour is assessed using daily data. This unique dataset is much richer than the annual transaction aggregates used in previous studies. Third, instead of deriving a proxy for the level of safety, I use data on actual newspaper announcements about debit card skimming fraud. Thus far, the impact of media reporting has not been considered and tested for in payment research. This paper will therefore provide new insights into the extent to which consumers’ payment behaviour is affected by media reporting and into the fragility of consumers’ confidence with respect to paying.
Impact of media communication in other research fields
Although this is the first attempt to tackle with this issue in the field of payments, many papers have been written on the impact of media communication on consumer and private agent behaviour in other research fields. In the 1990’s, for example, food safety concerns dramatically increased as a result of contaminated meat products due to outbreaks such as of E. coli, Salmonella or BSE. As a result, a new stream of literature was introduced, investigating the impact of media publications on food safety on demand for food. Overall, public information pertaining to food safety and health concerns through the media have shown to depress consumer food demand (e.g. Van Ravenswaay and Hoehn, 1991; Smith et al., 1988; Dahlgran and Fairchild, 1987; Piggot and Marsh, 2004; Radwan et al., 2008). The effects, however, are found to be small in comparison to other factors such as price and income effects, seasonal factors and time trends, and short-lived, with consumers soon forgetting the publicity and reverting back to previous consumption levels. Also in political science and economics (e.g. Miller et al., 1979; Alsem et al., 2008; Campbell et al., 2003) consumer confidence and behaviour is found to be significantly affected by media publications, and also here, the effects are often found to last temporarily and to disappear in the longer run.
3. Data
Debit card transactions
In order to investigate the impact of fraud articles on debit card usage, I use daily debit card transaction data. This data was provided by Equens, the automated clearing house (ACH) responsible for the processing of domestic
debit card transactions in the Netherlands. The data covers all daily debit card transactions made by Dutch residents at POS terminals in the Netherlands over the period from January 1st 2005 to December 31st 2008. Figure 1 presents the total daily number of POS debit card transactions made in the Netherlands. This series is characterised by a strong positive trend and strong daily fluctuations.
<See Figure 1>
Newspaper articles on debit card fraud
Information on daily newspaper announcements on debit card fraud was extracted from the LexisNexis database, covering all articles published in both national and regional newspapers from January 1st 2005 to December 31st 2008. Various keyword searches were performed to filter out the articles in which somehow mention was made of debit card skimming fraud. In total, 1586 articles were extracted from 54 newspapers. Subsequently, the search results were manually checked and for each article several characteristics were recorded, such as the name of the newspaper, the type of skimming fraud addressed and whether the article was published on the front page or not. Figure 2 presents the total daily number of skimming fraud articles published in the Netherlands since January 1st 2005. This series is characterised by an increasing trend in the frequency of announcements. Moreover, a strong fluctuation in the daily number of publications can be observed, with relatively high peaks around the summer of 2007.
<See Figure 2>
Calendar and moving holiday effects
All possible calendar and moving holiday effects will be taken into account when analysing the impact of newspaper announcements. Esteves and Rodrigues (2010) did something similar when analysing the daily evolution of ATM withdrawals and found significant calendar effects. The number of ATM withdrawals is shown to not only differ per day of the week, it is also higher in the first and last week of the month and during the summer holidays and the Christmas season. Jonker and Kosse (2009) too find strong calendar effects when analysing transaction diaries of consumers.
Following the example of Esteves and Rodigues (2010), I consider calendar effects to be anomalies related to the calendar, such as the day-of-the-week, the month-of-the-year or fixed holidays such as Christmas and Queen’s Day. Moving holidays are defined as holidays which are not fixed on a specific date, such as Easter and Whitsun. Pre- and post-holidays are considered as well, to account for the possibility that consumers’ purchasing and payment behaviour might deviate from regular behaviour on days prior or subsequent to particular holidays.
Rainfall
Another variable that might affect daily debit card usage is rainfall. It is likely that on rainy days consumers rather stay at home than go shopping and that, as a consequence, rainfall and debit card usage are negatively correlated. Data on the daily precipitation amount (in 0.1 mm) measured in weather station De Bilt from January 1st 2005 to December 31st 2008 was extracted from the Royal Netherlands Meteorological Institute (KNMI). This series is used in the remainder of this paper as an indicator of the average rainfall in the Netherlands.1
4. Methodology and empirical model
Dependent and explanatory variables
The daily number of debit card transactions (NRPOS) is assumed to be a function of a set of dummies controlling for potential calendar and holiday effects including their appropriate number of lags and leads (CALEND), the daily rainfall in 0.1 mm as measured in De Bilt (RAIN), a time trend (t) that serves as a proxy for all not-observable variables that affect debit card usage and that are highly correlated with time, and a set of dummy variables on the occurrence of newspaper articles on skimming fraud (NEWS):
NRPOS = NRPOS(CALEND,RAIN,t,NEWS) (1) For simplicity of estimation, a log-linear model is used making logNRPOS the dependent variable in the model. In order to capture the possible effect of skimming fraud information, NEWS will consist of two dummy variables indicating, on a daily basis, whether any fraud articles were published or not2.
PUBPOS is used as an indicator for publications about skimming fraud at
payment terminals, being one on days with publications about fraud at POSs or ticket machines. PUBATM equals one for days with publications about ATM fraud. Lagged values of PUBPOS and PUBATM are added to the model as well, in order to assess how long any newspaper affect persists. No discrimination between positive or negative messages is made, since the
1
I acknowledge that there might be much more factors affecting daily debit card usage other than calendar and holiday effects and daily rainfall. However, since high frequency (i.e. daily) data are scarce, the analysis presented in this paper is limiting itself to these control variables only.
2 On average, Dutch consumers read 1.4 different newspapers a day (NOM Media 2010) and
74% of the Dutch regularly read the news (also) on the Internet (CBS 2010). Since many newspapers and news sites are supplied with news from the same source, the Netherlands national news agency (Algemeen Nederlands Persbureau, ANP), the same news items often appear simultaneously at different places and often reach the same consumers more than once a day. This is why it is more interesting to look at the occurrence of skimming fraud publications in general than to examine the marginal impact of one additional publication.
majority of the articles were negative in nature. Moreover, such discrimination can be highly subjective and highly correlated (Smith et al., 1988).
Cointegration Equation and Error Correction Model
Before starting any time-series modelling, I investigated the time-series properties of logNRPOS and RAIN using the Augmented Dickey-Fuller (ADF) test, the Phillips-Perron (PP) test and DF-GLS test. All test results confirmed that there is a significant trend effect in the daily number of debit card payments, but they rejected the null hypothesis of unit root, also when the trend was excluded from the test equations. Therefore, I estimated the following cointegration equation (CE) using Ordinary Least Squares (OLS):
t L l l t l L l l t l t K k t k
t CALEND RAIN t PUBPOS PUBATM NRPOS =α +
¦
β +φ +δ +¦
χ +¦
ϕ +ε = − = − =1 0 0 0 log (2)where α0denotes the fixed constant, CALENDt is a set of dummies controlling for K potential calendar and holiday effects including their appropriate number of lags and leads, RAINtdenotes the daily rainfall, t is the linear time trend,
and PUBPOSt−l and PUBATMt−lare the dummy variables indicating
publication of newspaper articles on skimming fraud at POSs and ATMs respectively, both lagged L periods. Consequently I tested for a unit root in the error correction term εt and estimated the following corresponding Error Correction Model (ECM) that describes the short-run dynamics between the variables with error being the last period’s error correction term:
t L l l t l L l l t l t K k t k t error PUBATM PUBPOS t RAIN CALEND NRPOS ε θ μ λ κ η γ + − − Δ + Δ + Δ + Δ + Δ = Δ
¦
¦
¦
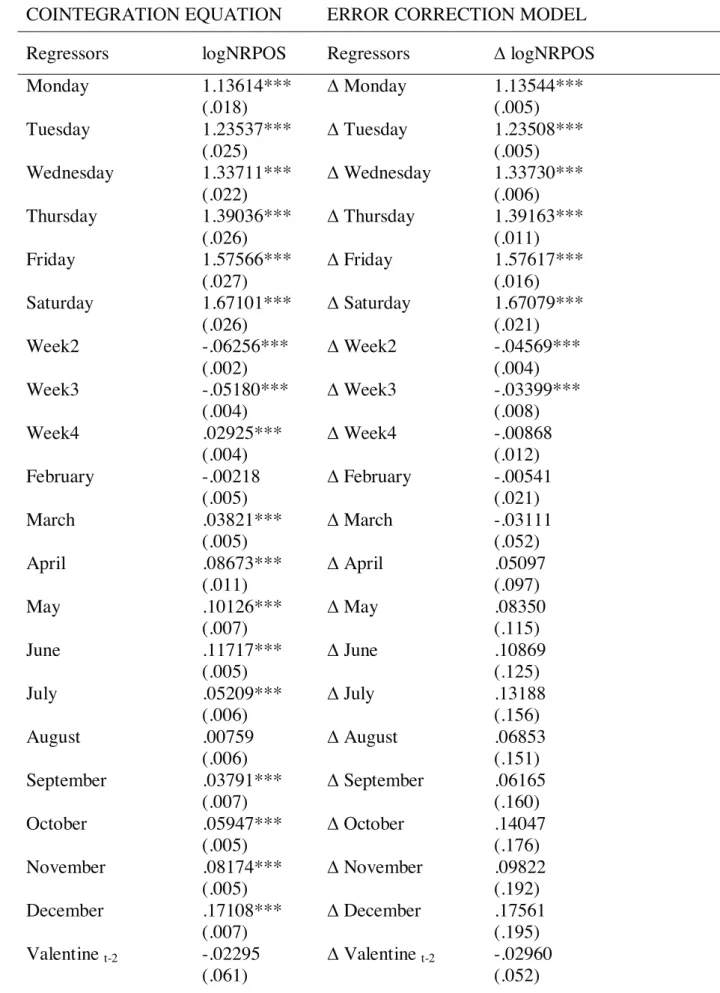
= − = − = ] )[ 1 ( log 0 0 1 (3) Final modelBoth the Breusch-Pagan test and the White test rejected the null hypothesis of constant variance in the CE and ECM. Therefore I re-estimated the CE and the ECM by OLS regression, but computed heteroskedasticity-and-autocorrelation-consistent (HAC) standard errors or simply Newey-West standard errors. I econometrically investigated various combinations of lag and lead lengths of the calendar, holiday and newspaper variables using separate t-tests and joint-F tests. The final model can be found in Table 1. The results of the final CE are presented in the first two columns. As the model’s R-squared of 0.98 is lower than the Durbin-Watson statistic of 1.84148, the null-hypothesis of no cointegration can be rejected. This means that the variables are cointegrated and that there is a long-term relationship between debit card usage and the explanatory variables. The results of the final ECM are shown in the last two columns.
<See Table 1>
5. Results
Impact of newspaper articles
The results of both the CE and the ECM show that news on skimming fraud at the POS significantly depresses same day debit card usage: in the long-term equilibrium, the total number of debit card payments is 1.2% lower on days when articles are published about POS skimming fraud. The same day effect of POS skimming fraud publications can be explained by the fact that the majority of Dutch newspapers is published and distributed in the morning. The effect, however, only lasts for one day: the insignificance of the two lagged values indicates that consumers revert back to their normal payment behaviour almost immediately.
Moreover, the results point at a small positive lagged effect of ATM fraud reports. Total debit card payments temporarily increase with 1.1% the day after ATM fraud articles have come out. Apparently, these announcements deter people from withdrawing cash and stimulate them to pay by debit card instead. Again, the effect only lasts for one day, with consumers soon losing their fears. It is reasonable to find that it takes one day before the temporarily created ATM aversion is affecting consumers’ payment behaviour, since many consumers start their day with a certain amount of cash in their wallet.
Impact of calendar and holiday effects
The final regression results should be read as deviations relatively to a non-holiday Sunday of the first week of January. They show that daily debit card usage is significantly and strongly influenced by the day, week and month of the year. On Mondays, total debit card usage is more than twice as high as on Sundays. The number of debit card payments further increases as the week progresses. Moreover, debit card usage is highest in the first and last week of the month when most of the salaries are paid out. With respect to monthly fluctuations, debit card usage turns out to be lowest in February, the shortest month in the year. From March onwards, the number of transactions increases until July, when the summer holidays start. From September onwards, however, debit card usages rises again, reaching its peak in December.
Concerning the holiday effects, the results indicate that in general, debit card usage is relatively higher on days prior to fixed or moving holidays. This reflects people’s tradition of buying gifts and cloths and preparing special dinners. The holidays themselves are characterised by a decrease in debit card usage. With respect to post-holiday effects, the results point at a significant and strong negative effect for the day after Easter Day, Whitsun Day and Christmas Day, which are traditionally celebrated as national work-free holidays as well in the Netherlands.
Impact of control variables
The control variable measuring the daily precipitation has a significant impact on debit card usage as well; the total number of daily debit card transactions decreases with the amount of rainfall. This most probably reflects that on rainy days consumers rather stay at home than go shopping and consequently make fewer transactions. The time trend, too, proves to be very significant. Its positive sign shows that daily debit card usage is continuously increasing over time due to variables other than those included in this model. For example, it would pick up the effect of gradually changing consumer preferences in payment behaviour caused by slowly changing preferences or population composition. On average, the total number of debit card transactions increases with 0.027% a day, holding all other variables fixed.
Goodness-of-fit
Clearly, the CE and ECM point at a small but significant affect of newspaper articles on debit card usage in the Netherlands. Together with the calendar effects and control variables, they explain about 98% of the total fluctuation in daily debit card payments over the period 2005 to 2008. In order to assess the predictive quality of the model, I used its estimates to forecast the total number of debit card payments made in the year 2009. It was relatively easy to collect the daily 2009 values of the regressors, except for the number of newspaper articles published. Given the high complexity and time-consuming nature of gathering all publications and afterwards checking and assessing them one by one, I decided to assume the daily number of skimming fraud articles in 2009 to be the same as in 2008. The results of both the out-of-sample and in-sample predictions are presented in Figure 3, together with the actual yearly number of debit card transactions provided by Equens. It shows that the model performs very well in predicting actual debit card usage, with a deviation of -0.48% only.
<See Figure 3>
6. Conclusions
The economic significance of consumers’ response to skimming fraud publications provides several meaningful messages. First, the results show that POS skimming fraud announcements deter cardholders from paying by debit card, whereas ATM skimming fraud restrains consumers from withdrawing cash and instead stimulates debit card payments. This indicates that the temporarily created fear for using the debit card at the ATM is not automatically translated into fear for using the debit card at the POS. Instead, ATMs and POS terminals are perceived as being substitutes. Secondly, similar to the results found in other research fields, the newspaper effect is
economically small and only lasts for a very short time. This suggests that consumers’ confidence in the debit card is relatively sturdy and not easily affected. Moreover, it might be an indication of consumers having a short memory when it comes to newspaper articles. Like stated by Alsem et al. (2008); ‘Nothing is as old as yesterday’s news’.
Bibliography
Alsem, K.J., S. Brakman, L. Hoogduin & G. Kuper (2008). ‘The impact of newspapers on consumer confidence: does spin bias exist?’ Applied
Economics 40: 531-539.
Alvarez, F. & F. Lippi (2009). ‘Financial innovation and the transaction demand for cash.’ Econometrica 77(2): 363-402.
Amromin, G. & S. Chakravorti (2009). ‘Whither loose change? The diminishing demand for small-denomination currency.’ Journal of Money,
Credit and Banking 41(2-3): 315-335.
Bolt, W. & S. Chakravorti (2008). ‘Consumer choice and merchant acceptance of payment media.’ DNB Working Paper 197, De Nederlandsche Bank. Bolt, W. & S. Chakravorti (2010). ‘Digitization of retail payments.’ DNB
Working Paper 270, De Nederlandsche Bank.
Bolt, W., D. Humphrey & R. Uittenbogaard (2008). ‘Transaction pricing and the adoption of electronic payments: a cross-country comparison.’
International Journal of Central Banking 4(1): 89-123.
Borzekowski, R. & E.K. Kiser (2008). ‘The choice at the checkout: quantifying demand across payment instruments.’ International Journal of Industrial
Organization 26(4): 889-902.
Borzekowski, R., E.K. Kiser & S. Ahmed (2008). ‘Consumers’ use of debit cards: patterns, preferences and price response.’ Journal of Money, Credit
and Banking 40(1): 149-172.
Bounie, D. & A. François (2006). ‘Cash, check or bank card? The effects of transaction characteristics on the use of payment instrument.’ Telecom
Paris Economics and Social Sciences Working Paper ESS-06-05.
Brits, J.H. & C.C.A. Winder (2005). ‘Payments are no free lunch.’ DNB
Occasional Studies 3(2), De Nederlandsche Bank.
Burton, M. & T. Young (1996). ‘The impact of BSE on the demand for beef and other meats in Great Britain.’ Applied Economics 28: 687-693.
Campbell, K, L.A. Gordon, M.P. Loeb & L. Zhou (2003). ‘The economic cost of publicly announced information security breaches: empirical evidence from the stock market.’ Journal of Computer Security 11: 431-448.
CBS (2010). Statline 2010. Available at http://statline.cbs.nl/statweb/?LA=en. Cheney, J.S. (2006). ‘Supply and demand side developments influencing
growth in the debit market.’ Discussion Paper 11, Federal Reserve Bank of Philadelphia Payment Cards Centre.
Dahlgran, R.A. & D.G. Fairchild (1987). ‘The demand impacts of chicken contamination publicity – a case study.’ Agribusiness 18: 459-474.
EIM (2007). The POS payment system in the Netherlands: an estimation
of the costs and revenues. Zoetermeer: EIM.
Elvestad, E. & A. Blekesaune (2008). ‘Newspaper readers in Europe: a multilevel study of individual and national differences.’ European Journal
of Communication 23(4): 425-447.
Humphrey, D.B., L.B. Pully & J.M. Vesala (1996). ‘Cash, paper and electronic payments: a cross-country analysis.’ Journal of Money, Credit and Banking
28(4): 914-939.
Jensen, H.H. & J.R. Schroeter (1992). ‘Television advertising and beef demand: an econometric analysis of split cable household panel scanner data.’ Canadian Journal of Agricultural Economics 40(2): 271-294.
Jonker, N. (2007). ‘Payment instruments as perceived by consumers – results from a household survey.’ De Economist 155(3): 271-303.
Jonker, N. & T. Kettenis (2007). ‘Explaining cash usage in the Netherlands: the effect of electronic payment instruments.’ DNB Working Paper 136, De Nederlandsche Bank.
Jonker, N. & A. Kosse (2009). ‘The impact of survey design on research outcomes: a case study of seven pilots measuring cash usage in the Netherlands.’ DNB Working Paper 221, De Nederlandsche Bank.
Kahn, C.M. & W. Roberds (2009). ‘Why pay? An introduction to payments economics.’ Journal of Financial Intermediation 18: 1-23.
Kosse, A. (2010). ‘The safety of cash and debit cards: a study on the perception and behaviour of Dutch consumers.’ DNB Working Paper 245, De Nederlandsche Bank.
Miller, A.H., E.N. Goldenberg and L. Erbring (1979). ‘Type-set politics: impact of newspapers on public confidence.’ The American Political
Science Review 73(1): 67-84.
NOM Media (2010). NOM Print Monitor 2010-I/2010-II. Available at http://www.nommedia.nl/.
Piggott, N.E. & T.L. Marsh (2004). ‘Does food safety information impact U.S. meat demand?’. American Journal of Agricultural Economics 86(1): 154-174.
Rysman, M. (2007). ‘An empirical analysis of payment card usage.’ Journal of
Industrial Economics 55(1): 1-36.
Schuh, S. & J. Stavins (2010). ‘Why are (some) consumers (finally) writing fewer checks? The role of payment characteristics.’ Journal of Banking and
Finance 34(8): 1745-1758.
Smith, M.E, E.O. van Ravenswaay & S.R. Thompson (1988). ‘Sales loss determination in food contamination incidents: an application to milk bans in Hawaii.’ American Journal of Agricultural Economics 70: 513-520. Yin, W. & S. DeVaney (2001). ‘Determinants of consumers’ use of debit cards
instead of cash and checks.’ Consumer Interests Annual 47.
Zinman, J. (2009). ‘Debit or credit?’ Journal of Banking and Finance 33(2): 358-366.
Figure 1 Daily number of POS debit card transactions In levels 0 2 4 6 8 10 12
Jan-05 Jan-06 Jan-07 Jan-08
Mi
ll
io
n
Source: Equens
Figure 2 Daily number of newspaper articles on debit card skimming fraud
0 10 20 30 40 50 60
Jan-05 Jan-06 Jan-07 Jan-08
Figure 3Actual and predicted number of debit card payments (by year)
-0.43% +0.06% -0.11% +0.04% -0.48% 0 500 1,000 1,500 2,000 2,500 2005 2006 2007 2008 2009 . Total number of debit card transactions (predicted by the cointegration equation)
Table 1 Results OLS regression with Newey-West St. Errors
COINTEGRATION EQUATION ERROR CORRECTION MODEL
Regressors logNRPOS Regressors ¨ logNRPOS
Monday 1.13614*** (.018) ¨ Monday 1.13544*** (.005) Tuesday 1.23537*** (.025) ¨ Tuesday 1.23508*** (.005) Wednesday 1.33711*** (.022) ¨ Wednesday 1.33730*** (.006) Thursday 1.39036*** (.026) ¨ Thursday 1.39163*** (.011) Friday 1.57566*** (.027) ¨ Friday 1.57617*** (.016) Saturday 1.67101*** (.026) ¨ Saturday 1.67079*** (.021) Week2 -.06256*** (.002) ¨ Week2 -.04569*** (.004) Week3 -.05180*** (.004) ¨ Week3 -.03399*** (.008) Week4 .02925*** (.004) ¨ Week4 -.00868 (.012) February -.00218 (.005) ¨ February -.00541 (.021) March .03821*** (.005) ¨ March -.03111 (.052) April .08673*** (.011) ¨ April .05097 (.097) May .10126*** (.007) ¨ May .08350 (.115) June .11717*** (.005) ¨ June .10869 (.125) July .05209*** (.006) ¨ July .13188 (.156) August .00759 (.006) ¨ August .06853 (.151) September .03791*** (.007) ¨ September .06165 (.160) October .05947*** (.005) ¨ October .14047 (.176) November .08174*** (.005) ¨ November .09822 (.192) December .17108*** (.007) ¨ December .17561 (.195) Valentine t-2 -.02295 (.061) ¨ Valentine t-2 -.02960 (.052)
Valentine t-1 -.01810 (.054) ¨ Valentine t-1 -.02957 (.029) Valentine t=0 .06572*** (.004) ¨ Valentine t=0 .04812*** (.012) Mothers t-3 -.00038 (.048) ¨ Mothers t-3 -.00022 (.032) Mothers t-2 .06120*** (.019) ¨ Mothers t-2 .06918*** (.024) Mothers t-1 .09619*** (.013) ¨ Mothers t-1 .11205*** (.028) Mothers t=0 -.07381*** (.028) ¨ Mothers t=0 -.04171* (.024) Fathers t-3 .06120*** (.010) ¨ Fathers t-3 .05833*** (.012) Fathers t-2 .04536*** (.009) ¨ Fathers t-2 .04509** (.018) Fathers t-1 .07812*** (.015) ¨ Fathers t-1 .08183*** (.016) Fathers t=0 -.10916*** (.027) ¨ Fathers t=0 -.10406*** (.010) Queen’s day t-3 .09725*** (.017) ¨ Queen’s day t-3 .09920*** (.019) Queen’s day t-2 .10642*** (.008) ¨ Queen’s day t-2 .11464*** (.026) Queens’ day t-1 .17893*** (.029) ¨ Queens’ day t-1 .18971*** (.036) Queens’ day t=0 -.68674*** (.028) ¨ Queens’ day t=0 -.66931*** (.045) Queens’ day t+1 .04250 (.034) ¨ Queens’ day t+1 .02164 (.019) Easter t-2 .15845*** (.023) ¨ Easter t-2 .15193*** (.019) Easter t-1 .11980*** (.018) ¨ Easter t-1 .12799*** (.037) Easter t=0 -.45622*** (.025) ¨ Easter t=0 -.45031*** (.021) Easter t+1 -.87613*** (.019) ¨ Easter t+1 -.86886*** (.006) Ascension t-2 .06244** (.031) ¨ Ascension t-2 .07213** (.036) Ascension t-1 .20474*** (.013) ¨ Ascension t-1 .22159*** (.049) Ascension t=0 -1.09658*** (.059) ¨ Ascension t=0 -1.07533*** (.019) Ascension t+1 .15574*** (.015) ¨ Ascension t+1 .17942*** (.021) Ascension t+2 -.09004*** ¨ Ascension t+2 -.05407**
(.016) (.025) Whitsun t=0 -.30799*** (.030) ¨ Whitsun t=0 -.33503*** (.016) Whitsun t+1 -.82538*** (.028) ¨ Whitsun t+1 -.85330*** (.011) St. Nicolas day t-3 .06575 (.050) ¨ St. Nicolas day t-3 .07973* (.047) St. Nicolas day t-2 .07324** (.035) ¨ St. Nicolas day t-2 .10550*** (.038) St. Nicolas day t-1 .02826*** (009) ¨ St. Nicolas day t-1 .07677* (044) St. Nicolas day t=0 -.06908*** (.012) ¨ St. Nicolas day t=0 -.00353 (.054) St. Nicolas day t+1 -.15113*** (.015) ¨ St. Nicolas day t+1 -.07048 (.043) Christmas t-5 .11923*** (.022) ¨ Christmas t-5 .12052*** (.022) Christmas t-4 .31670*** (.086) ¨ Christmas t-4 .32081*** (.099) Christmas t-3 .23399*** (.042) ¨ Christmas t-3 .29997** (.148) Christmas t-2 .46579*** (.132) ¨ Christmas t-2 .53716*** (.194) Christmas t-1 .44771*** (.112) ¨ Christmas t-1 .52439* (.270) Christmas t=0 -1.89385*** (.290) ¨ Christmas t=0 -1.8115*** (.053) Christmas t+1 -1.77399*** (.078) ¨ Christmas t+1 -1.68663*** (.028) New year t-1 -.14462 (.187) ¨ New year t-1 -.13243 (.186) New year t=0 -1.57872*** (.322) ¨ New year t=0 -1.59324*** (.041) Rain -.00019*** (.000) ¨ Rain -.00019*** (.000) Trend .00027*** (.000) PUBPOS t=0 -.01216** (.005) ¨ PUBPOS t=0 -.01319*** (.005) PUBPOS t-1 .00290 (.006) ¨ PUBPOS t-1 .00283 (.007) PUBPOS t-2 -.00100 (.008) ¨ PUBPOS t-2 -.00126 (.004) PUBATM t=0 -.00156 (.007) ¨ PUBATM t=0 -.00105 (.006) PUBATM t-1 .01075 (.007) ¨ PUBATM t-1 .01168* (.006)
PUBATM t-2 -.00311 (.008) ¨ PUBATM t-2 -.00111 (.006) Constant 13.7393*** (.018) Constant .00012 (.001)
Last period’s error correction term
-.92089*** (.047)
No. Observations 1454 No. Observations 1454
R-squared .980 R-squared .485 F-Statistic 56289.55 F-Statistic 143105.33 Prob(F-statistic) .0000 Prob(F-statistic) .0000 Durbin-Watson stat. 1.84148 * Significant at 10% level ** Significant at 5% level *** Significant at 1% level