CO
2Capture Plant at PFK
by
Kan Sze Wei
A project dissertation submitted in partial fulfillment of
the requirements for the
Bachelor of Engineering (Hons)
(Mechanical Engineering)
MAY 2012
Universiti Teknologi PETRONAS
Bandar Seri Iskandar
31750 Tronoh
i
CERTIFICATION OF APPROVAL
The Effect of Preferential Weld Corrosion Study in
CO2 Capture Plant at PFK
by
Kan Sze Wei
A project dissertation submitted to the
Mechanical Engineering Programme
Universiti Teknologi PETRONAS
in partial fulfillment of the requirement for the
BACHELOR OF ENGINEERING (Hons)
(MEHCHANICAL ENGINEERING)
Approved by,
__________________________
(AP Ir Dr Mokhtar bin Che Ismail)
UNIVERSITI TEKNOLOGI PETRONAS,
TRONOH, PERAK
ii
CERTIFICATION OF ORIGINALITY
This is to certify that I am responsible for the work submitted in this project,
that the original work is my own except as specified in the references and
acknowledgements, and that the original work contained herein have not
been undertaken or done by unspecified sources or persons.
______________________________________
KAN SZE WEI
iii
ABSTRACT
This paper discusses on the leakages issue due to severe localized corrosion attack along the pipeline (made from ASTM 106 B carbon steel) in the CO2 capture plant of PETRONAS Fertilizer Kedah (PFK) which its cause is still uncertain. The suspected cause was corrosion occurred to the high residual stresses trapped in the weldment region of the pipelines as the pipelines did not undergo post-welding heat treatment to release the stresses. The pattern of the corrosion suggested that Preferential Weld Corrosion (PWC) could have taken place in the pipelines. In order to investigate the relation of PWC and the leakages issue in PFK, the contribution of self corrosion rate of the Parent Metal, HAZ and Weld regions under the various conditions that includes saturated CO2, different concentration of caustic, KS-1, and under the temperature of 50oC will be studied. The methodology selected consists of EIS and LPR tests plus a basic metallographic observation between the three regions; Parent Metal, HAZ and Weld. It was found that when the corrosion rate is the highest under the condition of saturated CO2, 500ppm caustic, 250ppm KS-1 with 50oC and the Weld region has the highest corrosion rate in comparison with Parent Metal and HAZ regions for all conditions. It is therefore, concluded that the Weldment region (consists of HAZ and Weld) is prone to corrosion attack in comparison to Parent Metal region that was unaffected by the welding process. In the pursuit of a better answer to the issue, it is recommended that a research is done on the behavior of the different regions of the affected pipeline and to study further on the possible corrosive mixture of CO2, caustic and KS-1. Meanwhile, stress relieve heat treatment is suggested to be conducted on the welded pipelines to mitigate the corrosion problem.
iv
ACKNOWLEDGEMENTS
In regards to the completion of this project, I place my utmost gratitude to God for the endless blessings and guidance all this time.
My gratitude also goes to my supervisor, AP Ir. Dr. Mokhtar Che Ismail, who has shown much patience in giving me the guidance throughout the project. Dr. Mokhtar has always pinpointed the important aspects of the project and thus, directing me to the right path for my research. He has provided me reliable resources for my project.
I would also like to express my appreciation to Ms. Sarini who has also provided so much guidance and given me the assistance I required with the experiments. She was really generous in sharing her knowledge and keen in helping me when there were difficulties.
A special thanks to the lab technicians, Mr. Faisal and Mr. Nasir for their generous assistance in providing me the equipments needed for my lab experiments.
Last but not least, an utmost gratitude to my parents and fellow coursemates for their endless support which helped me to overcome the obstacles in between. And not forgetting, thank you to PETRONAS for the sponsorship which gave me the chance to complete my undergraduate studies in Universiti Teknologi PETRONAS.
v
TABLE OF CONTENTS
ABBREVIATIONS AND NOMENCLATURES . . . vii
LIST OF FIGURES . . . . . . . . viii
LIST OF TABLES . . . . . . . . x CHAPTER 1: INTRODUCTION . . . . . 1 1.1. Background Studies . . . . 1 1.2. Problem Statement . . . . 3 1.3. Objectives . . . . 4 1.4. Scope of Study . . . . 4
CHAPTER 2: LITERATURE REVIEW . . . . 5
2.1 Basic Concept of CO2 Corrosion . . 5 2.2 Factors Affecting CO2 Corrosion . . 6 2.3 Preferential Welding Corrosion . . 7
CHAPTER 3: METHODOLOGY . . . . . 10
3.1. Phase 1 . . . 12
3.2 Phase 2 . . . 15
3.2.1 Equations Involved in Self Corrosion Test 17
CHAPTER 4: RESULTS & DISCUSSION . . . 18
4.1 Metallographic Results . . . 18
4.2 EIS Self Corrosion Test Results . . 20 4.2.1 Saturated CO2 3% NaCl Solution at 50oC 20 4.2.2 Saturated CO2 3% NaCl Solution with . 24
vi
4.2.3 Saturated CO2 3% NaCl Solution with . 28 500ppm caustic, 50oC
4.2.4 Saturated CO2 3% NaCl Solution with . 32 250ppm caustic and 250ppm KS-1, 50oC
4.2.5 Saturated CO2 3% NaCl Solution with . 36 500ppm caustic and 500ppm KS-1, 50oC
CHAPTER 5: CONCLUSION . . . . . 39
CHAPTER 6: RECOMMENDATIONS . . . . 40
CHAPTER 7: REFERENCES . . . . . 42
vii
ABBREVIATIONS AND NOMENCLATURES
Ag/AgCl Argentum/Argentum Chloride
CO2 Carbon Dioxide
EDM Electrical Discharge Machine
HAZ Heat Affected Zone
HSS Heat Stable Salts
NaOH Sodium Hydroxide
O2 Oxygen
PFK PETRONAS Fertilizer Kedah
PWC Preferential Weld Corrosion
PWHT Post-Welding Heat Treatment
PVC Polivinyl Chloride
viii
LIST OF FIGURES
FIGURE 1.1 Location of Failures/Leakages in the PFK PCO2 Plant 2
FIGURE 2.1 Corrosion Mechanism of Carbon Steel in H2O-CO2 system 6
FIGURE 3.1 The Methodology Flow Chart Diagram 10
FIGURE 3.2 A Shortened Carbon Steel Pipe 13
FIGURE 3.3 A longitudinal part (approximately 1cm in width) was cut from the shortened pipe for metallographic analysis
13
FIGURE 3.4 A closer view on the longitudinal part that was removed dubbed as Sample #1
14
FIGURE 3.5 The Experiment Setup 16
FIGURE 4.1 Sample #1 and the Three Analyzed Areas 18
FIGURE 4.2 Parent Metal Area (after etching; magnification of 100) 18
FIGURE 4.3 HAZ Area (after etching; magnification of 100) 19
FIGURE 4.4 Weld Area (after etching; magnification of 100) 19
FIGURE 4.5 Nyquist Plots of Sample in CO2 Saturated 3% NaCl Solution at 50oC after 1, 6, and 12 hours of immersion for (a) Parent Metal (b) HAZ (c) Weld
21
FIGURE 4.6 Bode Plots of Sample in CO2 Saturated 3% NaCl Solution at 50oC after 1, 6, and 12 hours of immersion for (a) Parent Metal (b) HAZ (c) Weld
22
FIGURE 4.7 Nyquist Plots of Sample in CO2 Saturated 3% NaCl Solution with 250ppm Caustic at 50oC after 1, 6, and 12 hours of immersion for (a) Parent Metal (b) HAZ (c) Weld
25
FIGURE 4.8 Figure 4.8: Bode Plots of Sample in CO2 Saturated 3% NaCl Solution with 250ppm Caustic at 50oC after 1, 6, and 12 hours of immersion for (a) Parent Metal (b) HAZ (c) Weld
ix
FIGURE 4.9 Nyquist Plots of Sample in CO2 Saturated 3% NaCl Solution with 500ppm Caustic at 50oC after 1, 6, and 12 hours of immersion for (a) Parent Metal (b) HAZ (c) Weld
29
FIGURE 4.10 Bode Plots of Sample in CO2 Saturated 3% NaCl Solution with 500ppm Caustic at 50oC after 1, 6, and 12 hours of immersion for (a) Parent Metal (b) HAZ (c) Weld
30
FIGURE 4.11 Nyquist Plots of Sample in CO2 Saturated 3% NaCl Solution with 250ppm Caustic and 250ppm KS-1 at 50oC after 1, 6, and 12 hours of immersion for (a) Parent Metal (b) HAZ (c) Weld
33
FIGURE 4.12 Bode Plots of Sample in CO2 Saturated 3% NaCl Solution with 250ppm Caustic and 250ppm KS-1 at 50oC after 1, 6, and 12 hours of immersion for (a) Parent Metal (b) HAZ (c) Weld
34
FIGURE 4.13 Nyquist Plots of Sample in CO2 Saturated 3% NaCl Solution with 500ppm Caustic and 250ppm KS-1 at 50oC after 1, 6, and 12 hours of immersion for (a) Parent Metal (b) HAZ (c) Weld
37
FIGURE 4.14 Nyquist Plots of Sample in CO2 Saturated 3% NaCl Solution with 500ppm Caustic and 250ppm KS-1 at 50oC after 1, 6, and 12 hours of immersion for (a) Parent Metal (b) HAZ (c) Weld
x
LIST OF TABLES
TABLE 3.1 Test matrix for experiment sets that will be conducted 11
TABLE 3.2 Test matrix for the chemicals used during experiment 11
TABLE 3.3 Details of concentration of chemicals used in each experiment 12 TABLE 4.1 Corrosion rate in mm/yr for the 3 tested regions Sample in CO2
Saturated 3% NaCl Solution at 50oC after 1, 6, and 12 hours of immersion
23
TABLE 4.2 Corrosion rate in mm/yr for the 3 tested regions Sample in CO2 Saturated 3% NaCl Solution with 250ppm caustic at 50oC after 1, 6, and 12 hours of immersion
27
TABLE 4.3 Corrosion rate in mm/yr for the 3 tested regions Sample in CO2 Saturated 3% NaCl Solution with 500ppm caustic at 50oC after 1, 6, and 12 hours of immersion
31
TABLE 4.4 Corrosion rate in mm/yr for the 3 tested regions Sample in CO2 Saturated 3% NaCl Solution with 250ppm caustic and 250ppm KS-1 at 50oC after 1, 6, and 12 hours of immersion
35
TABLE 4.5 Corrosion rate in mm/yr for the 3 tested regions Sample in CO2 Saturated 3% NaCl Solution with 500ppm caustic and 250ppm KS-1 at 50oC after 1, 6, and 12 hours of immersion
1
CHAPTER 1 INTRODUCTION
1.1 Background Studies
PETRONAS Fertilizer (Kedah) Sdn. Bhd. also known as PFK is fertilizer plant. One of its units is called CO2 capture plant, PCO2 that utilize the flue gas from the primary reformer to recover CO2 as a feedstock for the urea plant. In this particular recovery process, three main equipments are involved which are the Flue Gas Cooler (C-22-01), CO2 Absorber (C-22-01), and CO2 Regenerator (C-22-03). Several leakages were detected at 22-LG-08 lower leg (shell of C-22-03), leak at 22-LG-04 weld (refer to Figure A), pin-hole leak at 6” KS-1 inlet piping (refer to Figure B), inlet piping weld, pin-hole leak at E-22-03 inlet piping (refer to Figure C). CO2 is transferred to the CO2 regenerator through piping system and the piping contains KS-1 rich solution which is used to capture the CO2 in the capture process and later reverse the process in regenerator. KS-1 forms soluble salts when it reacts with CO2 hence, caustic is injected to reduce the formation of the soluble salts or otherwise known as HSS (heat stable salts).
Observations recorded that the leakages mostly occurred at highly-stressed areas such as weld and heat affected zone (HAZ). It is known that the welded part of pipes did not undergo post-welding heat treatment to release the residual stresses in the weldment region after the welding. There was no heat treatment for the weldment because the operating temperature of the plant was relatively low and believed that it will not cause any corrosion such as caustic corrosion, hence, the heat treatment was not needed.
2
Figure 1.1: Location of Failures/Leakages in the PFK PCO2 Plant
Initially, the failures were predicted to be related to these three types of corrosion; carbonic acid corrosion due to the carbonic acid and since there is a high concentration of dissolved CO2 in the plant, caustic corrosion due to the presence of sodium from reclaiming activity, and amine corrosion due to the presence of amine degradation product (chelate). The report stated its issues regarding determining the real underlying causes behind these failures and they are mainly related to the lack of information and analytical data from the laboratories regarding the properties of the KS-1 solution,
3
corrosion properties of materials (of the pipelines such as the composition of the metal and type of welding done), specification of caustic injection quantities, and morphologies data of the failures. Since then, a few studies have been conducted. Analytical studies were conducted on providing deeper understanding on the properties of the KS-1 and caustic.
Experiments were conducted using KS-1, caustic, and CO2 with carbon steel pipes (consist with weld, HAZ, and parent metal), in hope to find the relation in between these few possible factors. From the results of the earlier experiments, the weldment regions had higher corrosion rate in comparison to non-weldment regions.
1.2 Problem Statement
The leakages were observed to occur around highly stressed regions such as weld and HAZ regions (weldment) of the pipe. The weldment did not undergo heat treatment in the welding process since the operating temperature of the plant is relatively low. The decision of not conducting heat treatment was believed to be rational as it was believed that corrosion will not occur since operating temperature is not high (corrosion tends to occur in high temperatures). However, the situation contradicted the decision as leakages occurred along the pipelines. Due to this, Preferential Weld Corrosion (PWC) might have been the case and caused leakages along the pipeline, especially the weldment regions of the pipes.
A corrosive mixture could be the factor due to the mixed chemical in the pipeline that is used to capture CO2. This corrosive mixture will need experiments and tests in order to get the real composition of the corrosive mixture.
4
1.3 Objectives of Study
The main objective of this study is to further study on the reasons to the occurrence of the serious localized corrosion along the pipelines and the conditions that contributed to the corrosion. This study also intends to discover the tendency level of the weldment region to corrode in comparison to the non-weldment regions.
i) To determine the contribution of self corrosion rate of the Parent Metal, HAZ and Weld regions under the various conditions that includes saturated CO2, different concentration of caustic, KS-1, and under the temperature of 50oC.
1.4 Scope of Study
The research is focused on the self corrosion rate of the Parent Metal, HAZ, and Weld regions of carbon steel (ASTM 106 B) at pH5, with (or without) 1 bar CO2 pressure and a under the temperature of 50oC, under stagnant environment with the presence of different concentration of caustic and/or KS-1. The corrosion rate for Parent Metal, HAZ, and Welds are electrochemically determined in isolated and connected by measuring their EIS self corrosion rate respectively.
5
CHAPTER 2 LITERATURE REVIEW
2.1 Basic Concept of CO2 Corrosion
Alawadhi (2009) stated that carbon dioxide corrosion is a common yet serious issue in the oil and gas industry, and it gives serious wreckage to the facilities; Kermani & Morshed (2003) shared the same view too. Under the presence of high concentration of CO2, Sun et. al. (2012) stated that the CO2 corrosion causes failure to pipelines and equipments used in the oil and gas industry. Moreover, Choi et. al. (2006) and Yang et. al. (2010) both said emissions from fossil fuel-fired power plants had contributed a significant level of carbon dioxide (CO2) emissions to the environment.
George and Nesic (2007) explain that CO2 gas dissolves in water and then forms a weak carbonic acid through hydration due to contact with water. The carbonic acid will continue to dissociate to form bicarbonate ion which can further dissociate to form H2CO3. According to de Waard and Milliams (1975), the concentration of the undissociated H2CO3 directly affects the corrosion rate of a mild steel surface.
The image below was given by Banas et. al. (2007) that gives the picture of the mechanism of CO2 corrosion mechanism when a carbon steel is in a CO2 environment.
6
Fig 2.1: Corrosion Mechanism of Carbon Steel in H2O-CO2 system
2.2 Factors Affecting CO2 Corrosion
According to Sun et. al. (2012), CO2 corrosion is difficult to be understood as many factors could affect the corrosion process and the mechanism is still not well understood, until today. There are various factors that are involved in CO2 corrosion. Sridharan (2009) listed a few; pH, partial pressure of CO2, temperature, concentration of Fe2+ ions, and hydrodynamics while Kermani & Morshed (2003) added a few more such as steel chemistry and H2S content.
Kermani & Morshed (2003) extracted this information in their paper; the pH value of the solution influence both the electrochemical reactions which then causes iron dissolution and precipitation of protection scales hence, ultimately controlling the corrosion rate but not entirely.Sridharan (2009) found that corrosion rate is sensitive when the pH is low (<4) than when the pH value is high (>6). However, Groysman (2010) said it depends on the anion type of acid as not every type of acid influences the corrosion rate because in some cases, sulphuric acid is stored in carbon steel tanks cladded with lead, and yet no serious corrosion occurs.
7
Kermani & Morshed (2003) discussed that the corrosion rate increases as temperature increases. However, the corrosion rate does not increase infinitely; it only increases to a certain temperature, as stated by Alawadhi (2009). It is recognized that the two significant temperature ranges recognized by the research and technology department which according to Alawadhi (2009) are low temperature (<60oC) and high temperature (60oC – 150oC). In fact, many authors or researchers have found that temperature influences the conditions in forming the protective iron carbonate layers. The protective layer needs a certain time to form and once formed, corrosion rate will be lower and Alawadhi (2009) said this will happen when temperature is in between 60oC – 80oC.
Other than pH value and temperatures, velocity is one of the common factors that affect CO2 corrosion that is being studied. Alawadhi (2009) commented that flow of solution is a crucial factor as it is involved in the process of completing or controlling partial mass control. In one experiment conducted by George & Nesic (2007), the returned results said corrosion potential and anodic reaction did not react to the velocity changes. However, in another study by Schmitt & Horstemeier (2006), they stated that corrosion rate increases when flow velocity is increased but the critical flow density protective films will be destructed by near-wall turbulence elements. This prevents the protective film from reforming and that location is now susceptible to corrosion attack.
2.3 Preferential Weld Corrosion (PWC)
In oil and gas, the pipelines are usually made from carbon steel and the joints are welded together. In an environment that contains high level of CO2, corrosion tends to happen and PWC gives a bad damage to the equipments. Alawadhi & Robinson (2011) mentioned that galvanic corrosion could occur among the different regions of a weld since they have different composition and microstructure. Hence, the weld metal material must be nobler that the parent metal material in order to avoid a serious galvanic corrosion. At the same time, microstructure plays an important role in PWC such as, HAZ area has a different microstructure than the parent metal since the area was affected by heat. This difference is a contributing factor to PWC.
8
Lee et. al., (2005) stated that there was an increasing occurrence of PWC in carbon and low alloy steels pipelines in CO2-containing media. They had a comparison between welds that contained nickel, chromium, silicon, and molybdenum alloying additions, nominally matching filler welds, and autogeneous welds. The effects of the composition indeed gave a different corrosion rates; welds with matching filler and autogeneous welds gave lower corrosion rate and better resistance to PWC but it was the reverse reaction when it comes to alloyed welds, especially the weld with nickel addition. In their further analyzing regarding the microstructure of the metals, they stated there was a reasonable correlation between the microstructure and PWC (for metals with no alloying). The welding process had caused a change in the microstructure in the weld area and HAZ. Unrefined weld metals tended to give PWC while refined weld metals gave lower corrosion rates. They concluded that PWC is influenced by the hardness, grain size, and level of aligned second phase and the level of refinement of the root by the subsequent passes. However, as seen, Lee et. al. (2005) did no analysis on carbon steel ASTM 106 B and no inhibitor was involved. The test method applied is also different; test vessel was used oxygen was involved in the experiment as well. There are still similarity which is the EIS to calculate the corrosion rate.
Davis (2006) also pointed out that for welded carbon and low alloy steel, presence of welding residual stresses that could lead to stress-corrosion cracking and weld discontinuities (such as surface flaws) would be a preferred target for localized corrosion attack. He also stated that weld areas had the susceptibility to hydrogen-containing environment which will preferably lead to cracking as well. (pg. 15)
In another paper of studies done by Alawadhi & Robinson (2011), it studies the PWC in a similar situation as PFK; carbon pipelines carrying hydrocarbons, inihibitor, and CO2. They also focused on parent metal , HAZ, and weld areas. Unlike Lee et. al. (2005), Alawadhi & Robinson (2011) include inhibitor into their analysis and it was concluded in the paper that PWC was caused by unstable conditions in which the inhibitor film was selectively disrupted on the weld metal but remained effective on the other weld areas. However, the carbon steel utilized in this paper was not ASTM 106 B. Instead, a X65 steel pipe was tested. Both are carbon steel but a different composition brings different
9
microstructure and mechanical properties. Both Lee et. al. (2005) and Alawadhi & Robinson (2011) mentioned that microstructure of the metal affects the corrosion rate.
10
CHAPTER 3 METHODOLOGY
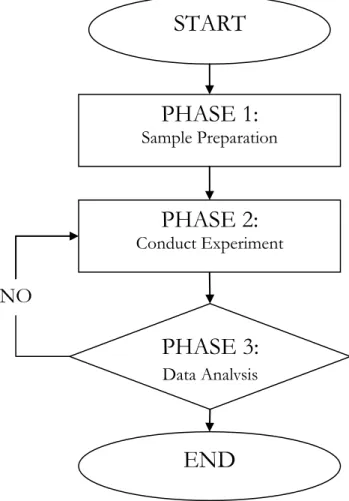
There will be three stages of experiment and tests in order to achieve the required objectives stated above. The flow chart beneath signifies the flow of the stages of the study.
Figure 3.1: The methodology flow chart diagram
START
PHASE 1:
Sample PreparationPHASE 2:
Conduct ExperimentPHASE 3:
Data AnalysisEND
NO
11
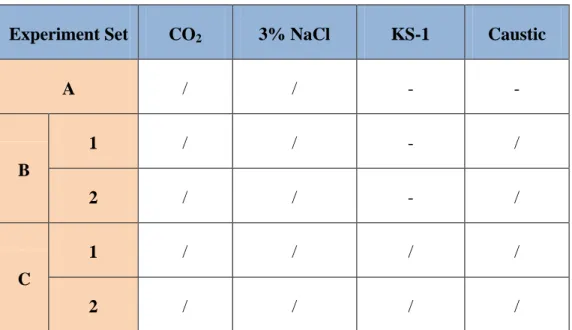
Experiment Set CO2 3% NaCl KS-1 Caustic
A / / - - B 1 / / - / 2 / / - / C 1 / / / / 2 / / / /
Table 3.1: Test matrix for experiment sets that will be conducted
Parameters
Remarks
Solution Caustic, KS-1
Gas CO2
pH pH will be measured for every test
Pressure 1 bar
Rotational Velocity (rpm) Stagnant
Temperature (oC) 50
Concentration of Caustic (ppm) Concentration of KS-1 (ppm)
250 and 500 (for Experiment set A and B) 250 (Experiment set B)
Test duration (hours) 1, 6, 12
12
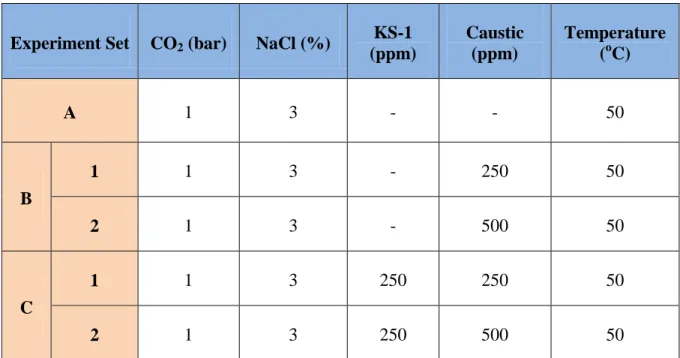
Experiment Set CO2 (bar) NaCl (%)
KS-1 (ppm) Caustic (ppm) Temperature (oC) A 1 3 - - 50 B 1 1 3 - 250 50 2 1 3 - 500 50 C 1 1 3 250 250 50 2 1 3 250 500 50
Table 3.3: Details of concentration of chemicals used in each experiment
3.1 PHASE 1: Sample Preparation
The sample which will be ASTM 106 B carbon steel (the exact metal used for pipelines in PFK), will undergo four preparation stages in order to prepare it as a working electrode for the coming experiments. The processes are:
i) Cutting process
ii) Metallographic analysis iii) Sectioning process iv) Cold mounting
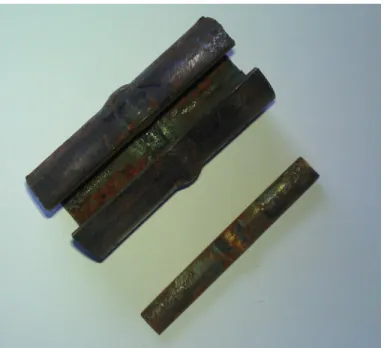
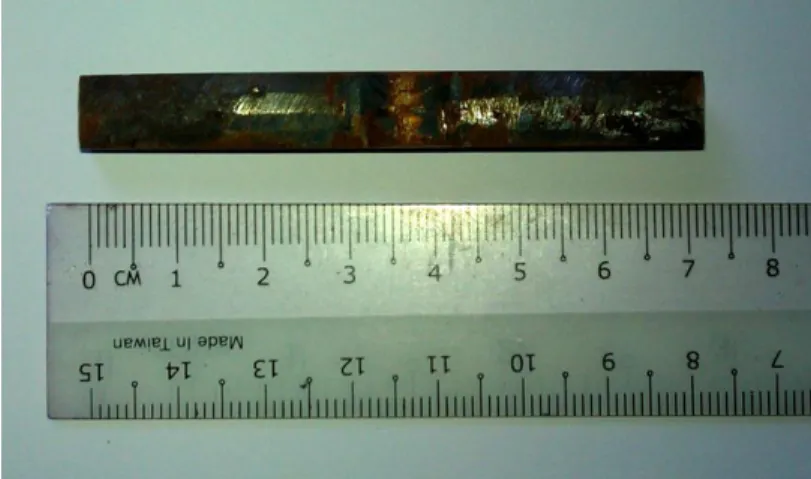
A welded carbon steel pipe is received to be used as the sample for the experiments. The pipe has a welded region in the middle. Since the length of the pipe was inappropriate, the pipe was shorten by cutting only the part that will be analyzed. Cold saw machine is used to cut the pipe which is less abrasive than the abrasive cutter due to the water as lubricant during the cutting process. Later on, using EDM wire cut machine, a part (that
13
consists of the weld, HAZ, and parent metal) is cut out from the pipe for metallographic analysis (the width is 1cm) and this will be the sample #1.
Figure 3.2: A shorter carbon steel pipe
Figure 3.3: A longitudinal part (approximately 1cm in width) was cut from the shortened pipe for metallographic analysis
14
Figure 3.4: A closer view on the longitudinal part that was removed dubbed as Sample #1
During the metallographic analysis, sample #1 will undergo grinding with silicon carbide paper grit between #60 to #1200 in order to obtain a flawless surface (mirror shine surface). The samples are then rinsed with distilled water and ethanol to remove dirt and contaminants from the surface, and also to prevent it from corrosion since carbon steel easily corrodes when exposed to air. Sample #1 is then blow dried using a hot dryer machine. Then, sample #1 was sent for observation under the metallographic microscope to see the surface under 5X and 10X magnification. Next, the sample #1 is etched with freshly mixed 2% nital solution to further reveal the microstructure (alpha grain can be seen using nital solution). Sample #1 was then sent for observation again under metallographic microscope to observe the microstructure under 10X – 50 X magnifications.
After metallographic analysis of sample #1, the coming experiments will need five welded carbon steel pipelines as the samples (sample #2, #3, #4, #5 and #6) to be placed in five glass cells and it will be in small sizes called coupons. EDM wire cutting machine will be used to section the five samples into three parts each in which, the three parts will be identified as parent metal, HAZ, and weld areas in a ratio of 4:2:1; in order to represent the field condition. These coupons are then soldered with insulated copper wire for electrical connection and slotted through clear PVC tube to provide support for the
15
wire. A part of the copper wire was exposed out from the end of the PVC tube which will be clipped to connect to the EIS analyzer.
For the cold mounting process, the coupons/samples will be cast into epoxy resin in linear arrangement in a 30mm diameter mould to produce a working electrode. The working electrode will also be grind and polished with silicon carbide paper from #600 to #1200, and then rinsed with distilled water and ethanol to prevent from contamination and corrosion. The working electrode was then blow dried with a hot dryer machine and then placed in desiccators prior to use.
3.2 PHASE 2: Conducting Experiment (Self Corrosion Test)
Using the five samples/working electrodes that were prepared (cut into tokens and mounted), self corrosion tests will be conducted.
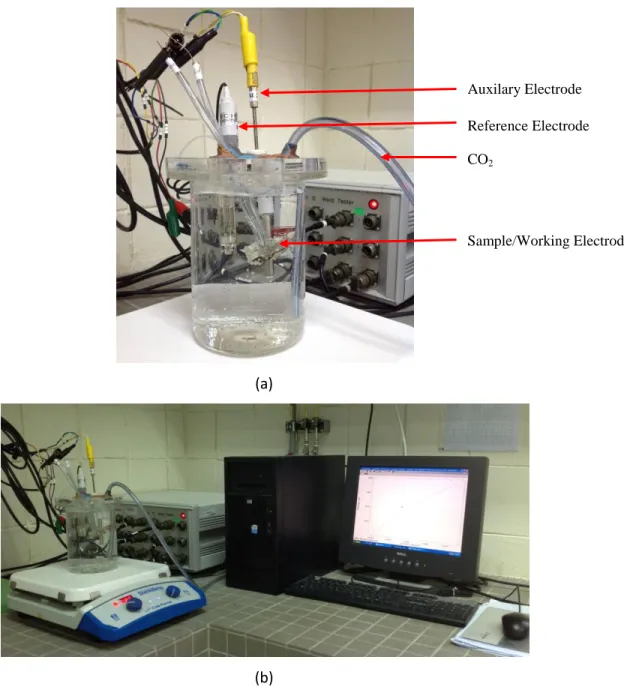
All experiments will be conducted in 1 liter glass cell equipped with Ag/AgCl reference electrode and stainless steel as the auxiliary electrode. Reference electrode function is to measure potential between the working electrode and the reference electrode and auxiliary electrodes as the current path. CO2 gas will be purged into 1 liter of 3% NaCl solution for at least 1 hour at 1 bar pressure. The purging step is applied to every experiment setup.
Note that the sample/working electrode must be placed as near as possible to the reference electrode. This is to minimize or avoid the effect of the solution resistance. The resistance could make a significant effect to the end results.
16 (a)
(b)
Figure 3.5 (a) and (b) The experiment setup
The working electrode will then be immersed into the solution under the constant purging of CO2, and allow it to pre-corrode for 1 hour to allow standardization between working electrode and solution (applied to all experiments).
The chemicals/solvents that are involved in this experiment will be distilled water, carbon dioxide (CO2) gas, KS-1, and caustic
Auxilary Electrode
Reference Electrode
Sample/Working Electrode CO2
17
For self corrosion test, EIS measurement technique will be employed to measure the corrosion rate, electrical properties of the passive layer and effects of corrosion inhibitor on corrosion resistance. Impedance data will be computed within the frequency range of 30Hz to 30kHz with amplitude of 5 rms after 1, 6 and 12 hours of working electrode immersion. Data is presented in the form of Nyquist from EIS data acquisition. The data is then fitted into an equivalent circuit by using the EIS analyzer software (EISSA). This will provide the data that are related to the corrosion of steel substrate.
3.2.1 Equations Involved in Self Corrosion Test Polarization Resistance,
From the above, Proportionality Constant,
Corrosion Rate (mm/year),
From the above, K is the metal factor.
18
CHAPTER 4
RESULTS & DISCUSSION
4.1 METALLOGRAPHIC ANALYSIS RESULTS
Figure 4.1.: Sample #1 and the three analyzed areas
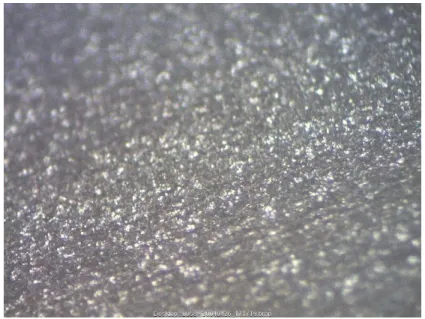
Figure 4.2: Parent Metal Area (after etching; maginification 100) Weld
HAZ Parent Metal
Steel
19
Figure 4.3: HAZ Area (after etching; magnification of 100)
Figure 4.4 Welment Area (after etching; magnification of 100)
The figures above are from an etched sample #1. Comparing the three figures above, there is a distinct difference between them. Parent metal is seen to have a larger grains structure, the HAZ has an almost entirely dark gray smooth-like structure, and the weldement area shows very little gray part but otherwise for silver. The gray coloured
20
part of the figures above is actually the carbon composition in the carbon steel pipe while the silver is the steel.
In the parent metal, it can be said the carbon and the steel each has their own fair share of composition in the sample; with carbon content slightly more steel. In the HAZ area, the grains are significantly smaller than parent metal area. For the weld area, the carbon content is significantly lesser as most of the structure is covered silver colour (steel). It is understood the higher carbon content, the harder the steel will be. From these three figures, it can be said that the hardness differs from each other especially in weld area; the weld area seems to have the least hardness. In HAZ area, the carbon content seems to be significantly more and having high carbon content would lead to a brittle metal and cracks would tend to form.
4.2 EIS Self Corrosion Test Results
4.2.1 Saturated CO2 3% NaCl Solution at 50oC
Nyquist plots of the sample in the condition of saturated CO2 and 3% NaCl solution at 50oC for various immersion time are presented in Figure ? (a) Parent Metal, (b) HAZ, and (c) Weld while bode plots were represented by Figure ? (a) Parent Metal (b) HAZ, and (c) Weld.
From the nyquist plots, a depressed semicircle pattern can be observed from the figures for every region (Parent Metal, HAZ, and Weld). The diameter of the semicircle pattern decreased with the increasing immersion time and this applies to all three regions. The bode plots consists of impedence line and phase angle line, both were in consistent pattern for all three regions; both impedence and phase angle decreased with increasing time.
21
(a) Parent Metal
(b) HAZ
(c) Weld
Figure 4.5: Nyquist Plots of Sample in Saturated CO2 3% NaCl Solution at 50 o
C after 1, 6, and 12 hours of immersion for (a) Parent Metal (b) HAZ (c) Weld
0 20 40 60 80 100 120 140 0 20 40 60 80 100 120 140 Z" (o h m .cm ²) Z' (ohm.cm²) 1 hour 6 hours 12 hours 0 20 40 60 80 100 120 140 0 20 40 60 80 100 120 140 Z" (o h m .cm ²) Z' (ohm.cm²) 1 hour 6 hours 12 hours 0 20 40 60 80 100 120 140 0 20 40 60 80 100 120 140 Z" (o h m .cm ²) Z' (ohm.cm²) 1 hour 6 hours 12 hours
22
(a) Parent Metal
(b) HAZ
(c) Weld
Figure 4.6: Bode Plots of Sample in Saturated CO2 3% NaCl Solution at 50 o
C after 1, 6, and 12 hours of immersion for (a) Parent Metal (b) HAZ (c) Weld
-10 0 10 20 30 40 50 60 -20 30 80 130 180 0.01 1 100 10000 Ph ase A n gl e ( °) Im p e d an ce (o h m .cm ²) Frequency (Hz) 1 hour 6 hours 12 hours -20 -10 0 10 20 30 40 50 60 0 20 40 60 80 100 120 140 0.01 1 100 10000 Ph as e An gl e ( °) Im p e d an ce (o h m .cm ²) Frequency (Hz) 1 hour 6 hours 12 hours -20 -10 0 10 20 30 40 50 60 0 20 40 60 80 100 120 140 0.01 1 100 10000 Ph ase A n gl e ( °) Im p e d an ce (o h m .cm ²) Frequency (Hz) 1 hour 6 hours 12 hours
23
The corrosion rates of the sample are recorded in Table 4.1. Observing the corrosion rate of Parent Metal, the corrosion rate is constant throughout the 12 hours of immersion. However, in the case for HAZ and Weld regions, the corrosion rate is higher and increases with the increasing immersion time. This shows that the weldment region (consists of HAZ and Weld) is more prone to corrosion in an acidic environment. The results agree with the possible occurrence of PWC in the metal.
Region Immersion Time
(hours) Rp (ohm.cm 2 ) Corrosion Rate (mm/yr) Parent Metal 1 6 12 145.9 120.39 85.914 0.1 0.1 0.1 HAZ 1 6 12 78.96 66.463 49.99 0.2 0.3 0.4 Weld Metal 1 6 12 68.017 65.961 43.669 0.3 0.3 0.4
Table 4.1: Corrosion rate in mm/yr for the 3 tested regions Sample in Saturated CO2 3%
24
4.2.2 Saturated CO2 3% NaCl Solution with 250ppm caustic, 50oC
Nyquist plots of the sample in the condition of saturated CO2, 3% NaCl solution with the presence of 250ppm of caustic at 50oC for various immersion time are presented in Figure ? (a) Parent Metal, (b) HAZ, and (c) Weld.
From the figures below, it can be observed that the patterns of the graph are relatively unstable. In Figure ? (a) for Parent Metal, the 1-hour line stretches to a Z’ value that was too large to compare. The same case seems to happen to HAZ as well. However, for the Weld region, the 1-hour only took a short range of Z’. The 12-hours lines for all three figures were observed to be not in a semicircle pattern as well. This is probably affected by the connection between the samples/working electrodes and the EIS analyzer. Results could be invalid.
Bode plot for the Weld region was significantly different from Parent Metal and HAZ. A sudden rise was noticed in the impedence line at the sixth hour.
25
(a) Parent Metal
(b) HAZ
(c) Weld
Figure 4.7: Nyquist Plots of Sample in CO2 Saturated 3% NaCl Solution with 250ppm
Caustic at 50oC after 1, 6, and 12 hours of immersion for (a) Parent Metal (b) HAZ (c) Weld
0 50 100 150 200 250 300 350 400 0 50 100 150 200 250 300 350 400 Z" (o h m .cm ²) Z' (ohm.cm²) 1 hour 6 hours 12 hours 0 50 100 150 200 250 300 0 50 100 150 200 250 300 Z'' (o h m .cm ²) Z' (ohm.cm²) 1 hour 6 hours 12 hours 0 50 100 150 200 250 300 0 50 100 150 200 250 300 Z' ' ( o h m .cm ²) Z' (ohm.cm²) 1 hour 6 hours 12 hours
26
(a) Parent Metal
(b) HAZ
(c) Weld
Figure 4.8: Bode Plots of Sample in CO2 Saturated 3% NaCl Solution with 250ppm Caustic
at 50oC after 1, 6, and 12 hours of immersion for (a) Parent Metal (b) HAZ (c) Weld
-20 -10 0 10 20 30 40 50 60 0 200 400 600 800 1000 0.01 1 100 10000 Ph ase A n gl e ( °) Im p e d an ce (o h m .cm ²) Frequency (Hz) 1 hour 6 hours 12 hours -20 -10 0 10 20 30 40 50 60 0 200 400 600 800 1000 0.01 1 100 10000 Ph ase A n gl e ( °) Im p e d an ce (o h m .cm ²) Frequency (Hz) 1 hour 6 hours 12 hours -40 -20 0 20 40 60 0 50 100 150 200 250 300 0.01 1 100 10000 Ph ase A n gl e ( °) Im p e d an ce (o h m .cm ²) Frequency (Hz) 1 hour 6 hours 12 hours
27
The corrosion rates of the sample are recorded in Table 4.2. The Rp gradually increases for most cases and the corrosion rates were constant for Parent Metal and HAZ. A drop in the corrosion rate of the weld metal in the twelfth hour was observed.
In this experiment set, 250ppm of caustic was injected into the solution. The caustic is actually NaOH, and alkaline chemical. The alkaline chemical is able to neutralize the acidic environment (due to the saturated CO2) in the solution and as the environment turns neutral, the corrosion rate will decrease.
This probably means, in this condition, these three regions were pretty well protected from corrosion attack with the presence of 250ppm caustic. As compared to the first experiment set where there were no presence of caustic and KS-1, corrosion rate increases as immersion time increases.
Region Immersion Time
(hours) Rp (ohm.cm 2 ) Corrosion Rate (mm/yr) Parent Metal 1 6 12 217.16 190.60 222.07 0.1 0.1 0.1 HAZ 1 6 12 312.47 303.25 320.58 0.1 0.1 0.1 Weld Metal 1 6 12 95.715 131.56 150.37 0.2 0.2 0.1
Table 4.2: Corrosion rate in mm/yr for the 3 tested regions Sample in CO2 Saturated 3%
28
4.2.3 Saturated CO2 3% NaCl Solution with 500ppm caustic, 50oC
Nyquist plots of the sample in the condition of saturated CO2, 3% NaCl solution with the presence of 500ppm caustic at 50oC for various immersion time are presented in Figure ? (a) Parent Metal, (b) HAZ, and (c) Weld. The environment is relatively acidic.
The semicircle pattern here has an increasing diameter as the immersion time increases. Note that Weld has the shortest range of Z’ by the time the immersion time was 12 hours, in comparison with Parent Metal and HAZ. The shorter the range, it means, the region has a higher tendency to corrode. When comparing HAZ to Parent Metal, HAZ has a shorter range of Z’ at 12-hours of immersion time. This explains these two regions that had a different microstructure after exposed to heat are more prone to corrosion.
Bode plots showed a consistent pattern for all three regions; applies to both impedence and phase angel graphs.
29
(a) Parent Metal
(b) HAZ
(c) Weld
Figure 4.9: Nyquist Plots of Sample in CO2 Saturated 3% NaCl Solution with 500ppm
Caustic at 50oC after 1, 6, and 12 hours of immersion for (a) Parent Metal (b) HAZ (c) Weld
0 50 100 150 200 250 300 0 50 100 150 200 250 300 Z" (o h m .cm ²) Z (ohm.cm²) 1 hour 6 hours 12 hours 0 50 100 150 200 250 300 0 50 100 150 200 250 300 Z" (o h m .cm ²) Z (ohm.cm²) 1 hour 6 hours 12 hours 0 50 100 150 200 250 300 0 50 100 150 200 250 300 Z" (o h m .cm ²) Z (ohm.cm²) 1 hour 6 hours 12 hours
30
(a) Parent Metal
(b) HAZ
(c) Weld
Figure 4.10: Bode Plots of Sample in CO2 Saturated 3% NaCl Solution with 500ppm
Caustic at 50oC after 1, 6, and 12 hours of immersion for (a) Parent Metal (b) HAZ (c) Weld
-20 0 20 40 60 80 0 50 100 150 200 250 300 0.01 1 100 10000 Ph ase A n gl e ( °) Im p e d an ce (o h m .cm ²) Frequency (Hz) 1 hour 6 hours 12 hours -20 0 20 40 60 80 0 50 100 150 200 250 300 0.01 1 100 10000 P h as e A n gl e (° ) Im p e d an ce (o h m .cm ²) Frequency (Hz) 1 hour 6 hours 12 hours -20 0 20 40 60 80 0 50 100 150 200 250 300 0.01 1 100 10000 Ph ase A n gl e ( °) Im p e d an ce (o h m .cm ²) Frequency (Hz) 1 hour 6 hours 12 hours
31
The corrosion rates of the sample are recorded in Table 4.3. Even with a higher concentration of caustic, the corrosion rates for the tested regions were around the same as the previous results.
For both condition (250ppm caustic and 500ppm caustic), the Weld region has a higher corrosion rate in comparison to Parent Metal and HAZ but the corrosion rate remains constant throughout the immersion; not signifying any increasing or serious corrosion occurrence. It seems, the Weld region has a higher tendency to corrode in all types of condition.
Region Immersion Time
(hours) Rct (ohm.cm 2 ) Corrosion Rate (mm/yr) Parent Metal 1 6 12 196.03 222.27 227.55 0.1 0.1 0.1 HAZ 1 6 12 145.97 168.08 176.18 0.1 0.1 0.1 Weld Metal 1 6 12 100.72 113.40 117.38 0.2 0.2 0.2
Table 4.3: Corrosion rate in mm/yr for the 3 tested regions Sample in CO2 Saturated 3%
32
4.2.4 Saturated CO2 3% NaCl Solution with 250ppm caustic and 250ppm KS-1,
50oC
Nyquist plots of the sample in the condition of saturated CO2, 3% NaCl solution with the presence of 250ppm caustic and 250ppm of KS-1 at 50oC for various immersion time are presented in Figure ? (a) Parent Metal, (b) HAZ, and (c) Weld.
In these three figures, the patterns are significantly different from each other. Notice on Parent Metal, the first hour has a long diameter of semicircle, indicating the tendency to corrode is low but it quickly revert to higher tendency in the sixth hour and so on. Comparing between HAZ and Weld, both possess higher tendency in comparison to Parent Metal.
33
(a) Parent Metal
(b) HAZ
(c) Weld
Figure 4.11: Nyquist Plots of Sample in CO2 Saturated 3% NaCl Solution with 250ppm
Caustic and 250ppm KS-1 at 50oC after 1, 6, and 12 hours of immersion for (a) Parent Metal (b) HAZ (c) Weld
0 100 200 300 400 500 600 700 800 0 100 200 300 400 500 600 700 800 Z' ' ( o h m .cm ²) Z' (ohm.cm²) 1 hour 6 hours 12 hours 0 50 100 150 200 250 300 0 50 100 150 200 250 300 Z' ' ( o h m .cm ²) Z' (ohm.cm²) 1 hour 6 hours 12 hours 0 20 40 60 80 100 120 140 160 180 0 20 40 60 80 100 120 140 160 180 Z'' ( o h m .c m ²) Z' (ohm.cm²) 1 hour 6 hours 12 hours
34
(a) Parent Metal
(b) HAZ
(c) Weld
Figure 4.12: Bode Plots of Sample in CO2 Saturated 3% NaCl Solution with 250ppm
Caustic and 250ppm KS-1 at 50oC after 1, 6, and 12 hours of immersion for (a) Parent Metal (b) HAZ (c) Weld
-20 -10 0 10 20 30 40 50 60 70 -200 0 200 400 600 800 1000 1200 1400 0.01 1 100 10000 Ph ase A n gl e ( °) Im p e d an ce ( o h m .c m ²) Frequency (Hz) 1 hour 6 hours 12 hours -20 0 20 40 60 80 0 20 40 60 80 100 120 140 160 180 200 220 240 0.01 1 100 10000 Ph ase A n gl e ( °) Im p e d an ce (o h m .cm ²) Frequency (Hz) 1 hour 6 hours 12 hours -20 0 20 40 60 0 50 100 150 200 0.01 1 100 10000 Ph ase A n gl e ( °) Im p e d an ce (o h m .cm ²) Frequency (Hz) 1 hour 6 hours 12 hours
35
The corrosion rates of the sample are recorded in Table 4.4. The corrosion rate for HAZ increased to 0.2 while in the previous sets (without KS-1), the corrosion rate was 0.1. The Weld region also sees an increase to 0.3 of corrosion rate. It seems KS-1 reacts with caustic and gave a different mixed solution which will cause the corrosion rate to increase.
The drop signifies that the solution was probably neutralized in the sixth hour and then, the solution reverted back to acidic. The pH value at the end of the experiment was 5.23.
Region Immersion Time
(hours) Rct (ohm.cm 2 ) Corrosion Rate (mm/yr) Parent Metal 1 6 12 1085.3 223.79 160.76 0.01 0.1 0.1 HAZ 1 6 12 84.557 143.59 106.49 0.2 0.1 0.2 Weld Metal 1 6 12 61.387 96.853 59.294 0.3 0.2 0.3
Table 4.4: Corrosion rate in mm/yr for the 3 tested regions Sample in CO2 Saturated 3%
NaCl Solution with 250ppm caustic and 250ppm KS-1 at 50oC after 1, 6, and 12 hours of immersion
36
4.2.5 Saturated CO2 3% NaCl Solution with 500ppm caustic and 500ppm KS-1,
50oC
Nyquist plots of the sample in the condition of saturated CO2, 3% NaCl solution with the presence of 500ppm caustic and 250ppm KS-1 at 50oC for various immersion time are presented in Figure ? (a) Parent Metal, (b) HAZ, and (c) Weld.
Notice that in comparison to the previous four conditions, the semicircle patterns here took up a smaller range of Z’ and it applies to all three regions; especially for Weld region.
37
(a) Parent Metal
(b) HAZ
(c) Weld
Figure 4.13: Nyquist Plots of Sample in CO2 Saturated 3% NaCl Solution with 500ppm
Caustic and 250ppm KS-1 at 50oC after 1, 6, and 12 hours of immersion for (a) Parent Metal (b) HAZ (c) Weld
0 20 40 60 80 100 120 0 20 40 60 80 100 120 Z" (o h m .cm ²) Z' (ohm.cm²) 1 hour 6 hours 12 hours 0 20 40 60 80 100 0 20 40 60 80 100 Z" (o h m .cm ²) Z (ohm.cm²) 1 hour 6 hours 12 hours 0 20 40 60 80 0 20 40 60 80 Z" (o h m .cm ²) Z (ohm.cm²) 1 hour 6 hours 12 hours
38
(a) Parent Metal
(b) HAZ
(c) Weld
Figure 4.14: Nyquist Plots of Sample in CO2 Saturated 3% NaCl Solution with 500ppm
Caustic and 250ppm KS-1 at 50oC after 1, 6, and 12 hours of immersion for (a) Parent Metal (b) HAZ (c) Weld
-10 0 10 20 30 40 50 60 0 20 40 60 80 100 120 140 0.01 1 100 10000 Ph ase A n gl e ( °) Im p e d an ce (o h m .cm ²) Frequency (Hz) 1 hour 6 hours 12 hours -10 0 10 20 30 40 50 60 0 20 40 60 80 100 120 0.01 1 100 10000 Ph ase A n gl e ( °) Im p e d an ce ( o h m .c m ²) Frequency (Hz) 1 hour 6 hours 12 hours -10 0 10 20 30 40 50 60 0 20 40 60 80 100 120 0.01 1 100 10000 Ph as e An gl e ( °) Im p e d an ce (o h m .cm ²) Frequency (Hz) 1 hour 6 hours 12 hours
39
The corrosion rates of the sample are recorded in Table 4.5. In this set, the caustic was increased to 500ppm concentration. Here, the results observed to have a significant increase in the corrosion rate. The Weld region has the highest corrosion rate. The corrosion rates also stayed constant throughout the 12 hours of immersion time.
This means this mixture is particular corrosive in comparison to the previous few. Moreover, among the three regions, Weld region possessed the tendency to corrode the most. Hence, it can be deduced that the Weld region is more prone to corrosion attack. Other than the Weld region, the HAZ region should be given attention as well.
Region Immersion Time
(hours) Rct (ohm.cm 2 ) Corrosion Rate (mm/yr) Parent Metal 1 6 12 69.427 71.015 73.82 0.2 0.2 0.2 HAZ 1 6 12 44.858 44.316 45.976 0.3 0.3 0.3 Weld Metal 1 6 12 33.875 31.796 32.726 0.6 0.6 0.6
Table 4.5: Corrosion rate in mm/yr for the 3 tested regions Sample in CO2 Saturated 3%
NaCl Solution with 500ppm caustic and 250ppm KS-1 at 50oC after 1, 6, and 12 hours of immersion
40
CHAPTER 5 CONCLUSION
The hypothesis that emerged based on the background studies mentioned that the Weldment region, consists of Weld and HAZ, is more prone to corrosion attack when under a corrosive environment. In the PFK CO2 capture process, environment is acidic due to saturated CO2, the pipeline has Weldment regions which were attack by corrosion. The type of corrosion was suspected to be PWC as the Weld and HAZ regions possessed a higher tendency to corrode in comparison with Parent Metal.
The Weldment region underwent high temperature during welding process. The metal went through local expansion during the welding process and during the cooling process, some areas would cool and contract faster causing residual stresses trapped in Weldment region. Throughout the five experiment sets, the resulted corrosion rate have shown that the Weld region has the highest corrosion set in every condition. The HAZ is the next to Weld and this means the HAZ region was affected by the welding process as well. The difference of microstructure among Weld, HAZ, and Parent Metal caused by the welding process is a possible cause to the occurrence of PWC as different microstructure reacts differently towards the same condition.
The corrosion rates are significantly higher when the solution contains 500ppm of caustic and 250ppm KS-1, under saturated CO2. When KS-1 is not present with caustic, the corrosion rate seems to be relatively low and constant. It can be deduced that when caustic, KS-1 and CO2 are mixed, the mixture becomes corrosive.
In a nutshell, the Weldment region does corrode faster compared to the Parent Metal region that did not undergo the high temperature from welding process. There is a higher chance that the pipeline in PFK was attacked by PWC. Moreover, the mixture between CO2, caustic and KS-1 is corrosive.
41
CHAPTER 6 RECOMMENDATIONS
The Weld, HAZ and Parent Metal regions have different microstructure due to the welding process. Microstructure is also one of the factors that contribute to corrosion attack and thus, a further understanding on the microstructure of each region is recommended to be conducted in the future. The behavior of the Weld region can be studied further for PWC situation.
The pipelines are known to not have underwent heat treatment such stress relieve process to relieve the residual stresses trapped in the Weldment region in PFK. It is recommended that the Weldment regions undergo stress relieve treatment. This could mitigate the corrosion attack.
While it is known that CO2, caustic and KS-1 form a corrosive mixture but the real ratio or concentration of each chemical is relatively still unknown. The future experiments are recommended to test on the composition of the corrosive mixture.
42
CHAPTER 7 REFERENCES
Alawadhi K., 2009. Inhibition of Weld Corrosion in Flowing Brines Containing Carbon Dioxide, Cranfield University.
Alawadhi K. and Robinson M. J., 2011. Preferential Weld Corrosion of X65 Pipeline Steel in Flowing Brines Containing Carbon Dioxide. Corrosion Engineering, Science and Technology, Volume 46, Number 4.
Bullin J. A., Polasek J. C., and Donnelly S. T., 2006. The Use of MDEA and Mixtures of Amines for Bulk CO2 Removal. Bryan Research and Engineering, Inc.
Choi Y.S., Duan D., Nesic S., Vitse F., and Bedell S. A., Worley C., 2010. Effect of Oxygen and Heat Stable salts on the Corrosion of Carbon Steel in MDEA-Based CO2 Capture Process. NACE International.
Davis J. R., 2006. Corrosion of Welds, Chapter 2: Corrosion of Carbon Steel and Low-Alloy Steel Welds, pg. 13. ASM International.
DOE FUNDAMENTALS HANDBOOK CHEMISTRY Volume 1 of 2 – DOE-HDBK-1015/1-93, January 1993. Caustic Stress Corrosion Cracking.
DOE FUNDAMENTALS HANDBOOK CHEMISTRY Volume 1 of 2 – DOE-HDBK-1015/1-93, January 1993. Chloride Stress Corrosion Cracking - CSCC.
Funderbuck R. S., 1998. Postweld Heat Treatment, Welding Innovation Vol. XV, No.2. George K. S., and Nesic S., 2007. Investigation of Carbon Dioxide Corrosion of Mild
Steel in the Presence of Acetic Acid – Part 1: Basic Mechanisms. NACE International. Groysman K., 2010. Corrosion for Everybody, Chapter 1: Corrosion Mechanism and
43
Kermani M. B., and Morshed A., 2003. Carbon Dioxide Corrosion in Oil and Gas Production – A Compendium. NACE International.
Lee C. M., Bond S., Woollin P., 2005. Preferential Weld Corrosion: Effects of Weld Microstructure and Composition. NACE International.
Nesic S., and Rihan R. O., 2005. Erosion – corrosion of Mild Steel in Hot Caustic. Part 1: NaOH Solution. Elsevier. Science Direct, Corrosion Science 48 (2006) 2633-2659. Sridharan V., June 2009. Measurement of Carbon Dioxide on Carbon Steel Using
Electrochemical Frequency Modulation, University of Saskatchewan.
Yang Y., Choi Y. S., and Nesic S., 2011. Corrosion Behaviour of Carbon Steel under Regenerator Conditions in a MDEA-Based CO2 Capture Process. NACE International.
44
45
Table 1: Gantt Chart for January 2012 Semester
Semester 1 (26/1/12 - 27/4/12) Wk 1 Wk 2 Wk 3 Wk 4 Wk 5 Wk 6 Wk 7 Wk 8 Wk 9 Wk 10 Wk 11 Wk 12 Wk 13 Wk 14 Item 26/1 - 27/1 30/1 - 3/2 8/2 - 10/2 13/2 - 17/2 20/2 - 24/2 27/2 - 2/3 5/3 -7/3 12/3 - 16/3 19/3 - 23/3 26/3 - 30/3 2/4 - 6/4 9/4 - 13/4 16/4 - 20/4 23/4 - 27/4 Topic Proposal Background Study & Literature Review Research Methodology Extended Proposal Defence Tools & Materials Requisition Material Preparation Proposal Defense Conduct of Experiment Interim Report Draft Report Final Report
46
47
48
Figure C: Pin-hole leak at E-22-03 inlet piping