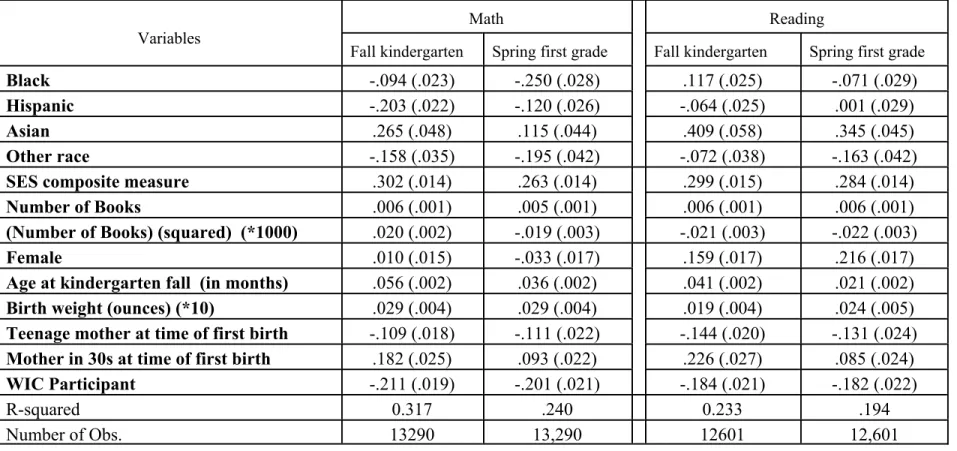
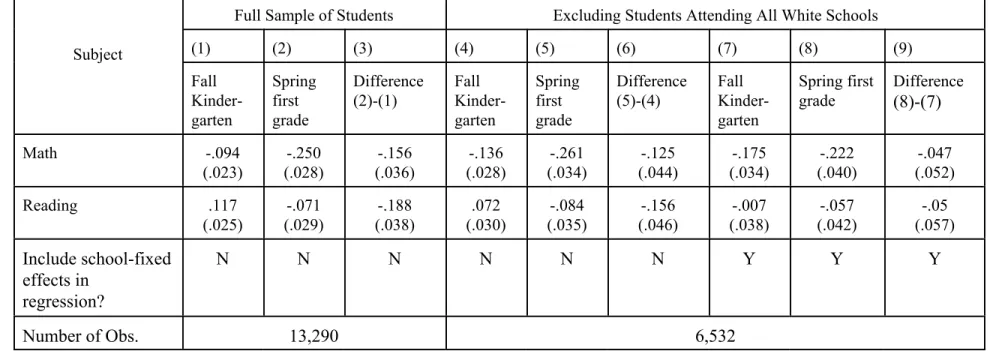
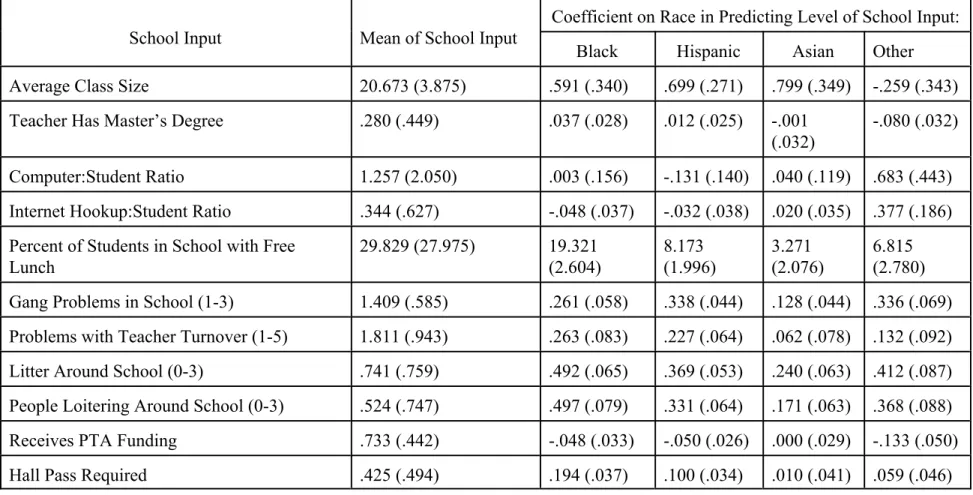
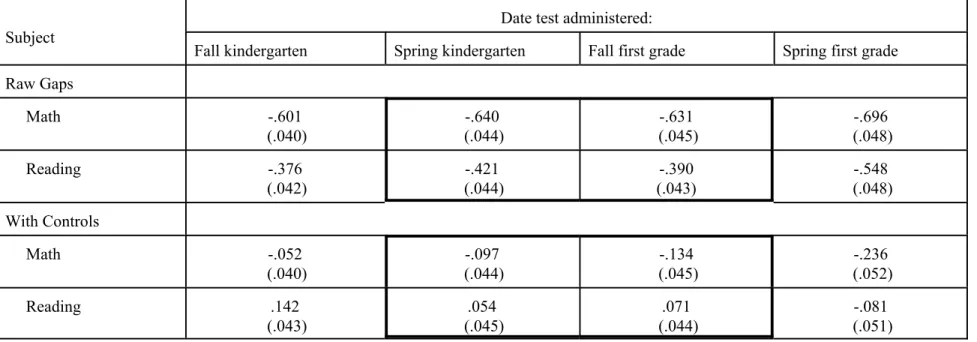
Understanding the Black-White Test Score Gap in the First Two Years of School
Full text
Figure
Related documents
Field experiments were conducted at Ebonyi State University Research Farm during 2009 and 2010 farming seasons to evaluate the effect of intercropping maize with
• Wells fargo bank collected the payments • County TANF staff made the referrals.. • A task force decided which applicant would receive the
The cultural adaptation of BCWS was conducted according to the stages described by (10).. stages included: 1) translation of the scale from English into Turkish by
19% serve a county. Fourteen per cent of the centers provide service for adjoining states in addition to the states in which they are located; usually these adjoining states have
• The development of a model named the image based feature space (IBFS) model for linking image regions or segments with text labels, as well as for automatic image
On top of the described test of universality and the extraction of TMD distributions, in this work we perform many additional studies of the TMD approach, some of which should be
