This document and trademark(s) contained herein are protected by law as indicated in a notice appearing later in this work. This electronic representation of RAND intellectual property is provided for non-commercial use only. Unauthorized posting of RAND PDFs to a non-RAND Web site is prohibited. RAND PDFs are protected under copyright law. Permission is required from RAND to reproduce, or reuse in another form, any of our research documents for commercial use. For information on reprint and linking permissions, please see RAND Permissions. Limited Electronic Distribution Rights
6
Jump down to document
EDUCATIONENERGY AND ENVIRONMENT HEALTH AND HEALTH CARE INTERNATIONAL AFFAIRS NATIONAL SECURITY POPULATION AND AGING PUBLIC SAFETY SCIENCE AND TECHNOLOGY SUBSTANCE ABUSE TERRORISM AND HOMELAND SECURITY TRANSPORTATION AND INFRASTRUCTURE WORKFORCE AND WORKPLACE
The RAND Corporation is a nonprofit research
organization providing objective analysis and effective
solutions that address the challenges facing the public
and private sectors around the world.
Visit RAND at
www.rand.org
Explore
RAND Health
View
document details
For More Information
Browse Books & Publications
Make a charitable contribution
Support RAND
sions of the methodology employed in research; provide literature reviews, survey
instruments, modeling exercises, guidelines for practitioners and research
profes-sionals, and supporting documentation; or deliver preliminary findings. All RAND
reports undergo rigorous peer review to ensure that they meet high standards for
re-search quality and objectivity.
Surgery Centers
A Comparative Statistical and
Regulatory Description
William B. Vogt, John A. Romley
Sponsored by the California HealthCare Foundation
The RAND Corporation is a nonprofit research organization providing objective analysis and effective solutions that address the challenges facing the public and private sectors around the world. RAND’s publications do not necessarily reflect the opinions of its research clients and sponsors.
R
®
is a registered trademark.© Copyright 2009 RAND Corporation
Permission is given to duplicate this document for personal use only, as long as it is unaltered and complete. Copies may not be duplicated for commercial purposes. Unauthorized posting of R AND documents to a non-R AND Web site is prohibited. R AND documents are protected under copyright law. For information on reprint and linking permissions, please visit the RAND permissions page (http://www.rand.org/publications/ permissions.html).
Published 2009 by the RAND Corporation
1776 Main Street, P.O. Box 2138, Santa Monica, CA 90407-2138 1200 South Hayes Street, Arlington, VA 22202-5050 4570 Fifth Avenue, Suite 600, Pittsburgh, PA 15213-2665
RAND URL: http://www.rand.org
To order RAND documents or to obtain additional information, contact Distribution Services: Telephone: (310) 451-7002;
PREFACE
Ambulatory surgery centers (ASCs) are rapidly growing as a setting
for the delivery of health care services, both in California and in the
United States. At present, little is known about either the measurement
of quality in the ASC setting or about the regulation of ASCs by the
various U.S. state governments. The purpose of this report is to
describe the California ASC landscape, to compare California ambulatory
surgery centers to hospital outpatient surgery departments, and to
compare California’s regulation of ambulatory surgery centers to the
regulations of other states.
This work was sponsored by the California HealthCare Foundation
under a grant entitled “Ambulatory Surgery Centers: Relevant Policy Trends,” for which Robbin Gaines serves as the project officer. The
research was conducted in RAND Health, a division of the RAND
Corporation. A profile of RAND Health, abstracts of its publications,
CONTENTS
Preface...iii
Tables...vii
Summary...ix
Acknowledgments...xiii
Chapter 1. Background and Introduction...1
Chapter 2. California’s Ambulatory Surgery Centers...5
Data Sources and Methods...5
Findings...9
Describing Ambulatory Surgery Centers ...9
Comparing ASCs and Hospital Outpatient Surgery Departments ...10
Comparing Cosmetic and Other ASCs ...16
Comparing ASCs by Ownership Type ...18
Accreditation ...19
Chapter 3. A Comparison of ASC Regulation...22
Background...22
Approach and Methods...25
Findings...26
ASC Licensing Requirements ...26
ASC Inspection Frequency ...28
Prior Notice for Inspections ...28
Accreditation and Licensing/Approval ...29
Quality Assessment and Improvement Programs ...30
Encounter-Level Data Reporting ...30
Quality Indicator Reporting ...31
Procedure or Specialty-Specific Regulation ...31
Chapter 4. Summary and Conclusions...33
Appendix A. ASC Ownership Comparison...37
Appendix B. Tabular State Regulation Data...46
Appendix C. Top 100 Procedures for Either ASCs or Hospitals...61
Appendix D. National Quality Forum ASC Performance Measures...65
TABLES
Table 1: Top Surgical Procedures in ASCs and Hospitals...11
Table 2: Demographic Differences Between Hospital and ASC Patients...13
Table 3: Economic Differences Between Hospital and ASC Patients...14
Table 4: Medical Differences Between Hospital and ASC Patients...16
Table 5: Patients in Cosmetic-Specializing ASCs...17
Table 6: ASC Certification and Patient Characteristics, 2006...20
Table 7: Medical Differences and ASC Certification, 2006...21
Table 8: ASC Regulatory Comparison Summary...27
Table A1: Demographic Differences Among ASC Ownership Types, 2006....38
Table A2: Economic Differences Among ASC Ownership Types, 2006...39
Table A3: Medical Differences Among ASC Ownership Types, 2006...40
Table A4: Demographic Differences Among For-Profit ASCs, 2006...41
Table A5: Economic Differences Among For-Profit ASCs, 2006...42
Table A6: Medical Differences Among For-Profit ASCs, 2006...43
Table A7: Payer Reclassification...44
Table A8: ASC Ownership Reclassification...45
Table B1: ASC Licensing Requirements...47
Table B2: ASC Inspection Frequency...49
Table B3: Inspection Notice...52
Table B4: Contribution of Accreditation to Licensing...54
Table B5: Quality Assessment/Improvement Program Requirements...57
Table B6: Encounter-Level Data Reporting...58
Table B7: Quality Indicator Reporting...59
Table C1: Top-100 Procedures for ASCs or Hospitals...62
SUMMARY
Over the last 20 years, there has been enormous growth in the
number of ambulatory surgery centers (ASCs), nationally and in
California. With this growth has come an increased interest in ASCs in
the scholarly, legislative, and policy communities. Most ASCs are
for-profit; many ASCs are physician-owned; and ASCs compete directly with
hospitals in the provision of profitable outpatient surgery services.
Furthermore, little is known about ASC quality measurement, and there
has been little work systematically measuring either the ways in which
ASCs are currently regulated or the ways such regulations affect costs,
quality, and other outcomes of interest.
Regulatory issues are particularly salient for California at
present. California has a unique two-track process for regulating ASCs.
Physician-owned ASCs are regulated by the Medical Board as “outpatient
settings,” whereas other ASCs are regulated by the Department of Public
Health (DPH) as “surgical clinics.” Recently, the California
legislature has been considering changes to this regulatory framework.
This report describes the current state of ASCs in California,
compares the patients in ASCs and hospital outpatient departments,
compares the various categories of ASCs, and compares the regulatory
environment in California to that in other states and to the regulatory
regime for Medicare-participating ASCs.
The report draws on several data sources. Financial, ownership,
location, volume of services, and capital expenditures for all
DPH-regulated ASCs are reported to California’s Office of Statewide Health
Planning and Development (OSHPD), which organizes this information into
the Primary Care and Specialty Clinics Annual Utilization Dataset.
Patient encounter data for all DPH-regulated ASCs and all hospital
outpatient surgery departments are also reported to OSHPD and collected
in the Emergency Department and Ambulatory Surgery Dataset. Both
datasets were acquired from OSHPD for 2005 and 2006.
For the regulatory comparison, RAND retained Stateside Associates,
requirements for 15 large U.S. states and for the Medicare program.
Stateside abstracted statutes and regulation and interviewed responsible
officials. Data on state regulation of ASCs related to licensure,
inspection, independent accreditation, quality improvement programs, and
data and quality reporting were collected.
The 473 California ASCs that report encounter data account for
about 1.1 million outpatient surgery encounters, while the 360
California hospitals reporting ambulatory surgery data account for about
1.7 million encounters. Compared to hospital outpatient surgery
departments, ASCs perform a lower overall volume of surgeries and are
more focused on a few types of procedures. ASCs generally achieve
higher volume on those procedures in which they specialize. In general, ASCs tend to serve a higher-income and more-generously-insured
population.
On one recognized quality indicator, transfer to a hospital, ASCs
appear to score slightly worse than do hospital outpatient departments,
although performance on this measure improved markedly between 2005 and
2006. However, given the immaturity of the ASC quality measurement
literature and the lack of controls for patient risk factors in the work
reported here, this finding should be treated with great caution. This
finding does point to the need for more research to determine whether
the higher transfer rate in ASCs represents a difference in quality.
ASCs perform proportionately more cosmetic procedures than do
hospitals, and 44 OSHPD-reporting California ASCs specialize in cosmetic
procedures. These cosmetic-specializing ASCs serve a younger,
more-female, and slightly higher-income patient base than do
non-cosmetic-specializing ASCs. Furthermore, patients at cosmetic-non-cosmetic-specializing ASCs
are much more likely to be paying for their procedures out of pocket.
On the regulatory front, all 15 states surveyed require inspection
for licensure, but the frequency of that inspection varies. Under the
“outpatient settings” track of California’s two-track regulation,
preannouncement of inspections is required; under the “surgical clinics”
track in California and in all other states, there is no such
requirement. Licensing/approval is unrelated to accreditation by an
Organizations (JCAHO) under the “surgical clinics” track in California
and in five other states. Accreditation satisfies all requirements
under the “outpatient settings” track in California and in North
Carolina. In the remaining states, accreditation either facilitates
licensure, or it is required.
Quality regulation was also compared. Most surveyed states and
Medicare require ASCs to implement quality assessment and improvement
programs; California does not. Most surveyed states require ASCs to
report various quality indicators (deaths, transfers to hospitals,
wrong-site surgeries, etc) to regulators, while California does not.
Most states do not require the reporting of encounter data to regulatory
authorities. For those licensed by the DPH, California does.
There are a number of avenues for further research regarding public
policy for ambulatory surgery centers. First, the research revealed
differences in patterns of volume and procedure specialization between
ASCs and hospital outpatient surgery departments. These differences
could have implications for quality if high volume is associated with
quality or if more specialization is associated with higher quality.
There is little research on these questions for outpatient surgery at
present. Given the heterogeneity in states’ strategies for regulating
ASCs and given that ASC quality measures are currently under
development, research into the effects of different regulatory
strategies on ASC quality would be promising. Finally, given the
differences we document in the income and insurance status of hospital
and ASC patients, it would be interesting to analyze how the
geographical distribution of ASCs and hospital outpatient departments
vary and how this affects their respective patient populations. In
addition, it would be valuable to analyze competition among ASCs and
hospital outpatient departments and how this competition affects the
ACKNOWLEDGMENTS
We thank Jayanta Bhattacharya, Robbin Gaines, Michael Greenberg,
and Susan Ridgely for valuable comments. We thank the California
HealthCare Foundation for funding the project which produced this
CHAPTER 1. BACKGROUND AND INTRODUCTION
Ambulatory surgery centers (ASCs) are outpatient facilities which
perform surgeries which do not require a hospital stay. The most common
types of surgery performed in ASCs are eye (often cataract surgery),
gastrointestinal (often colonoscopy or endoscopy), pain management
(spinal injections), and orthopedic (often arthroscopy).
Over the last 20 years, there has been enormous growth in the
number of ambulatory surgery centers, reflecting the movement of
surgical procedures from an inpatient to outpatient setting. In 1985,
there were 336 Medicare-registered ASCs. By 1990 there were 1,197, and
by 2006, 4,707 (CMS, 2007). California followed a similar trend: The
number of licensed ASCs nearly doubled1 from 253 in 1996 to 482 in 2006.
There has also been a parallel growth in the number of specialty
hospitals--small, for-profit hospitals that perform ambulatory surgery
and also inpatient surgery. While most general hospitals are
not-for-profit, about 95% of ASCs and specialty hospitals are for-not-for-profit, and
many are physician-owned. (GAO, 2003; Gabel et al., 2008).
General hospitals now see growth in ASCs as quite threatening.
According to surveys, 45% of hospital executives perceive ASCs as an
important competitive threat, and 70% believe that they will be soon.
In addition, 21% of hospital executives view competition with physicians
as one of the top three concerns facing their hospital, up from 11% in
the past. Anecdotal evidence suggests that some hospitals responded to
these new threats through a “medical arms race,” pursuing strategies of new investment and higher marketing expenses in an effort to retain
threatened business. (Bian and Morrisey, 2007; Casalino, 2008; Casalino
et al., 2003; Devers et al., 2003; GAO, 2006; Lynk and Longley, 2002)
Because ASCs are generally for-profit and physician-owned, there is
an often expressed concern about inappropriate self-referral by
physician-owners. The Stark Law2 generally forbids physician
self-referral, but has several exceptions, including one for physician-owned
ASCs. (Cassalino, 2008) In a recent report, Cassalino (2008) found
strong evidence that self-referral increases medical care use and
indirect evidence that some of this increase is inappropriate. That
report also found that ASCs were less expensive per case and provided
quality of care comparable to hospital outpatient departments.
The evaluation, monitoring, and reporting of quality information
about ASCs is currently in its infancy. CMS, following a mandate from
Congress, is currently considering requiring that ASCs report quality
information, but there are no concrete proposed measures as yet and the
earliest that such measures would be reported is 2010. (Medicare
Program, 2008) In December 2007, the National Quality Forum (NQF),3 an
organization that endorses standards for measuring and publicly
reporting performance, released nine quality measures for ASCs.
(National Quality Forum, 2007) These comprise four quality measures
developed by the Ambulatory Surgical Centers Quality Collaboration (ASC
QC) and five developed jointly by the National Committee for Quality
Assurance (NCQA) and the American Medical Association’s Physician
Consortium for Performance Improvement (AMA PCPI). Appendix D contains
a summary of the NQF-endorsed measures.
The phenomenal growth of ASCs raises important policy questions.
ASCs may provide benefits to patients via convenience, to payers via
lower prices, and to physicians via enhanced income and job
satisfaction. On the other hand, some concerns have been raised about this growth. The ability of hospitals to cross-subsidize unprofitable
services might be adversely affected if ASCs were to specialize in
unusually profitable patients or procedures. In the case of
physician-owned ASCs, self-referral might lead to inappropriate care. The entry
of ASCs may also duplicate extant hospital outpatient capacity.
2 See §1877 of the Social Security Act and implementing regulations
at 42 C.F.R. §411.350 through §411.389.
If policymakers wish either to encourage or to discourage ASC
growth, there are levers available to them. The most straightforward
lever is reimbursement. ASCs and hospital outpatient departments are
reimbursed by Medicare at different rates. Medicare is in the midst of
an ASC payment reform affecting reimbursement for fee-for-service (FFS)
Medicare patients. Raising ASC rates would likely encourage further
growth, while lowering them would likely discourage it. Public
policymakers additionally have the ability to set and to increase or
decrease the stringency of regulation4 of certificate of need,
self-referral, quality, and quality reporting for both ASCs and for hospital
outpatient surgery departments.
ASCs are becoming an increasingly important part of the healthcare
infrastructure, and policy concerns about them abound. Yet despite the
proliferation of ASCs, basic data describing who is using them, how the
ASCs compare to hospitals, and what their quality outcomes are, remain
thin. Efforts to develop quality measurement technology and
infrastructure over the past two decades have largely focused on other
parts of the healthcare system (e.g., hospitals). The purpose of this
report is to provide basic descriptive information with regard to
California ASCs and to offer some preliminary observations for how
California data may contribute to the emerging policy debate and landscape in that state.
The general issues of ASCs described above are particularly salient
in California because, first, California takes a distinctive approach to
the regulation of ASCs, and, second, the California legislature has
recently been considering changes to this system. California has a
“dual track” system of regulating ASCs, with some ASCs regulated by the
Department of Public Health and some ASCs regulated by the Medical
Board. Against this backdrop, three bills5 (described in Chapter 3)
4 Several of these are discussed in Chapter 3.
5For comprehensive legislative analyses of these proposed measure,
see http://info.sen.ca.gov/pub/07-08/bill/asm/ab_1551-1600/ab_1574_cfa_20080814_213459_asm_floor.html, http://info.sen.ca.gov/pub/07-08/bill/asm/ab_2951-3000/ab_2968_cfa_20080813_195016_asm_floor.html, and
recently under consideration by the California legislature pertain to
ASCs and would change this regulatory framework.
In this context, RAND proposed, and the California Healthcare
Foundation funded, a study intended to inform public decisionmaking
relating to ASCs in California. In consultation with the California
Healthcare Foundation, the following four objectives were developed for
the study, and these objectives are pursued in the remainder of this
technical report:
1. Describe the current state of ASCs in California.
2. Compare ASCs to hospital outpatient departments.
3. Compare the various ownership categories of ASCs.
4. Compare the regulatory regime in California to those of other
states and to that of the Center for Medicare and Medicaid Services (CMS).
http://info.sen.ca.gov/pub/07-08/bill/sen/sb_1451-1500/sb_1454_cfa_20080708_153239_asm_comm.html (accessed on August 23, 2008).
CHAPTER 2. CALIFORNIA’S AMBULATORY SURGERY CENTERS
This section provides an overview of the market for outpatient
surgery in California. It features a statistical overview of the
differences among the patients treated in ASCs and hospital outpatient
surgery departments and among the patients treated in various categories
of ASCs. ASC patient populations are compared among ASCs with different
ownership arrangements, among ASCs according to certification status,
and among ASCs specializing in cosmetic surgery and in other surgeries.
As previously discussed, quality measurement and reporting for ASCs
is in its infancy. In this report, we present three potential quality
indicators: mortality, transfer to a hospital, and procedure volume.
ASCs in several large states are required to report mortality as a quality monitoring device (see Chapter 3). Transfer to a hospital is
one of the ASC quality measures proposed by the NQF and the ASCQC.
Finally, for many inpatient hospital procedures, there is evidence that
higher procedure volume correlated positively with better outcomes,6
although the evidence for this link in the case of outpatient surgery is
weaker. (Casalino, 2003)
DATA SOURCES AND METHODS
The statistical description of California ASCs draws upon two
primary data sources, each collected by OSHPD: the Annual Utilization
Report Data and the Emergency Department and Ambulatory Surgery Data. All surgical clinics licensed by the Department of Public Health are
required to file with OSHPD an “Annual Utilization Report.” Data based
on these reports are available on OSHPD’s web site,7 and these data have
6 This correlation, often called “the volume-outcome effect,” is
generally thought to be the result of the hospital improving at
performing particular procedures, either via accumulation of experience by physicians and hospital personnel or via improvements in hospital routines through organizational learning.
7 See
http://www.oshpd.ca.gov/hid/Products/Hospitals/Utilization/PC_SC_Utiliza tion.html
been obtained from 1996 through 2006. Furthermore, since 2005, these
clinics also have been required to report encounter data (data on each
treatment encounter with a patient). In addition, essentially all
California hospitals performing outpatient surgery are required to
report these encounter data. These encounter data are collected in the
Emergency Department and Ambulatory Surgery Dataset. Both datasets
were acquired from OSHPD for 2005 and 2006.
The Annual Utilization Report contains information on each clinic
in five sections.
− The first section contains clinic name, address, and other
basic information.
− In the second section, there is information on the clinic’s
ownership (e.g., government, non-profit, and for-profit).
− Information on the number of patient encounters, the number
of surgeries, and the number of operating rooms is in the third section of the report.
− The fourth section contains financial information (revenues,
expenses, and income).
− Finally, the fifth section reports major capital expenditures
by the facility.
The utilization data characterize the growth in ASCs from 1996
through 2006 and identify the different categories of ownership for
comparative purposes. Unfortunately, the utilization report does not
specifically identify physician ownership; furthermore, there does not
appear to be any readily available source for this information. Another
limitation of the utilization data is that some facilities do not comply
with the reporting requirement and, therefore, are omitted from the
analysis. In 2005, there were 37 nonreporters among the 476 licensed
ASCs, and in 2006 nonreporters numbered 67 of the 482 total ASCs. Six
facilities reported invalid data. Another potential limitation is
California’s unusual dual licensing system for ASCs (see the discussion
Medical Board would not be covered by OSHPD reporting requirements.8
The Medical Board does not make available a similar set of data for the
ASCs which it regulates.
Since 2005, all hospitals and ASCs licensed by the Department of
Public Health have been required to report data for each ambulatory
surgery patient encounter. This information consists of a facility
identifier, demographic information on the patient (age, sex, race,
ethnicity, zip code of residence), information on the patient’s
diagnoses (ICD9-CM codes9 for the principal diagnosis and up to 24 other
diagnoses), information on the patient’s treatments (CPT codes10 for the
primary and up to 20 other procedures), the patient’s disposition at the
end of the encounter (discharged to home, transferred to a hospital,
etc.), the expected source of payment (Medicare, Medicaid, private
insurance, etc.), and various other information. As in the case of the
utilization data, patient encounter data are not reported (or not
reported completely) by some facilities, either because they have
obtained “data exceptions” from OSHPD or because they are noncompliant
with the data reporting requirement. Of the 476 licensed ASCs in 2005,
data are available from 466; of the 482 licensed ASCs in 2006, data are
available for 473.
A limitation of these data arises from the need to protect the
privacy of patients. To protect the identity of individual patients, OSHPD masks some data elements for some encounters. Masking affects
age, sex, race, ethnicity, and zip code to varying degrees. For
8 It is a matter of controversy whether physician-owned ASCs have
the choice of which type of accreditation to seek. The Department of Public Health’s position is that physician-owned ASCs must be accredited by the Medical Board rather than by DPH, and the California Medical Association’s position is that it is a matter of choice by a physician-owned ASC.
9 ICD9-CM codes are five-digit codes that identify the disease or
condition for which the patient was treated. ICD9-CM stands for
International Classification of Diseases, 9th Revision, Clinical
Modification. (see Medicode, 2008.)
10 CPT codes are five-digit codes that identify which procedures
are performed on a patient. CPT stands for Current Procedural Terminology. (see AMA, 2008.)
example, although the five-digit zip code is available for the vast
majority of patients, about 3% of encounters have this variable
masked--patients who reside in zip codes that supply only a few encounters have
their zip codes masked to prevent identification. Therefore, sample
sizes will vary from analysis to analysis, based on masked elements.
In addition, some supplemental data sources are used. Data from
the 2000 census link each patient’s zip code of residence to median
family income in that zip code in 1999. Information on accreditation of
California ASCs was obtained from the Web sites of three accreditation
agencies: The American Association for Accreditation of Ambulatory
Surgical Facilities (AAAASF), The Accreditation Association for
Ambulatory Health Care (AAAHC), and JCAHO.
To perform the analysis presented below, we linked these datasets
together. Patient encounter data were linked to facilities in the
utilization data using the facility identifier assigned by OSHPD. Zip
code income data were linked to patient encounter data via the zip code
field in the encounter data. Accreditation information was linked to
the facilities in the utilization data using the name and address
information in those data. All the statistical findings were derived
from this linked database. Demographic, medical, and payer information
ultimately was derived from the encounter data; income was derived from
the zip code data; ownership type information was derived from the
utilization data; and accreditation was derived from the Web-collected
accreditation data.
To determine statistical significance for differences in the
distribution of categorical variables among different facility types,
Pearson chi-squared tests are employed. To determine differences in the
distributions of continuous variables among different facility types,
t-tests (in the case of two facility types) or one-way analysis of
variance (in the case of more than two facility types) are used.
Detailed test results are not presented in the text below because, owing
to very large samples sizes, every such test performed resulted in
statistically significant differences at the p<0.01 level or better.
Therefore, the discussion focuses only on the substantive significance
FINDINGS
Over the last 20 years, there has been enormous growth in the
number of ambulatory surgery centers, reflecting the movement of
surgical procedures from an inpatient to outpatient setting. In 1985,
there were 336 Medicare-registered ASCs. By 1990 there were 1,197 ASCs;
by 2006, 4,707 ASCs. (CMS, 2007) California utilization data show a
similar trend. The number of licensed ASCs nearly doubled--from 253 in
1996 to 482 in 2006. There was similarly rapid growth in the number of
surgeries, from about 419,000 in 1996 to about 998,000 in 2006, and in
net revenue, from $535 million in 1996 to $1.34 billion in 2006. Total
encounters (not all of which were necessarily surgical encounters)
showed a similarly rapid increase, rising from about 539,000 in 1996 to 1.1 million in 2006.
Describing Ambulatory Surgery Centers
Of the 409 ASCs with usable utilization data in 2006 (482 licensees
less 67 nonreporters less 6 with invalid data), 400 (97.8%) were
for-profit, seven (1.7%) were non-profit , and two (or 0.5%) were
government-owned. The for-profit ASCs were further subdivided according
to whether they were owned by corporations (42.5%), partnerships
(36.7%), limited liability companies (11.2%), or individuals (7.3%).
Unfortunately, according to discussions with the Department of Public
Health, these categories do not map in any natural way onto whether or
not the ASC is physician-owned.
Ambulatory surgery centers tend to specialize, to a considerable
extent, in certain types of procedures. Of the 5,331 different
principal procedures in the outpatient surgery encounter data in 2006,
the top 10 ASC principal procedures accounted for 58%, the top 50
principal procedures accounted for 77%, and the top 100 principal
procedures accounted for 84% of total ASC encounters. The analysis
below focuses on the categories of eye surgery, gastrointestinal
procedures, pain management, arthroscopy, and cosmetic surgery. The
first four of these categories are generally recognized as areas in
which ASCs specialize, and the fifth area was added because of its
In order to categorize ASCs according to the procedures in which
they specialize, each procedure that was among the top-100 outpatient
surgery procedures for either ASCs or hospitals (105 procedures in all)
was placed into one of the above five categories or into a catch-all
“Other” category. The categorization was based on the CPT code of the
principal procedure and is described in detail in Appendix C. Using the
encounter data, each ASC was defined as specializing in one of the
categories if at least 50% of its procedures (again, measured by
principal procedure code) fell into one of these categories. Over 60%
of the 473 ASCs with usable encounter data in 2006 specialized in one of
the five categories: 121 (26%) specialized in gastrointestinal
procedures, 68 (14%) specialized in eye surgery, 65 (14%) specialized in pain management, 44 (9%) specialized in cosmetic surgery, and 11 (2%)
specialized in arthroscopy. Of the remaining ASCs, 161 (34%) did not
perform a majority of their procedures in any of the categories, and 3
(1%) could not be classified because none of their procedures were in
the top 100 procedures.
Comparing ASCs and Hospital Outpatient Surgery Departments
Of the 2.9 million outpatient surgery encounters in 2006 in
California, about 1.1 million took place in ASCs and 1.7 million took
place in hospital outpatient surgery departments. The encounter data
contained 473 ASCs and 360 hospitals. Hospital outpatient departments
perform a more diverse mix of procedures. Recall that the top 10, 50,
and 100 ASC principal procedures accounted for 58%, 77%, and 84% of all
ASC encounters. The corresponding figures for hospital outpatient
departments are 30%, 52%, and 63%. Thus, only 30% of hospital
outpatient surgeries come from among the top 10 hospital principal
procedures, while 58% of ASC encounters come from among the top 10 ASC
principal procedures.
Table 1 presents the top 10 principal procedures for ASCs and the
top 10 principal procedures for hospital outpatient departments.
Because there is considerable overlap in these two top-10 lists, the
joint list has 13 procedures. The first column contains the CPT code
procedure. The third and fourth columns give the rank of the procedure,
in terms of total volume in the state, among ASCs and hospital
outpatient surgery departments. For example, Table 1 shows that a
diagnostic colonoscopy procedure (CPT code 45378) was the most common
surgical procedure in both ASCs and hospital outpatient surgery
departments and that Cholecystectomy (CPT code 47562) was the 66th most
common procedure overall in ASCs and the 10th most common procedure
overall in hospital outpatient surgery departments. The fifth and sixth
columns contain the overall number of procedures in each type of
facility in the state. The final two columns show the average volume,11
for ASCs and hospitals, of the procedure among facilities which do at
least ten per year.
The most striking result in this table is that the top six
procedures for hospitals and ASCs are the same. Four of these are
11 This average is interesting because of its potential
implications for quality. Many procedures have been shown to exhibit a “volume-outcome effect” in which facilities or physicians who perform a higher volume of the procedure achieve better outcomes.
Table 1: Top Surgical Procedures in ASCs and Hospitals
Volume
Rank Total (000s) Average
CPT Procedurea ASC Hosp ASC Hosp ASC Hosp
45378 Colonoscopy 1 1 166 115 893 412 66984 Cataract 2 2 116 94 732 412 43239 Endoscopy 3 3 92 83 496 307 45380 Colonoscopy 4 4 77 59 433 233 45385 Colonoscopy 5 5 56 36 327 157 62311 Spinal injection 6 6 53 29 292 174 64483 Spinal injection 7 18 38 13 246 145 29881 Arthroscopy, knee 8 9 23 26 128 94
66821 Laser lens surgery 9 37 21 7 198 88
45384 Colonoscopy 10 19 15 12 161 90
93510 Left Heart Cath N/A 7 N/A 29 0 242
49505 Hernia repair 19 8 7 26 63 86
47562 Cholecystectomy 66 10 2 25 53 104
a
For brevity, the details of the types of colonoscopy, endoscopy, and spinal injections are omitted.
gastrointestinal procedures (colonoscopies and endoscopies), one is eye
surgery, and one is a pain management procedure. Another interesting
result is that, for these top six procedures, ASCs provide a higher
volume per facility. This despite the fact that ASCs are, on average,
smaller than are hospital outpatient surgery departments in terms of
overall procedure volume. Another interesting contrast is the presence
of left heart catheterization on the hospital top-10 list and its
complete absence on the ASCs’ list.12
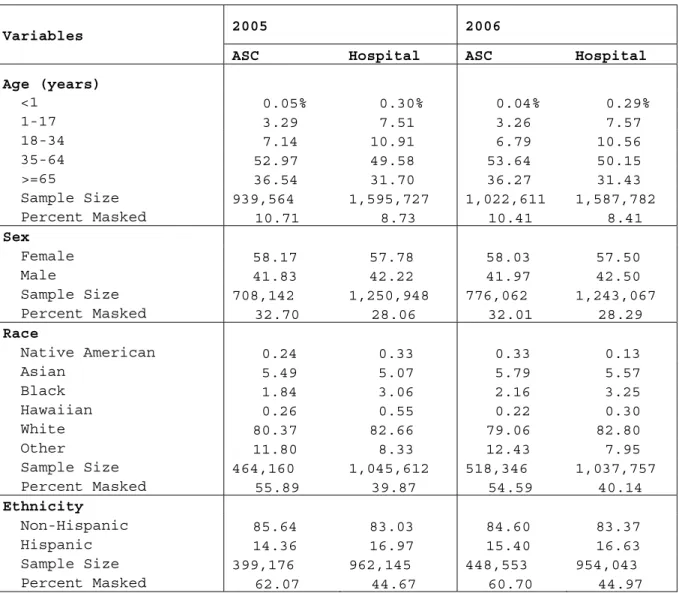
Tables 2 through 4 show differences in patient demographic,
economic, and medical characteristics between ASCs and hospitals. On
demographics, hospitals treat a younger patient population, while race,
sex, and ethnicity distributions look very similar between the two
settings. In 2006, 36% of ASC patients were older than 65 years while
only 31% of hospital patients fell into this age group.
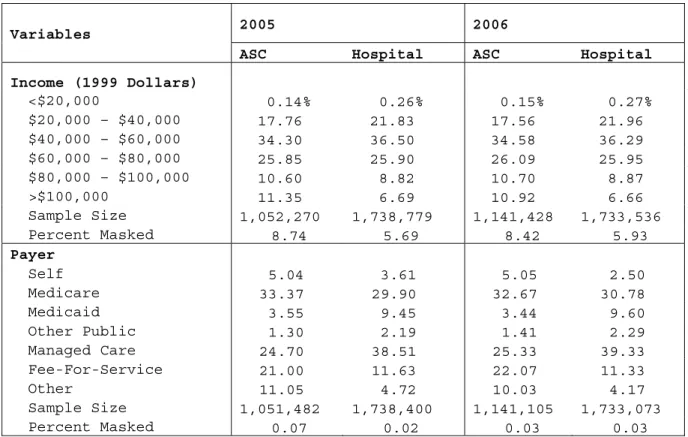
The economic differences between ASC and hospital patients are
significant. ASCs treat significantly more patients from high-income
zip codes. Eleven percent of ASC patients in 2006 came from a zip code
with median family income of over $100,000 and 22% came from zip codes
with median family income of over $80,000. By contrast, only 7% of
hospital patients came from zip codes with median family incomes of over $100,000 and 15% of hospital patients came from zip codes with median
family incomes of over $80,000.
12 Observe that, in Table 1, the rank in terms of overall statewide
volume for a procedure does not always correspond to the rank in volume per ASC. This is because some ASCs do not perform some procedures. For example, procedure 29881, an arthroscopic knee surgery procedure, was fourth overall in the state in terms of ASC procedure volume, and procedure 66821, a laser eye surgery procedure, was fifth. However, among the 106 ASCs that perform the eye surgery procedure, average volume was 198, while among the 177 ASCs that perform the knee surgery, average volume was 128. So, overall statewide volume for the knee surgery was higher than was the overall statewide volume for the eye surgery, even though per-ASC volumes showed the reverse ranking.
There are also differences in expected source of payment13 between
ASCs and hospitals. In 2005 and 2006, about 5% of patients in ASCs paid
for their procedures out of their own pockets, compared to 3.6% and 2.5%
for hospital patients in 2005 and 2006, respectively. This may
represent a higher proportion of cosmetic procedures, which are usually
13 The OSHPD encounter data contain a 20-category classification
scheme for expected source of payment. This is collapsed into seven categories as described in Appendix Table A7: Self, Medicare, Medicaid, Other Public, Managed Care Organization, Fee-For-Service, and Other.
Table 2: Demographic Differences Between Hospital and ASC Patients
2005 2006 Variables
ASC Hospital ASC Hospital Age (years) <1 0.05% 0.30% 0.04% 0.29% 1-17 3.29 7.51 3.26 7.57 18-34 7.14 10.91 6.79 10.56 35-64 52.97 49.58 53.64 50.15 >=65 36.54 31.70 36.27 31.43 Sample Size 939,564 1,595,727 1,022,611 1,587,782 Percent Masked 10.71 8.73 10.41 8.41 Sex Female 58.17 57.78 58.03 57.50 Male 41.83 42.22 41.97 42.50 Sample Size 708,142 1,250,948 776,062 1,243,067 Percent Masked 32.70 28.06 32.01 28.29 Race Native American 0.24 0.33 0.33 0.13 Asian 5.49 5.07 5.79 5.57 Black 1.84 3.06 2.16 3.25 Hawaiian 0.26 0.55 0.22 0.30 White 80.37 82.66 79.06 82.80 Other 11.80 8.33 12.43 7.95 Sample Size 464,160 1,045,612 518,346 1,037,757 Percent Masked 55.89 39.87 54.59 40.14 Ethnicity Non-Hispanic 85.64 83.03 84.60 83.37 Hispanic 14.36 16.97 15.40 16.63 Sample Size 399,176 962,145 448,553 954,043 Percent Masked 62.07 44.67 60.70 44.97
not covered by insurance. Patients with traditional fee-for-service
coverage represented 22% of ASC encounters in 2006 but accounted for
only about 11% of hospital encounters. Hospitals served a higher
proportion of Medicaid patients (over 9% of hospital business versus
less than 4% of ASC business) and a larger proportion of other public
business (payers such as Workers Compensation and the Department of
Veteran’s Affairs). There were differences in representation of managed
care as well; these patients accounted for about 25% of ASC volume and
39% of hospital volume. Medicare represented 33% of ASC business and
31% of hospital business in 2006.
The medical (disposition and types of procedures) differences
between patients served by ASCs and hospitals are depicted in Table 4.
Disposition describes where patients go at the end of their encounter.
The vast majority, more than 95%, of outpatient surgery patients go home
at the end of their surgery encounter, presumably reflecting the fact
Table 3: Economic Differences Between Hospital and ASC Patients
2005 2006 Variables
ASC Hospital ASC Hospital
Income (1999 Dollars) <$20,000 0.14% 0.26% 0.15% 0.27% $20,000 – $40,000 17.76 21.83 17.56 21.96 $40,000 – $60,000 34.30 36.50 34.58 36.29 $60,000 – $80,000 25.85 25.90 26.09 25.95 $80,000 – $100,000 10.60 8.82 10.70 8.87 >$100,000 11.35 6.69 10.92 6.66 Sample Size 1,052,270 1,738,779 1,141,428 1,733,536 Percent Masked 8.74 5.69 8.42 5.93 Payer Self 5.04 3.61 5.05 2.50 Medicare 33.37 29.90 32.67 30.78 Medicaid 3.55 9.45 3.44 9.60 Other Public 1.30 2.19 1.41 2.29 Managed Care 24.70 38.51 25.33 39.33 Fee-For-Service 21.00 11.63 22.07 11.33 Other 11.05 4.72 10.03 4.17 Sample Size 1,051,482 1,738,400 1,141,105 1,733,073 Percent Masked 0.07 0.02 0.03 0.03
that relatively low-risk patients and procedures tend to be treated in
an outpatient surgical setting.
As previously discussed, two potential quality indicators are
mortality and transfer to a hospital.14 Consistent with previous
research on outpatient surgery, mortality is found to be a very rare
event. In 2006, there were only 132 deaths among the 2.9 million
encounters: this outcome is too rare to support any quality
comparisons. Although not common, transfers to hospitals were reported
in the data. In 2006, the percentage of ASC patients transferred to
hospitals was almost twice as high as that for hospital outpatient
surgery departments (0.22% versus 0.12%)), despite the decline in ASC
transfer rates from 2005 to 2006 (from 0.79% to 0.22%). This result
constitutes no more than a preliminary indicator, however. To make
definite conclusions about quality differences among the settings would
require a more-detailed study that took into account differences in
diagnosis, risk factors, and treatments.
Another difference between ASCs and hospitals lies in how many
procedures are done at each encounter. To calculate the number of
procedures per visit, the number of procedures (both principal and
other) reported for each encounter are summed and then the average is
taken across settings. In both 2005 and 2006, ASCs did fewer procedures
per visit than hospital outpatient surgery departments. Ambulatory
surgery centers averaged 1.4 procedures per visit, while hospitals
averaged 2.1 procedures per visit. The differences in number of
procedures per visit may reflect differences in behavior between ASCs
and hospital outpatient departments, differences in patient mix between
ASCs and hospitals, or differences in coding practices between the two
types of organizations.
14 Transfer to a hospital in the encounter data and in common use
means transfer to inpatient care at a hospital. In principle, it should mean the same thing for ASCs and hospital outpatient departments.
Comparing Cosmetic and Other ASCs
Table 5 presents a comparison of the distribution of
characteristics of patients going to ASCs specializing in cosmetic
procedures and the distribution of characteristics of patients going to
ASCs not specializing in cosmetic procedures. There were 44 ASCs
specializing in cosmetic procedures in California. About 19,000
encounters were reported at these facilities in each of 2005 and 2006.
In light of the smaller sample sizes and the lack of any significant
differences between the years, 2005 and 2006 data are pooled for this
comparison. Thus, all of the results in Table 5 represent calculations
on combined 2005 and 2006 data.
Patients in ASCs specializing in cosmetic procedures are very
different from patients in other ASCs. There are many fewer patients
aged 65 and older (15% in cosmetic versus 37% in other ASCs).
Cosmetic-specializing ASCs see a higher proportion of female patients. Patients
Table 4: Medical Differences Between Hospital and ASC Patients
2005 2006 Variables
ASC Hospital ASC Hospital
Disposition
Home 95.74% 97.47% 97.18% 98.57%
Hospital 0.79 0.15 0.22 0.12
Post-Acute Facility 0.20 0.31 0.16 0.31
Home Health, Hospice 0.01 0.07 0.00 0.06
Died 0.00 0.01 0.00 0.01 Other 3.26 1.99 2.44 0.93 Sample Size 1,051,644 1,738,564 1,141,324 1,733,330 Percent Masked 0.00 0.00 0.00 0.00 Procedure Type Gastrointestinal 43.47 38.54 45.30 38.24 Nerve / Pain 17.62 9.58 17.38 9.41 Eye 16.58 13.44 15.90 12.97 Arthroscopy 7.23 7.56 6.92 7.79 Cosmetic 3.45 1.95 3.17 2.10 Other 11.65 28.93 11.33 29.49 Sample Size 876,438 888,779 962,166 885,884 Percent Masked 0.00 0.00 0.00 0.00 Procedures / Encounter 1.37 2.08 1.38 2.17 Sample Size 1,052,270 1,738,779 1,141,428 1,733,536 Percent Masked 0.00 0.00 0.00 0.00
in cosmetic-specializing ASCs hail from zip codes that are modestly
higher in income compared to ASC patients overall. Finally, consistent
with the fact that cosmetic procedures are not generally covered by
health insurance, the patients at cosmetic-specializing ASCs are much
more likely to be self-paying (71% versus 4%) than are patients at ASCs
overall.
Table 5: Patients in Cosmetic-Specializing ASCs 2005-6 combined Variables Cosmetic Not Age (years) <1 0.16% 0.04% 1-17 0.47 3.31 18-34 21.17 6.81 35-64 62.89 53.22 >=65 15.32 36.63 Sample Size 21,003 1,941,172 Percent Masked 44.92 9.95 Sex Female 84.87 57.90 Male 15.13 42.10 Sample Size 10,795 1,473,409 Percent Masked 71.69 31.65 Income (1999 Dollars) <$20,000 0.03 0.12 $20,000 – $40,000 18.37 18.00 $40,000 – $60,000 36.58 34.93 $60,000 – $80,000 23.82 26.93 $80,000 – $100,000 11.08 11.01 >$100,000 10.12 9.00 Sample Size 25,766 1,979,891 Percent Masked 32.43 0.12 Payer Self 71.21 3.87 Medicare 9.81 33.41 Medicaid 0.25 3.55 Other Public 2.35 8.58 Managed Care 5.85 25.37 Fee-For-Service 8.36 21.79 Other 2.18 3.42 Sample Size 38,132 2,154,455 Percent Masked 0.01 0.05 Number of ASCs 44 429
Comparing ASCs by Ownership Type
The comparison among ASC ownership categories is treated briefly
since the vast bulk of ASCs are for-profit and the information available
from California’s Department of Public Health has not been sufficient to
distinguish physician-owned from non-physician-owned ASCs. Tables A1
through A3 in Appendix A correspond to Tables 2 through 4 and present
the demographic, economic, and medical comparisons among
government-owned, non-profit, and for-profit ASCs.15 Furthermore, Tables A4
through A6 present comparisons among ASCs broken out by the more
detailed ownership types reported in the utilization data.
The principal differences among ASCs of different ownership types
were that the government ASCs were more apt to treat a younger,
less-wealthy, more-Medicaid population relative to for-profit ASCs.
Non-profit ASCs were more likely to specialize in arthroscopy and pain
management, and they served a richer and younger population than did the
for-profit ASCs.
Turning to the differences among the various for-profit ownership
forms reported in Tables A4 through A6, the differences among these
groups of ASCs were modest. The differences in patient demographics
were quite small. For-profit ASCs owned by individuals treated a lower-income population and more Medicaid, Medicare, and self-pay patients
than did the other forms. Individually-owned ASCs performed more
cosmetic surgery, less pain management, and less arthroscopy than did
the other forms. Partnerships served fewer patients covered by public
insurance and more managed-care patients. Partnerships were also more
likely to discharge patients to the hospital and performed slightly more
procedures per encounter than did the other forms. Corporate-owned ASCs
treated an older population and performed more gastrointestinal
procedures. Finally, LLC-owned ASCs treated a higher-income and more
15 The OSHPD utilization data contain a nine category ownership
categorization scheme. Appendix Table A8 contains a description of the mapping between this scheme and the three category (government, non-profit, for-profit) scheme used in Tables A1 through A3.
FFS-insured population, and they were more likely to provide
neurological and pain-management services.
Accreditation
To assess the extent to which California ASCs were accredited or
certified by national agencies, a list of California ASCs accredited by
The American Association for Accreditation of Ambulatory Surgical
Facilities (AAAASF), The Accreditation Association for Ambulatory Health
Care (AAAHC), and The Joint Commission for the Accreditation of
Healthcare Organizations (JCAHO) was compiled. These data were
collected online from June through October, 2008.
Many California ASCs have sought accreditation from one of the
three organizations examined. The JCAHO had accredited 95 California
ASCs. The AAAASF had accredited 197 California ASCs. The AAAHC had accredited 292 ASCs. Many of these ASCs, however, are likely regulated
in California as outpatient settings by the Medical Board rather than as
specialty clinics by the Department of Public Health. ASCs not
regulated by the Department of Public Health are absent from both the
utilization and encounter data.
The ASCs from the three accreditation agencies were linked to the
ASCs from OSHPD’s outpatient clinic utilization database using the name
and address of the ASCs. Because there is no common identifier among
the OSHPD, AAAASF, AAAHC, and JCAHO databases, the linking was
imperfect. Of the 482 California ASCs regulated by the Department of
Public Health, 183 matched to records from the certifying agencies.
These ASCs were assigned to JCAHO, AAAHC, and then AAAASF in that order.
Using these matching rules, 126 were certified by AAAHC, 43 were
certified by JCAHO, and 14 ASCs were certified by AAAASF. Six ASCs were
certified by two organizations and none had three certifications.
A comparison of patients in ASCs certified by the various
certification agencies appears in Tables 6 and 7. The columns in these
tables correspond to the type of ASC certification. The column labeled
“No Match” corresponds to those California ASCs that did not match to
any certifying agency in the database. This failure to match could
arising from the lack of a unique identifier in the data, so it would
not be correct to interpret those ASCs in the “No Match” category as
being uncertified.
Table 6 reveals that the age profile of patients certified by the
various agencies was roughly similar, with the AAAHC-certified and unmatched ASCs serving a slightly older population. The income and
payer were not similar however. ASCs certified by AAAASF had a higher
proportion of high-income and self-paying patients than did other ASCs.
Furthermore, ASCs certified by JCAHO had a lower-income, higher-FFS and
a slightly higher managed-care population.
Table 6: ASC Certification and Patient Characteristics, 2006
Variables AAAASF AAAHC JCAHO No Match Age (years) <1 0.04 0.04 0.02 0.04 1-17 1.21 3.63 3.08 3.16 18-34 11.87 7.91 7.97 5.91 35-64 57.38 52.74 58.19 53.18 >=65 29.49 35.69 30.74 37.72 Sample Size 15,166 297,572 107,518 602,355 Percent Masked 22.00 9.43 10.88 10.47 Income (1999 Dollars) <$20,000 0.23 0.10 0.04 0.14 $20,000 – $40,000 10.02 14.04 14.70 20.56 $40,000 – $60,000 24.90 34.03 37.11 35.44 $60,000 – $80,000 26.32 28.94 30.41 25.37 $80,000 – $100,000 22.74 12.65 12.46 9.62 >$100,000 15.80 10.25 5.28 8.88 Sample Size 19,406 328,264 120,592 671,903 Percent Masked 0.20 0.09 0.04 0.13 Payer Self 26.29 4.68 4.96 4.64 Medicare 22.35 31.81 29.29 33.99 Medicaid 1.09 1.97 1.24 4.62 Other Public 8.04 9.03 6.93 7.93 Managed Care 25.09 27.20 28.33 23.88 Fee-For-Service 15.76 22.51 27.17 21.13 Other 1.39 2.80 2.08 3.82 Sample Size 19,444 328,477 120,580 672,604 Percent Masked 0.00 0.03 0.05 0.02 Number of ASCs 13 115 40 305
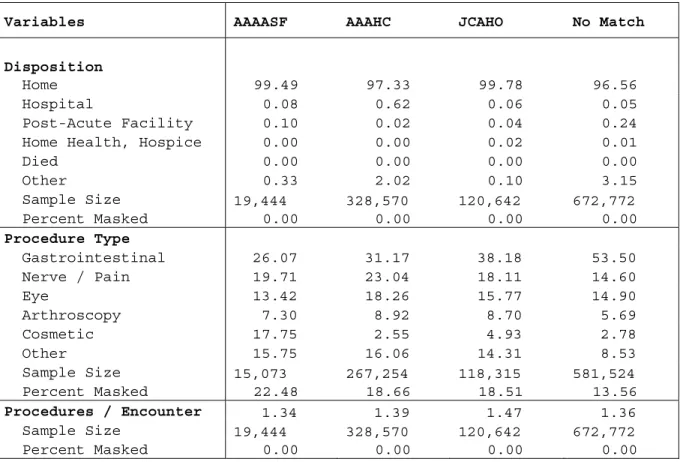
Related to this difference, Table 7 reveals that AAAASF ASCs
treated a greater proportion of cosmetic surgery patients. These
patients tend to have higher incomes and are more likely to be self-pay
than are other ASC patients. That same table also shows that the JCAHO
ASCs and the unmatched ASCs are more likely to specialize in
gastrointestinal procedures. The AAAHC-certified facilities are more
likely to discharge patients to hospitals than are facilities in the
other categories. This could represent differences in case mix or
differences in quality between this category of ASCs and the others.
The AAAHC-certified facilities are somewhat more likely than the other
facilities to perform nerve/pain procedures and arthroscopic procedures;
these procedures are, in turn, the two most likely categories to lead to
a discharge to a hospital.
Table 7: Medical Differences and ASC Certification, 2006
Variables AAAASF AAAHC JCAHO No Match
Disposition
Home 99.49 97.33 99.78 96.56
Hospital 0.08 0.62 0.06 0.05
Post-Acute Facility 0.10 0.02 0.04 0.24
Home Health, Hospice 0.00 0.00 0.02 0.01
Died 0.00 0.00 0.00 0.00 Other 0.33 2.02 0.10 3.15 Sample Size 19,444 328,570 120,642 672,772 Percent Masked 0.00 0.00 0.00 0.00 Procedure Type Gastrointestinal 26.07 31.17 38.18 53.50 Nerve / Pain 19.71 23.04 18.11 14.60 Eye 13.42 18.26 15.77 14.90 Arthroscopy 7.30 8.92 8.70 5.69 Cosmetic 17.75 2.55 4.93 2.78 Other 15.75 16.06 14.31 8.53 Sample Size 15,073 267,254 118,315 581,524 Percent Masked 22.48 18.66 18.51 13.56 Procedures / Encounter 1.34 1.39 1.47 1.36 Sample Size 19,444 328,570 120,642 672,772 Percent Masked 0.00 0.00 0.00 0.00
CHAPTER 3. A COMPARISON OF ASC REGULATION
Recently, the California legislature was considering three bills
that would, in part, regulate the delivery of health care by ASCs. In
order to help inform this process, we reviewed a variety of policies
relating to licensure and quality of ASCs and compared California’s
current approach to the approaches adopted by the 14 next-largest U.S.
states. This section offers a comparative perspective on the regulation
of ambulatory surgery centers, comparing California’s approach to the
regulatory approaches of a number of other large states.
BACKGROUND
California takes a distinctive approach to the regulation of ASCs.
California ASCs must be licensed as surgical clinics by the Department
of Public Health (DPH) or accredited as “outpatient settings” by the
Medical Board. In Capen v. Shewry (2007),16 the court decided that
physician-owned ASCs are to be regulated by the Medical Board, while all
other ASCs are to be regulated by the DPH. The DPH has interpreted
Capen to mean that ASCs with any physician owners cannot opt to be
licensed as surgical clinics. (Billingsley, 2008)17
Against this backdrop, three bills recently under consideration by
the California legislature in its 2007/8 session pertain to ASCs. The
substance of each of these bills as of August 23, 2008 is described
below.18
16 Capen v. Shewry (155 Cal. App. 4th 378 (2007).
17 The validity of this interpretation is a matter of some dispute,
however. (Meghrigian, 2008)
18For comprehensive legislative analyses of these proposed measure,
see http://info.sen.ca.gov/pub/07-08/bill/asm/ab_1551-1600/ab_1574_cfa_20080814_213459_asm_floor.html, http://info.sen.ca.gov/pub/07-08/bill/asm/ab_2951-3000/ab_2968_cfa_20080813_195016_asm_floor.html, and
http://info.sen.ca.gov/pub/07-08/bill/sen/sb_1451-1500/sb_1454_cfa_20080708_153239_asm_comm.html (accessed on August 23, 2008).
Assembly Bill 1574. This measure, introduced by Assemblymember
George A. Plescia, would modify access to drugs by ASCs and specify
Board of Pharmacy inspection requirements. Under current law, ASCs that
are licensed surgical clinics have wholesale access to drugs and may
administer them to patients. This bill would extend the same rights and
responsibilities to ASCs that are accredited as outpatient settings or
Medicare-certified. Specifically, it would
• allow accredited outpatient settings or Medicare-certified ASCs
to obtain drugs at wholesale prices and to administer drugs to
patients, upon receipt of a license from the State Board of
Pharmacy
• require that the Board of Pharmacy inspect accredited
outpatient settings or Medicare-certified ASCs within 120 days of
licensure and at least annually thereafter;
• permit the Board of Pharmacy to inspect licensed surgical
clinics within 120 days of licensure and at least annually
thereafter
• require that all ASCs conduct self-assessments within 30 days
of licensure by the Board of Pharmacy and at least 30 days prior
to license renewal
• impose various other clinical and administrative requirements.
Assembly Bill 2968. This measure, introduced by Assemblymember
Wilma Carter, would regulate elective cosmetic surgery. The bill would
require that, prior to such surgery, a patient receive a physical
examination by, and written clearance from, a licensed physician or, in
certain circumstances, a certified nurse practitioner or licensed
physician assistant.
Senate Bill 1454. This measure, introduced by former Senator Mark
Ridley-Thomas, would regulate the healing arts in outpatient settings.
This bill contains numerous changes to the accreditation of outpatient
settings. The bill would also
• eliminate an existing requirement that the Medical Board or an
accreditation agency give reasonable notice and present proper
• require an outpatient setting to develop and submit for approval by an accrediting agency comprehensive plans,
standardized procedures, and protocols for dealing with serious
surgical complications or side effects
• require outpatient settings be inspected at least once every
three years and as often as necessary to ensure the quality of
care
• require inspection reports (potentially including
recommendations for reinspection), as well as any provider
comments and plans of correction, be retained by the Medical Board
of California or accreditation agencies, and that this information
be open to public inspection
• require that an outpatient setting agree with the accreditation
agency on a plan of correction and publicly post the plan, in the
event of a deficiency
• require that the Medical Board notify the public whether an
outpatient facility is accredited, certified, or licensed; whether
these have been revoked, suspended, or placed on probation; or
whether the setting has been reprimanded by an accreditation
agency
• require that an accreditation agency immediately notify the
Medical Board when an outpatient setting is denied accreditation
• require that the Medical Board evaluate the performance of
accreditation agencies at least once every three years
• require that the Medical Board post information on its web site
pertaining to the risks of cosmetic surgery.
In addition to these bills before the California legislature, CMS
has been considering promulgating regulations on the reporting of
quality measures by ASCs. CMS has mandated that hospitals participating
in the outpatient prospective payment system19 publicly report measures
of the quality of outpatient care in 2009 or receive reductions in
19 This constitutes most hospitals. Important exceptions are
hospitals in Maryland, Critical Access Hospitals, and Indian Health Service hospitals.
annual updates to Medicare reimbursement rates.20 In early July 2008,
CMS stated its intent to impose similar requirements on ASCs in future
rulemaking.
While these proposed policies are quite varied, they appear
motivated by a common concern about the quality of outpatient care.
Moreover, many of these regulations seek to assure quality through
licensure requirements, e.g., periodic on-site inspections. Therefore,
the most relevant aspects of ASC regulation in California and the
comparison states revolve around issues relating to quality and
licensure.
APPROACH AND METHODS
The following questions were chosen for the regulatory comparison:
• Must ASCs be licensed or otherwise approved by regulatory
authorities?
• How often are ASCs inspected?
• Must inspections be conducted with prior notice or during
certain hours?
• Is accreditation related to licensing or regulatory approval?
• Must ASCs implement quality-assessment or improvement programs?
• Must ASCs report encounter-level data to regulatory authorities?
• Must ASCs report quality indicators to regulatory authorities?
These questions were addressed for the regulatory regimes of the 15
largest states and for the regulatory regime of CMS. The 15 largest
states were chosen according to the Census Bureau’s estimated population
in 2006.21 Table 8 lists the states studied.
Initially, ASC legal and regulatory issues published for health-law
practitioners by the American Health Lawyers Association (Becker et al.,
20See CMS-1404-FC at
http://edocket.access.gpo.gov/2008/pdf/E8-26212.pdf (accessed November 22, 2008.)
21 The Statistical Abstract of the United States reports state
population, most recently as of 2006, at http://www.census.gov/compendia/statab/ (accessed on September 16, 2009).
2006) was reviewed. RAND then retained Stateside Associates, a
regulatory consulting firm, to collate and summarize the regulatory
requirements in the target states and CMS. The consulting firm
abstracted statutes and regulation and interviewed responsible
officials.
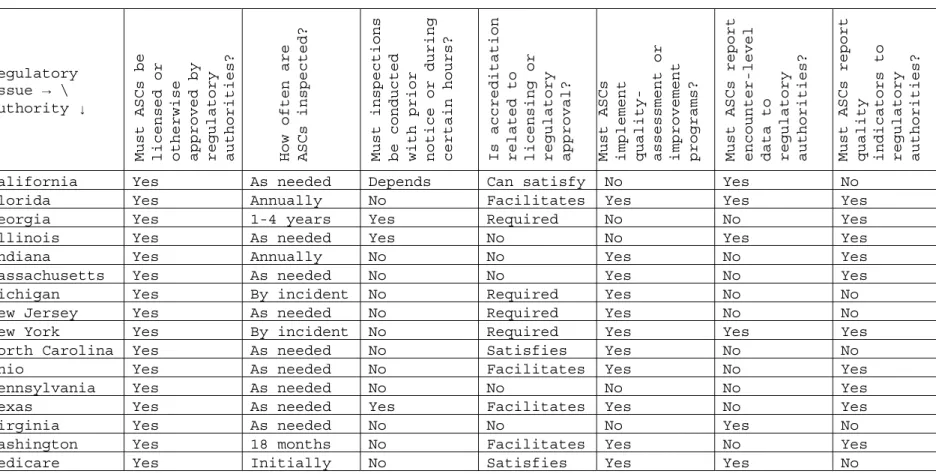
FINDINGS
The findings are reported in Table 8 and in Appendix B in Tables B1
through B7. Table 8 summarizes the findings for each of the regulatory
issues identified in the preceding section; Tables B1-B7 detail the
sources of information for each of these issues. When reading the
descriptions below, it is important to keep in mind that, in the context
of California regulation, “surgical clinics” are ASCs regulated by the
DPH while “outpatient settings” are ASCs regulated by the Medical Board.
ASC Licensing Requirements
Table B1 reports the findings state-by-state on ASC licensure and
approval. ASCs must be licensed/approved within all of the states
studied, as well as by CMS for Medicare purposes.
In California, non-physician-owned ASCs must be licensed as
surgical clinics by the Department of Public Health (DPH), while
physician-owned ASCs must be accredited as outpatient settings by the
Medical Board.22
Among the states studied, California is distinctive, and apparently
unique, in licensing/approving ASCs under a dual regime. Nevertheless,
the role of the physician is relevant in other jurisdictions. For
example, some authorities distinguish between freestanding facilities
operated for the purpose of providing ambulatory surgery (that is, ASCs)
and physicians’ offices.23
22 See, however, the discussion in footnotes 8 and 17 above.
Table 8: ASC Regulatory Comparison Summary
Regulatory
Issue → \
Authority ↓
Must ASCs be licensed or otherwise approved by regulatory authorities? How often are ASCs inspected? Must inspections be conducted with prior notice or during certain hours? Is accreditation related to licensing or regulatory approval? Must ASCs implement quality- assessment or improvement programs? Must ASCs report encounter-level data to regulatory authorities? Must ASCs report quality indicators to regulatory authorities?
California Yes As needed Depends Can satisfy No Yes No
Florida Yes Annually No Facilitates Yes Yes Yes
Georgia Yes 1-4 years Yes Required No No Yes
Illinois Yes As needed Yes No No Yes Yes
Indiana Yes Annually No No Yes No Yes
Massachusetts Yes As needed No No Yes No Yes
Michigan Yes By incident No Required Yes No No
New Jersey Yes As needed No Required Yes No No
New York Yes By incident No Required Yes Yes Yes
North Carolina Yes As needed No Satisfies Yes No No
Ohio Yes As needed No Facilitates Yes No Yes
Pennsylvania Yes As needed No No No No Yes
Texas Yes As needed Yes Facilitates Yes No Yes
Virginia Yes As needed No No No Yes No
Washington Yes 18 months No Facilitates Yes No Yes
ASC Inspection Frequency
ASC inspection frequencies vary among states. Findings on the
frequency with which authorities conduct on-site inspections of ASCs are
presented in Table B2.
In a majority of jurisdictions, statute or regulatory code
explicitly provides that ASCs may be inspected as necessary to ensure
compliance with regulatory requirements. Even where there is not an
explicit provision, regulation may allow for inspection in the event of
a complaint or a serious incident; Michigan and New York are examples.
In other jurisdictions, regulation stipulates the frequency of
inspection. For example, ASCs must be inspected every 18 months in
Washington. Some regulations call for periodic inspections. In Georgia, current practice is to inspect facilities every one to four
years, based on the findings of a facility’s last survey. At the
federal level, CMS ordinarily requires an inspection only upon initial
Medicare certification, although regulatory officials report that CMS
has ordered special inspections this year.
Under California’s dual licensure/accreditation regime, ASCs that
are surgical clinics or outpatient settings may be inspected as
necessary; ASCs that are licensed as surgical clinics are exempt from
periodic inspection. Senate Bill 1454 would explicitly require that
outpatient settings be inspected every three years but as often as
needed. Assembly Bill 1574 would require that ASCs that are accredited
as outpatient settings or Medicare-certified be inspected at least
annually by the State Board of Pharmacy; in addition, the Board of
Pharmacy would be permitted to annually inspect ASCs that are licensed
as surgical clinics.
Prior Notice for Inspections
The effectiveness of inspections presumably has to do with the
manner and timing of those on-site inspections. Findings on the
variation among states in the manner and timing of on-site inspections