Environmental Science and Ecology Faculty
Publications Environmental Science and Ecology
7-29-2009
Total PCBs, Dioxin-Furan TEQs and Total
Mercury Concentrations in Mink In and Out of the
Rochester Embayment Area of Concern Near and
Inland from the Shore of Lake Ontario
James M. Haynes
The College at Brockport, jhaynes@brockport.edu
James J. Pagano Sara Tucker Wellman
The College at Brockport, wellmanst@aol.com
Follow this and additional works at:https://digitalcommons.brockport.edu/env_facpub
Part of theEnvironmental Sciences Commons
Citation/Publisher Attribution:
Haynes, J.M., Pagano, J.J. & Wellman, S.T. Total PCBs, Dioxin-Furan TEQs and Total Mercury Concentrations in Mink In and Out of the Rochester Embayment Area of Concern Near and Inland from the Shore of Lake Ontario. Arch Environ Contam Toxicol (2009) 57: 794.
https://doi.org/10.1007/s00244-009-9365-0
Repository Citation
Haynes, James M.; Pagano, James J.; and Wellman, Sara Tucker, "Total PCBs, Dioxin-Furan TEQs and Total Mercury Concentrations in Mink In and Out of the Rochester Embayment Area of Concern Near and Inland from the Shore of Lake Ontario" (2009). Environmental Science and Ecology Faculty Publications. 106.
Total PCBs, Dioxin-Furan TEQs and Total Mercury Concentrations in Mink In and Out of the Rochester Embayment Area of Concern
Near and Inland from the Shore of Lake Ontario
James M. Haynes,1,3 James J. Pagano,2 and Sara T. Wellman1
1
Department of Environmental Science and Biology The College at Brockport
State University of New York Brockport, NY 14420
2
Environmental Research Center and Department of Chemistry The College at Oswego
State University of New York Oswego, NY 13126
3
Copies: www.brockport.edu/envsci Published article available at:
http://www.springerlink.com/openurl.asp?genre=article&id=doi:10.1007/s00244-009-9365-0
Abstract
In terms of reproductive and other adverse outcomes after exposure to
polychlorinated biphenyls (PCBs), dioxins and furans, the mink (Mustela vison) is one of the most sensitive mammals. Our objective was to determine if there are differences in the concentrations of total mercury (Hg), total PCBs, and dioxin-furan toxic equivalents (TEQs) between mink living in and out of the Rochester Embayment of Lake Ontario (RELO) Area of Concern (AOC) and between mink living near the shore of Lake Ontario and inland. Concentrations of total Hg in brain, total PCB and dioxin-furan TEQ in adipose, and total PCB in liver were significantly higher for mink living near the shore of Lake Ontario than inland. For mink living in and out of the AOC, differences in total PCB and dioxin-furan TEQ in adipose and liver were substantial but not significant. Correlations between
concentrations of total Hg, total PCB, and dioxin-furan TEQ in mink were high. Our results suggest that contamination of mink living near the southern shore of Lake Ontario primarily comes from contact with the Lake Ontario food web, not from sources in the RELO AOC.
Introduction
In the 1980s the binational (Canada, U. S.) International Joint Commission (IJC) began the process of creating and implementing remedial action plans (RAP) in 43
contaminated areas of concern (AOC) throughout the Great Lakes Basin. The IJC established 14 ―use impairments‖ that could cause a local area to be ―listed‖ as an AOC, including ―degradation of fish and wildlife populations‖ and ―bird or animal deformities or
reproductive problems.‖ In the Rochester Embayment of Lake Ontario (RELO) AOC, both uses were listed as impaired because ―very few‖ mink (Mustela vison), one of the most sensitive mammals to PCBs, dioxins and furans (Basu et al. 2007), were then being trapped or observed within 3 km of the Lake Ontario shoreline (RAP 1993, 1997).
The RELO AOC includes the Rochester Embayment, a 94 km2 portion of Lake Ontario south of a line between Bogus Point in the town of Parma and Nine Mile Point in the town of Webster (both in Monroe County, New York), adjacent wetlands and bays, and the 10 km reach of the Genesee River from the Lower Falls to Lake Ontario (Figure 1).
We report on concentrations of total PCB, dioxin-furan TEQ, and total mercury in lakeshore and inland populations of mink in and out of the AOC. While total PCB and dioxin-furan TEQ have limitations as estimators of toxicity to wildlife (Giesy and Kannan 2008, Blankenship et al. 2008), we wanted to develop a simple biomonitoring tool to answer the question of whether mink in the RELO AOC are potentially suffering from the ―bird or animal deformities or reproductive problems‖ or ―degradation of fish and wildlife
populations‖ use impairments, and whether these impairments can be ―delisted‖ by the IJC. For detailed examination of potential toxicity to mink, congeners of PCBs, dioxins and furans also were analyzed (Pagano and Haynes, unpublished data).
Methods
Specimen Collection, Processing and Handling
Collection. Forty mink carcasses were collected by trappers (90% during climatic winter in western New York, November through March) during 2004 and 2005 in five areas which we divided into four regions (Figure 1): Inland/AOC, Lakeshore/AOC, Inland/Out of AOC, and Lakeshore/Out of AOC. Lakeshore/AOC was the Braddock Bay Wildlife
Management Area (BBWMA—a large wetland complex), and Lakeshore/Out of AOC was along streams in uplands and small wetlands beginning 15 km west of the BBWMA. Inland/AOC included animals taken in the AOC watershed more than 5 km from the lakeshore (primarily from near the Bergen Swamp, 34 km south of the BBWMA), and Inland/Out of AOC included animals taken ~180 km east of the BBWMA in the Tug Hill Plateau beyond the eastern end of Lake Ontario and from the Iroquois National Wildlife Refuge 50 km southwest of the BBWMA (we used five mink from each of these two inland regions). Skinned carcasses were put in labeled plastic bags and frozen by the trappers who also completed log sheets indicating the date and location of capture for each animal. Chemical concentrations were determined for ten mink from each region.
Processing. We thawed the frozen mink carcasses before recording tail-less and pelt-less body weight and length and the weight of each tissue sample. We placed carcasses in
hexane-rinsed aluminum containers for resection, and all utensils used were rinsed with hexane between uses. Tissues collected for analyses were adipose and liver (total PCB, dioxin-furan TEQ) and brain (total mercury). Adipose was scarce (<6 g) on most (29/40) carcasses, so it was collected wherever it was found. Teeth were collected and aged but aging proved unreliable, similar to the results of Tansy et al. (2003).
Analytical Procedures
Dioxins, Furans and Mercury. Liver and adipose were shipped frozen on dry ice to Columbia Analytical Services (CAS), Inc.’s laboratory in Houston, TX for dioxin/furan analyses (Method 8290A, USEPA 1998), and to the Environmental Research Center (ERC) at SUNY Oswego for PCB analysis. Brains for total mercury analysis (Method 7471A, USEPA 1994) were shipped to CAS’s laboratory in Kelso, WA. Methyl mercury accounts for >90% of total mercury in mink brain (Evans et al. 2000). Depending on the sample and congener, method detection limits (MDL) for dioxins/furans and mercury were 1.0-5.0 ng/kg and 0.001-0.019 mg/kg, respectively. Toxic equivalency factors (TEF) used to calculate toxic equivalents (TEQ) came from USEPA (1989).
Total PCB Sample Extraction and Clean-up. All tissue samples were extracted for gas chromatographic analysis after methods developed at The College at Oswego ERC (Pagano et al. 1999, Stewart et al. 2008). Each sample was extracted three times with 50 mL hexane using a Brinkman Polytron homogenizer. Lipid analysis was conducted by gravimetric procedures utilizing a subsample of the extracted sample. Sample cleanup utilized automated Gel Permeation Chromatography (USEPA 1997, Method 3640A) followed by a silica gel for separation of PCBs from other interferences. In general, silica gel adsorption column cleanup utilized 5.5 grams of 4% deactivated silica gel (100-200 mesh) placed in a 10.5 x 250 mm chromatography column with an upper layer of anhydrous sodium sulfate. The sample extract was added to the silica gel column and sequentially eluted with hexane which was concentrated to 1 mL with a Kuderna-Danish apparatus using a three ball Snyder Column on a steam bath before gas chromatographic analysis.
Total PCB Chemical Analysis. Dual-column congener-specific PCB analyses were based on capillary column procedures developed by Frame et al. (1996) and described previously (Pagano et al. 1999, Chiarenzelli et al. 2001, Stewart et al. 2008). Briefly,
analytical instruments were recalibrated every five samples, with a system blank, instrument blank, and mid-level calibration check solution analyzed during each analytical run. A Hewlett-Packard (HP) Model 5890II GC with an electron capture detector (ECD - Ni63) and autosampler was used for primary data acquisition. The capillary column utilized was a HP Ultra II, 25 meter with 0.22 mm id and 0.33 um film thickness. The calibration standard was a 1:1:1:1 mixture of Aroclors 1221, 1016, 1254 and 1260 each at 200 pg/uL,
hexachlorobenzene (HCB) at 5 pg/uL, and p-p' DDE and Mirex each at 10 pg/uL (Custom Mix - AccuStandard, Inc., New Haven, CT), which allowed for the analysis of 99
chromatographic zones of 132 congeners/co-eluters.
PCB analyses were confirmed with a HP Model 5890 II gas chromatograph with an electron capture detector (Ni63) and autosampler using a 60 meter DB-XLB capillary column with 0.25 mm id and 0.25 um film thickness. The calibration standard was a 1:1:1:1:1
mixture of congener mixtures C-CSQ-SETS 1-5 at 10pg/uL per individual congener (C-CSQ-SET; AccuStandard, Inc.) based on the work of Frame et al. (1996), allowing for the analysis of 122 chromatographic zones of 155 congeners/co-eluters. Total PCBs were
determined by summation of all congeners/co-eluters. Method detection limits for total PCBs (by summation of congeners) were determined for adipose (87.7 ng/g, N=7) and liver (5.4 ng/g, N=6) by using the average method blank (MB) + STDEV of (MB) * student's t-statistic (t 0.99, n-1 DF).
Total PCB Quality Documentation. Laboratory quality assurance at The College at Oswego ERC is based on a quality management program developed from USEPA protocols (USEPA 1997, Pagano 2005, Holsen et al. 2008). The program consists of measurement quality objective acceptance criteria for replicate analyses, surrogate analyte recoveries, matrix spikes/matrix spike duplicates, and method, reagent and system blanks. Surrogate recoveries (SR, mean + std. dev.) for the various mink tissues analyzed in this project averaged: SR PCB_014 = 86.9 + 14.3%, SR PCB_065 = 86.4 + 17.6%, SR PCB_166 = 90.1 + 21.6% and SR PCT_003 = 83.1 + 20.4% (polychlorinated triphenyl). During the project, general laboratory quality assurance and silica gel method validation were determined by analysis (N=16) of National Institute of Standards and Technology (NIST) Standard Reference Material 1946 (Lake Superior Fish Tissue). Average recoveries + standard deviations of certified concentration values for PCBs were 92.9 + 5.9%.
Data Analysis
We used Microsoft ® Excel 2000 for data management and non-statistical calculations and SPSS® 16.0 (SPSS Inc., Chicago, IL) for statistical analyses. We used General Linear Models (ANCOVA with two fixed factors: Area—AOC in vs. AOC out and Location—near lakeshore vs. inland, using the covariates sex, body weight, and percent lipid in adipose and liver, as appropriate) to analyze relationships between chemical
concentrations and capture areas and locations in the study area. Bonferroni corrections for ά = 0.05 associated with multiple F-tests were employed. To meet the assumptions of ANOVA regarding normality and homoscedasticity, extreme but valid outliers in the chemical data (mink 17, 22 and 49 in Appendix 1) were reduced in magnitude compared to the rest of the data in their area-location groups (Tabachnick and Fidell 2007) and all chemical data were log10 (n+1)-transformed. Covariates percent lipid in adipose and liver were
arcsine-transformed while body mass and sex were not arcsine-transformed. After transformation, data for each of the five chemicals and three of the covariates (body mass and percent lipid in adipose and liver; sex has a binomial distribution) met the assumption of homogeneous variance (Levene’s test, P = 0.138-0.996), and 30/32 chemical-area-location combinations, as well as the covariates of body mass and percent lipids in adipose and liver, met the assumption of normality (Shapiro-Wilk test; the two combinations that were not normally distributed were acceptably close; P > 0.035, Tabachnick and Fidell 2007). Zero values for chemical results below detection limits (BDL) were excluded to avoid skewing general trends low (BDL ≠ no chemical present). Correlation analysis was used to evaluate relationships between
Results
Excluding one mink not analyzed and three BDL, 36 of 40 mink had mercury in brain (Appendix 1). Total Hg concentrations did not differ in and out of the AOC but
concentrations in mink from near the Lake Ontario shore were significantly higher than those of inland mink (P = 0.026, Table 1). The sex and mass covariates were not significant.
Thirty-eight of 40 mink had sufficient adipose for total PCB analysis and 40 livers were analyzed for total PCB. Total PCB concentrations in adipose and liver did not differ in and out of the AOC but there were significant differences for total PCB between lakeshore and inland mink for adipose (P = 0.001) and liver (P = 0.031). Among the covariates used to analyze total PCB in adipose—sex, mass, and percent lipid in adipose—none were
significant. Among the covariates used to analyze total PCB in liver—sex, mass, and percent lipid in liver—percent lipid (P < 0.001) was significant and sex (P = 0.070) and mass (P = 0.081) approached significance (Table 1).
Thirty-two and 18 of 40 mink had total dioxin-furan TEQ above detection limits in adipose and liver, respectively. Dioxin-furan TEQ in adipose and liver did not differ in and out of the AOC. Between lakeshore and inland mink there was a significant (P = 0.016) difference for dioxin-furan TEQ in adipose but not for liver (P = 0.171). Among the covariates used to analyze dioxin-furan TEQ in adipose and liver—sex, mass, and percent lipid in the respective tissue—none were significant (Table 1).
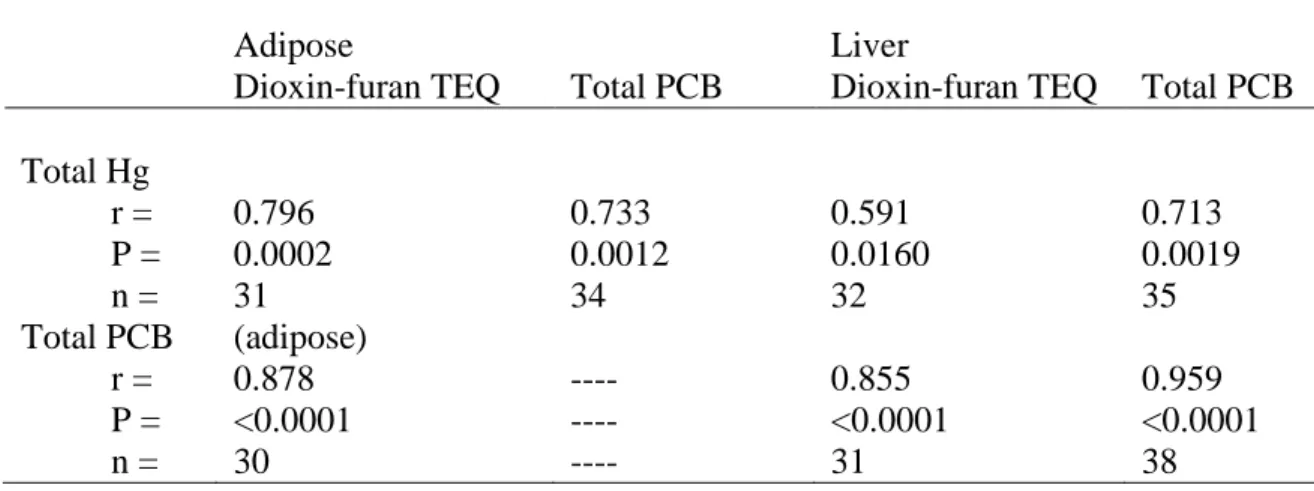
Correlations between concentrations of total Hg, total PCB, and dioxin-furan TEQ in brain, adipose and liver were high (r = 0.591-0.878) and significant (P < 0.0001-0.016, Table 2). Furthermore, within laboratory correlations for adipose and liver were very high and significant for total PCB (ERC, r = 0.982, P < 0.0001) and dioxin-furan TEQ (CAS, r = 0.748, P = 0.0009).
Discussion
Except for dioxin-furan TEQ in liver (lowest concentrations and sample sizes), total Hg in brain, total PCB in adipose and liver, and dioxin-furan TEQ in adipose were
significantly higher in mink captured near the shore of Lake Ontario than in those captured inland. There were no significant differences in total PCB, dioxin-furan TEQ, and total Hg concentrations in and out of the Rochester Embayment AOC, although mean concentrations for total PCB and dioxin-furan TEQ were higher in the AOC than out of the AOC by factors of 2-4 (Table 1). High variations in concentrations among animals resulted in low statistical power to distinguish quite different mean concentrations despite sample sizes of 10-20 mink per chemical both in and out of the AOC (Table 1). Total Hg concentrations differed little in and out of the AOC.
Concentrations of total PCB and dioxin-furan TEQ in liver in our study (n = 40 mink) ranged from 7-5,871 ng/g-ww (mean = 327) and BDL-47.6 ng/kg-ww (mean = 6.4),
respectively (Appendix 1). For South Carolina (n = 6) and Louisiana (n = 6) mink, Tansy et al. (2003) reported total PCB of 133-413 (mean = 263) and 65-238 (mean = 139) ng/g-ww, respectively. Mean dioxin-furan TEQ in South Carolina and Louisiana were 21.0 and 13.8 ng/kg-ww (reported as pg/g-ww by Tansy et al. 2003), respectively. In our study two mink had very high total PCB and three had very high dioxin-furan TEQ in liver (see below). Excluding these data, total PCB and dioxin-furan TEQ in our study ranged from 7-755
ng/g-ww (mean = 127) and BDL-4.2 ng/kg (mean = 1.0), respectively. Overall, excluding the mink with exceptionally high concentrations, total PCB concentrations in mink in our study area are similar to or lower than those in Louisiana and South Carolina, respectively, while dioxin-furan TEQ in our study was far below that reported by Tansy et al. (2003).
Due to expense, no co-planar PCB data were collected for this project; therefore, the dioxin-furan TEQ values reported here are lower than total TEQ. Co-planar PCBs accounted for 20-25% of total TEQ in wild adult male mink in Louisiana and South Carolina,
respectively (Tansy et al. 2003), and for 43% in kits and juveniles in a laboratory study (Martin et al. 2006). Therefore, multiplying the dioxin-furan TEQ values we report by factors of 1.25 and 2.0 gives the likely range of total TEQ in mink in our study.
The highest mean dioxin-furan TEQ concentration in mink liver was 14.8 ng/kg-ww near the lakeshore in the AOC, and the lowest mean concentration was 0.3 ng/kg-ww inland out of the AOC (Table 1). Multiplying these lowest and highest mean dioxin-furan TEQ concentrations by factors of 1.25 and 2.0, respectively, predicts the range of mean total TEQ in mink liver across the entire study area: 0.4-29.6 ng/kg-ww. The lowest LOAEL (lowest observable adverse effect levels) for total TEQ in liver known for mink (cancerous jaw lesions) is 40.2 ng/kg-ww (Bursian et al. 2006 a-c). Therefore, most mink in the entire study area are unlikely to be adversely affected by total TEQ.
Two mink (17, 22), captured in the AOC near the shore of Lake Ontario, had exceptionally high concentrations of total PCB in liver: 5,871 and 2,389 ng/g-ww,
respectively (Appendix 1). The lowest LOAEL (lowest observable adverse effect level) for total PCB in liver known for mink (cancerous jaw lesions) is 1,698 ng/g-ww (Bursian et al. 2006 a-c). The same two mink also had high dioxin-furan TEQ in liver: 21.3 and 47.6 ng/kg-ww, respectively. Mink 49, caught near the lakeshore out of the AOC, also had high dioxin-furan TEQ in liver (31.8 ng/kg-ww). Again using the factors 1.25 and 2.0, low and high total TEQ in liver for these mink likely ranged from 26.6-95.2 ng/kg-ww. Therefore, the most highly exposed mink along the lakeshore in the study area potentially may suffer from cancerous jaw lesions from either total PCB or total TEQ (see Haynes et al. 2009).
Several factors may account for the high levels of total PCB and dioxin-furan TEQ in mink 17 and 22. First, these mink were caught in the Braddock Bay Wildlife Management Area (Figure 1) that has a broad connection to Lake Ontario water and its food web, including the carcasses of migrating salmonines with high contaminant concentrations (O’Toole et al. 2006, Carlson and Swackhamer 2006) each fall. Second, there may be small toxic hot spots in the BBWMA to which mink are exposed through their food web. Haynes et al. (2004) reported that one sediment sample from a creek near where mink 17 was captured had a concentration of 1.5 ppm total PCB. Mink 22 was captured near another area of the BBWMA that was a munitions factory during and after World War II. In contrast, lakeshore mink out of the AOC were captured in a much smaller watershed that has fewer migrating salmonines and no suspected toxic hotspots. Third, stable isotope analysis (see Wellman et al. 2009) showed that mink 17 (N = 16.9) fed one trophic level higher than other lakeshore mink (N = 12.7) but mink 22 (N = 11.09) and 49 (N = 11.63) fed below the average trophic level of lakeshore mink, again suggesting that fish migrating from Lake Ontario may have comprised a high proportion of the diet of mink 17.
Conclusion
Mink captured near the shore of Lake Ontario (i.e., potentially in contact with the lake’s food web) had significantly higher concentrations of total Hg in brain, total PCB and dioxin-furan TEQ in adipose, and total PCB in liver than inland mink. Concentrations of dioxin-furan TEQ in liver did not differ between mink caught near the lakeshore and inland. Although concentrations in mink in the inland portion of the Rochester Embayment AOC were generally higher than those in inland mink outside of the AOC, highest concentrations did not exceed LOAEL concentrations for total PCB and estimated total TEQ (Bursian et al. 2006 a-c). It appears that sources of PCB and TEQ originating in the AOC, if any, are not contributing to the ―degradation of fish and wildlife populations‖ and ―bird or animal deformities or reproductive problems‖ use impairments identified in the RAP (1993, 1997). The major source of these chemicals appears to be contact with the Lake Ontario food web.
Correlations among concentrations of total PCB and dioxin-furan TEQ in adipose and liver and total Hg in brain were high and highly significant. This finding suggests that fewer tissues and, possibly, fewer chemicals need to be monitored in the future in the Rochester Embayment of Lake Ontario to assess the status of chemicals of concern in mink and other sentinel species. Liver is the best tissue to sample for PCB and TEQ because detectable levels of these chemicals concentrate there and concentrations in liver associated with a variety of adverse impacts are known (Bursian et al. 2006 a-c). However, chemicals of emerging concern (e.g., polybrominated diethyl ethers, PBDE) should not be ignored in future sampling to evaluate chemical contamination in the AOC.
For biomonitoring and remediation purposes in the RELO AOC and other locations with mink, before engaging in costly, detailed, congener-specific analyses, we recommend a four-step approach assess the potential for toxicity to mink. 1) Use the latest USEPA data to determine the concentrations of PCB and TEQ in mink water supplies and use the modeling approach described in Wellman et al. (2009) to determine if estimated concentrations in mink are likely to cause jaw lesions. 2) If concentrations sufficient to cause jaw lesions are
predicted by modeling, capture mink and evaluate the prevalence of jaw lesions (Haynes et al. 2009). 3) If jaw lesions are found, find and remediate sources of PCB and TEQ
contaminating water in the area of concern. 4) Repeat steps 1-3 every 5-10 years until no evidence of jaw lesions is found, at which time the ―bird or animal deformities or
reproductive problems‖ or ―degradation of fish and wildlife populations‖ use impairments can be ―delisted‖ by the IJC.
Acknowledgments
Randall Baase, Matt Lochner, and other trappers contributed carcasses; Scott Wells and Ross Abbett dissected the mink. ―Doc‖ Fink, Dick Sands, Mel Reber, and Al Burkhart allowed us to collect mink on their property, as did James Slusarczyk of the New York State Office of Parks, Recreation, and Historic Preservation. Gregory M. Sumner prepared samples for gas chromatographic analysis. Carol Zollweg created Figure 1. Two anonymous
reviewers greatly improved the quality of the manuscript. This project was funded by grant C302399 from the New York State Great Lakes Protection Fund.
Literature Cited
Basu N, Scheuhammer AM, Bursian SJ, Elliot J, Rouvinen-Watt K, Chan HM. (2007) Mink as a sentinel species in environmental health. Environmental Research 103: 130-144. Blankenship, AL, Kay, DP, Zwiernik, MJ, Holem, RR, Newsted, DL, Hecker, M, Giesy, JP. (2008) Toxicity reference values from mink exposed to 2,3,7,8-tetrachlorodibenzo-p -dioxin (TCCD) equivalents (TEQ). Ecotoxicology and Environmental Safety 69: 325-349.
Bursian SJ, Beckett KJ, Yamini B, Martin PA, Kannan K, Shields KL, Mohr FC. (2006a) Assessment of effects in mink caused by consumption of carp collected from the Saginaw River, Michigan, USA. Archives of Environmental Contamination and Toxicology 50: 614-623.
Bursian SJ, Sharma C, Aulerich RJ, Yamini B, Mitchell RR, Orazio CE, Moore DRJ, Svirsky S, Tillitt DE. (2006b) Dietary exposure of mink (Mustela vison) to fish from the Housatonic River, Berkshire County, Massachusetts, USA: Effects on
reproduction, kit growth, and survival. Environmental Toxicology and Chemistry 25: 1533-1540.
Bursian SJ, Sharma C, Aulerich RJ, Yamini B, Mitchell RR, Beckett KJ, Orazio CE, Moore D, Svirsky S, Tillitt DE. (2006c) Dietary exposure of mink (Mustela vison) to fish from the Housatonic River, Berkshire County, MA, USA: Effects on organ weights and histology and hepatic concentrations of polychlorinated biphenyls and 2,3,7,8-tetrachlorodibenzo-p-dioxin toxic equivalents. Environmental Toxicology and Chemistry 25: 1541-1550.
Carlson, DL, Swackhamer DL. (2006) Results from the U.S. Great Lakes Fish Monitoring Program and effects of lake processes on bioaccumulative contaminant
concentrations. Journal of Great Lakes Research 32: 370-385.
Chiarenzelli J, Pagano J, Milligan M, Holsen T, Hopke P, Scrudato R, Falanga L, Battalagia T, Migdal K, Hsu Y-K, Hartwell A. (2001) Enhanced airborne PCB concentrations and chlorination downwind of Lake Ontario. Environmental Science and Technology 35: 3280-3286.
Evans RD, Addison EM, Villeneuve JY, MacDonald KS, Joachim DG. (2000) Distribution of inorganic and methylmercury among tissues in mink (Mustela vison) and otter (Lutra canadensis). Environmental Research Section A 84: 133-139.
Frame GM, Cochran JW, Bowadt SS. (1996) Complete PCB congener distributions for 17 Aroclor mixtures determined by 3 HRGC systems optimized for comprehensive, quantitative, congener-specific analysis. Journal High Resolution Chromatography 19: 657-668.
Giesy, JP, Kannan, K. (2002) Dioxin-like and non-dioxin like effects of PCBs: Implications for risk assessment. Lakes and Reservoirs: Research and Management 7: 139-181. Haynes, JM, Makarewicz, JC, Young, TC. (2004) Levels of bioaccumulative chemicals of concern in air, water, sediment and sentinel species of the Rochester Embayment of Lake Ontario. Final report to the NY Great Lakes Protection Fund. NY Department of Environmental Conservation, Buffalo, NY. http://www.dec.ny.gov/lands/25597.html Haynes JM, Wellman ST, Beckett, KJ, Pagano JJ, Fitzgerald, SD, Bursian, SJ. (2009)
Histological lesions in mink jaws are a highly sensitive biomarker of effect after exposure to TCDD-like chemicals: field and literature-based confirmations. Archives of Environmental Contamination and Toxicology. Available at:
http://www.springerlink.com/openurl.asp?genre=article&id=doi:10.1007/s00244-009-9362-3.
Holsen T, Hopke P, Milligan M, Pagano J. (2008) Chemical analysis of fish tissue for the Great Lakes Fish Monitoring Program. Quality Documentation (Version 4): United States Environmental Protection Agency and Great Lakes National Program Office. EPA Agreement Number: GL 96594201.
Martin, PA, Mayne, GJ, Bursian, S, Palace, V, Kannan, K. (2006) Changes in thyroid and vitamin A status in mink fed polyhalogenated-aromatic-hydrocarbon-contaminated carp from the Saginaw River, Michigan, USA. Environmental Research 101: 53-67. O’Toole, S, Metcalfe, C, Craine, I, Gross, M. (2006) Release of persistent organic
contaminants from carcasses of Lake Ontario Chinook salmon (Oncorhynchus tshawytscha). Environmental Pollution 140: 102-113.
Pagano JJ, Rosenbaum P, Roberts R, Sumner G, Williamson L. (1999) Assessment of maternal contaminant burden by analysis of snapping turtle eggs. Journal of Great Lakes Research 25: 950-962.
Pagano J. (2005) Deposition and ambient concentrations of PBTs (PCBs, OCs, PBDEs, and dioxins/furans) in support of the Lake Ontario Air Deposition Study (LOADS), Quality Assurance Project Plan (QAPP). Great Lakes Commission-Great Lakes Air Deposition (GLAD) Program, Ann Arbor, MI. June 28, 2005 – Version 01
RAP. (1993) Stage I Remedial Action Plan for the Rochester Embayment of Lake Ontario. Monroe County Department of Health. Rochester, NY.
RAP. (1997) Stage II Remedial Action Plan for the Rochester Embayment of Lake Ontario. Monroe County Department of Health. Rochester, NY.
Stewart P, Lonky E, Reihman J, Pagano J, Gump B, Darvill T. (2008) The relationship between prenatal PCB exposure and intelligence (IQ) in 9-year-old children. Environmental Health Perspectives 116: 1416-1422.
Tabachnick, BG, Fidell, LS. (2007) Using Multivariate Statistics, 5th Ed. Allyn and Bacon. Tansy, CL, Senthilkumar, K, Pastva, SD, Kannan, K, Bowerman, WW, Masunaga, S, Giesy,
JP. (2003). Concentrations and profiles of polychlorinated biphenyls, -dibenzo-p-dioxins and -dibenzofurans in livers of mink from South Carolina and Louisiana, USA. Environmental Monitoring and Assessment 83: 17-33.
USEPA. (1989) Interim Procedures for estimating risks associated with exposures to mixtures of chlorinated dibenzo-p-dioxin and dibenzofurans (CCDs and CDFs) and 1989 update. (EPA/625/3-89/016). U.S. Environmental Protection Agency.
Washington, D.C.
USEPA. (1994) Method 7471A. Mercury in solid or semisolid waste (Manual Cold Vapor Technique). U.S. Environmental Protection Agency. Washington, DC.
USEPA. (1997) Test methods for evaluating solid waste, physical/chemical methods (SW-846). U.S. Environmental Protection Agency. CD-ROM Version 2, National Technical Information Service. Washington, DC.
USEPA. (1998) Method 8290A. Polychlorinated dibenzodioxins (PCDDs) and
polychlorinated dibenzofurans (PCDFs) by high resolution fast chromatography/high resolution mass spectrometry (HRGS/HRMS). U.S. Environmental Protection
Agency. Washington, DC.
Wellman ST, Haynes JM, Pagano JJ. (2009)Model estimates bioaccumulation of total PCBs, dioxin–furan TEQs, and total mercury in mink liver based on concentrations in Lake Ontario water. Archives of Environmental Contamination and Toxicology. Available at: http://www.springerlink.com/openurl.asp?genre=article&id=doi:10.1007/s00244-009-9361-4
Table 1. Concentrations of total mercury, total PCBs, and dioxin-furan TEQs in mink from the four study areas: In AOC/Lakeshore, In AOC/Inland, Out of AOC/Lakeshore, and Out of AOC/Inland. Means and standard deviations are actual values but statistics were calculated using log10-transformed data for all chemicals and arcsine-transformed percent lipid in adipose and liver. N/A = not
applicable.
Lakeshore/ In AOC/
Chemical Area/Location N Mean (SD) Inland P
Out AOC P Interaction P Covariate P Power
Mercury (brain) In AOC/Lakeshore 9 0.42 (0.44) (mg/kg-wet wt) In AOC/Inland 9 0.16 (0.16) Out AOC/Lakeshore 9 0.30 (0.16) 0.026 0.620 Out AOC/Inland 9 0.19 (0.15) 0.853 0.054 Interaction 0.920 0.051 Sex covariate 0.838 0.055 Mass covariate 0.661 0.071
% lipid covariate N/A N/A
Total PCB (adipose) In AOC/Lakeshore 10 13610 (31129) (ng/g-wet wt) In AOC/Inland 10 1680 (2502) Out AOC/Lakeshore 10 3970 (3281) 0.001 0.954 Out AOC/Inland 8 387 (226) 0.492 0.103 Interaction 0.316 0.167 Sex covariate 0.345 0.154 Mass covariate 0.210 0.237 % lipid covariate 0.208 0.238
Total PCB (liver) In AOC/Lakeshore 10 957 (1873) (ng/g-wet wt) In AOC/Inland 10 101 (175)
Out AOC/Lakeshore 10 231 (227) 0.017 0.688
Interaction 0.035 0.571
Sex covariate 0.070 0.442
Mass covariate 0.081 0.416
% lipid covariate <0.001 0.998
TEQ (adipose) In AOC/Lakeshore 8 51.4 (116.4) (ng/kg-wet wt) In AOC/Inland 9 4.8 (4.4) Out AOC/Lakeshore 9 15.4 (12.2) 0.016 0.698 Out AOC/Inland 6 5.0 (5.3) 0.471 0.108 Interaction 0.957 0.050 Sex covariate 0.319 0.164 Mass covariate 0.523 0.095 % lipid covariate 0.269 0.192
TEQ (liver) In AOC/Lakeshore 5 14.8 (20.3) (ng/kg-wet wt) In AOC/Inland 5 1.0 (1.8) Out AOC/Lakeshore 5 7.2 (13.8) 0.171 0.268 Out AOC/Inland 3 0.3 (0.4) 0.642 0.072 Interaction 0.931 0.051 Sex covariate 0.287 0.176 Mass covariate 0.556 0.086 % lipid covariate 0.220 0.221
Table 2. Correlations of concentrations of total PCB and dioxin-furan TEQ in adipose and liver and total mercury (Hg) in the brain of mink.
Adipose Liver
Dioxin-furan TEQ Total PCB Dioxin-furan TEQ Total PCB Total Hg r = P = n = 0.796 0.0002 31 0.733 0.0012 34 0.591 0.0160 32 0.713 0.0019 35 Total PCB r = P = n = (adipose) 0.878 <0.0001 30 ---- ---- ---- 0.855 <0.0001 31 0.959 <0.0001 38
Figure 1. Map showing the four regions of mink capture. AOC/Lakeshore is the Braddock Bay Wildlife Management Area (BBWMA), AOC/Inland is mostly near the Bergen Swamp ~34 km south of the BBWMA, and Out of AOC/Lakeshore began 15 km west of the
BBWMA. Out of AOC/Inland is the Iroquois National Wildlife Refuge ~50 km southwest of the BBWMA and beyond the eastern end of Lake Ontario ~180 km east of the BBWMA (not shown on the map).
Appendix 1. Geographical, biological and chemical data for the 40 mink in this study.
TPCB TPCB TEQ TEQ Mercury
Capture Agea Weightb % Lipidc
%
Lipid Adipose Liver Adiposed,e Liver Brainf
Specimen Area Location Season (years) Gender (g) Adipose Liver (ng/g-ww) (ng/g-ww) (ng/kg-ww) (ng/kg-ww) (mg/kg-ww)
1 In AOC Inland Winter 0.7 M 830 81.5 0.6 197 9 0.03 0.1 0.07
3 Out AOC Inland Winter 0.7 M 862 72.8 1.5 212 12 4.8 BDL 0.04
5 Out AOC Inland Winter 0.7 M 846 48.1 0.7 224 10 BDL BDL 0.12
10 Out AOC Inland Winter ND M 652 53.2 0.9 233 8 0.4 0.01 0.40
11 Out AOC Inland Winter 0.7 M 879 63.0 1.1 652 28 BDL BDL 0.07
14 Out AOC Inland Winter 0.7 M 642 75.0 1.4 104 7 AE 0.03 0.01
17 In AOC Lakeshore Winter ND M 815 52.5 4.4 100838 5871 339 21.3 1.55
20 In AOC Lakeshore Winter ND M 996 83.2 2.8 864 86 BDL BDL BDL
21 In AOC Lakeshore Winter 2.7 F 453 41.8 5.5 2918 682 AE 3.5 0.37
22 In AOC Lakeshore Winter 0.7 M 967 76.3 2.5 18659 2389 22.4 47.6 0.37
23 In AOC Inland Summer ND M 673 68.1 1.1 508 18 BDL BDL BDL
24 In AOC Inland Winter 0.6 M 734 53.5 1.6 300 27 3.0 0.6 0.05
30 Out AOC Inland Winter ND M 587 IT 1.6 IT 45 IT BDL NA
31 Out AOC Inland Winter 1.6 M 642 76.9 2.5 543 31 2.7 BDL 0.27
32 Out AOC Inland Winter 3.6 M 575 68.8 0.9 705 14 5.8 BDL 0.19
33 Out AOC Inland Winter 0.6 F 351 IT 0.6 IT 19 1.6 BDL 0.25
34 Out AOC Inland Winter 0.6 F 485 69.9 1.3 424 32 14.9 0.8 0.39
38 In AOC Lakeshore Winter 1.7 F 635 79.7 1.3 4593 214 10.8 0.3 0.25
39 In AOC Lakeshore Winter ND M 681 68.8 2.2 515 35 1.2 1.2 0.09
41 In AOC Lakeshore Winter ND M 578 32.6 2.7 378 32 3.6 BDL 0.11
43 In AOC Inland Winter 3.7 M 930 79.8 1.5 469 30 1.6 0.1 0.04
44 In AOC Inland Winter 3.7 M 879 51.8 1.0 415 13 0.3 0.01 0.03
45 In AOC Inland Winter 3.7 M 555 48.8 2.0 505 29 3.2 BDL 0.30
47 Out AOC Lakeshore Winter 2.7 M 742 84.6 1.2 1238 43 9.4 1.0 0.12
48 Out AOC Lakeshore Winter ND M 651 42.9 2.2 2360 185 BDL BDL BDL
49 Out AOC Lakeshore Winter ND M 704 40.0 1.2 11653 755 38.3 31.8 0.30
50 Out AOC Lakeshore Winter ND M 1013 60.0 1.3 4373 171 9.2 0.2 0.13
51 Out AOC Lakeshore Winter 3.8 M 1111 68.6 1.4 4778 411 30.1 BDL 0.29
52 Out AOC Lakeshore Winter 1.7 M 916 70.2 1.4 1419 69 5.4 BDL 0.28
53 Out AOC Lakeshore Winter 0.6 M 619 56.6 0.9 232 14 5.3 0.9 0.12
54 Out AOC Lakeshore Spring 3.0 M 995 77.1 0.7 2783 67 3.5 BDL 0.50
55 Out AOC Lakeshore Winter ND M 1039 71.6 2.0 4797 360 18.0 BDL 0.43
56 In AOC Lakeshore Winter 1.0 F 456 69.6 0.8 525 15 7.7 BDL 0.21
57 In AOC Lakeshore Winter 2.7 F 361 64.3 1.7 4642 153 10.2 BDL 0.35
58 In AOC Lakeshore Winter 0.9 M 766 79.5 2.3 2170 96 16.1 BDL 0.50
59 In AOC Inland Winter 3.7 M 983 60.5 0.5 316 11 3.4 BDL 0.06
61 In AOC Inland Winter 4.8 M 695 64.3 2.5 1615 64 9.0 BDL 0.13
62 In AOC Inland Spring ND M 560 53.1 1.7 5010 250 12.6 4.2 0.46
63 In AOC Inland Spring 1.0 M 863 38.2 2.7 7465 554 9.1 BDL 0.34
a ND = no data
bbody weight without tail and skin which add an average of 18% to body weight
c
IT = insufficient adipose tissue for analysis d
BDL = below detection limit e
AE = analytical error fNA = not analyzed