Nils Holinski, Clemens Kool, Joan Muysken
Taking Home Bias Seriously: Absolute
and Relative Measures Explaining
Consumption Risk-Sharing
RM/09/035
Taking Home Bias Seriously: Absolute and Relative Measures
Explaining Consumption Risk-Sharing
Nils Holinskia,∗, Clemens Koolb, Joan Muyskena
aDepartment of Economics, Maastricht University, PO BOX 616, 6200 MD Maastricht, The Netherlands b
Utrecht School of Economics, Janskerkhof 12, 3512 BL Utrecht, The Netherlands
July 24, 2009
Abstract
Recent empirical work has shown that ongoing international financial integration
facili-tates cross-country consumption risk-sharing. While these studies typically employ absolute
measures to account for a country’s integration in international capital markets, we
de-vise a relative measure that is motivated by the International Capital Asset Pricing Model
(I-CAPM) literature. Our measure captures the composition of a country’s international
portfolio relative to the world portfolio, which all countries should optimally hold according
to the I-CAPM. Using panel-data regression for a group of OECD countries during the
finan-cial globalization period 1980-2007, we show that the geography of international portfolios
helps to explain the degree of consumption risk-sharing obtained.
JEL Classification: F36, F41, G15
Keywords: international financial integration, geography of international invest-ment, consumption risk-sharing, international portfolio diversification
∗
Corresponding author: Department of Economics, Maastricht University, PO Box 616, MD 6200 Maastricht, The Netherlands. Tel:+31 433883653, Fax: +31 43 3884864,E-mail: [email protected]
1
Introduction
International financial integration has increased the investment opportunity set of financial in-vestors fundamentally. Inin-vestors are no longer bound to domestic markets, but have access to international capital markets that allow a better hedging of their investment portfolios. Lane and Milesi-Ferretti (2001, 2003, 2006) show in a series of seminal papers that gross foreign asset and liability positions as a fraction of GDP for a group of OECD countries have grown almost fivefold over the past two decades and the composition of international balance sheets in terms of geographical allocation and currency denomination is highly heterogeneous.
This paper explores the extent to which financial integration allows individuals to better hedge consumption risk across countries and over time. In answering this question we introduce a novel idea and view the geography of international portfolio investment as a decisive determinant. Recent empirical research accumulates evidence on the outstanding role of foreign portfolio investment for international consumption risk-sharing (most notably Bracke and Schmitz, 2007, Fratzscher and Imbs, 2007, Sørensen et al., 2007, Artis and Hoffmann, 2008). These studies have in common that they all employ absolute measures to account for a country’s integration in world capital markets. By emphasizing geographical diversification, we are the first to
ac-count for absoluteand relative home bias in asset holdings. For a group of 23 OECD countries
during the financial globalization period 1980-2007, we develop three measures that account for a country’s overall portfolio equity wealth, its decomposition into domestic and foreign portfo-lio equity components and the degree of international diversification of the foreign component. These measures are consecutively included in a single panel regression framework. We begin by showing that the amount of a country’s overall portfolio equity wealth matters for the degree of consumption risk-sharing obtained. Next we add the measure that accounts for the decomposi-tion of a country’s portfolio equity wealth into domestic and foreign portfolio equity components and find that conditional on a country’s wealth its decomposition is equally relevant. The joint inclusion of these two determinants is novel, yet important. It allows studying their individual contributions to the amount of consumption risk that is shared. After all, a country with biased but large overall portfolio equity wealth is more likely to secure some risk-sharing relative to a country with tiny if unbiased overall portfolio equity wealth. Finally, the first two measures prepare the ground for the inclusion of our novel determinant - the geography of international
portfolio equity investment. Conditional on a country’s overall portfolio equity wealth and its decomposition into domestic and foreign components, we show that the diversification of the for-eign component in geographically relevant markets bears additional relevance for consumption risk-sharing.
Conceptually, the derivation of our three measures builds on macroeconomic research into consumption home bias and financial research into asset home bias. The former concerns the correlation of consumption growth rates across countries. Models of complete international financial markets (Obstfeld and Rogoff, 1996 or LeRoy and Werner, 2001) show how financial integration allows decoupling any idiosyncratic shock to domestic output from consumption decisions. In these models, countries can buy insurance against all future states of domestic output and thereby shield their income, and hence consumption, from fluctuations. If domestic output growth is outperfoming a world average, the insurance asks for premium payments, while it pays out in the reverse case. The insurance scheme is realized by cross-border trade in assets that constitute perpetual claims to each country’s output stream. In our empirical analysis, a country’s overall portfolio equity wealth aims at capturing the degree of financial market completeness. The measure is expressed relative to GDP.
Financial research into asset home bias centers around the theoretical predictions of the International Capital Asset Pricing model (I-CAPM) which holds in a fully integrated world
as the international version of Sharpe’s CAPM (Solnik, 1974). The I-CAPM predicts that
investors maximize their risk-return trade-off by investing in identical international portfolios, which resemble the world portfolio. If not, they display so-called home bias. In our empirical analysis, we capture the idea of asset home bias with two measures.
First, we define an absolute home bias measure that splits each country’s equity portfolio wealth into a domestic and foreign component. Their relative size is then compared to the size
as implied by the I-CAPM, e.g. the relative size of the domestic equity market vis-`a-vis the rest
of the world (ROW). The absolute home bias measure is standard by now in empirical work. It was first developed by French and Poterba (1991) and subsequently applied, for instance, by Sørensen et al. (2007) and Bracke and Schmitz (2007).
Our second measure is novel. Next to the broad distinction between domestic and foreign
the international component of a country’s portfolio equity wealth. Again, the predictions of the I-CAPM provide guidance in developing the measure. Research into the geography of foreign
portfolio investment (inter alia Portes and Rey, 2005, De Santis, 2006, Lane and Milesi-Ferretti,
2008) has established a distance puzzle - the general tendency of countries to refrain from in-vesting in remote destinations. Instead, countries prefer geographical proximity for their foreign investments, where cultural ties are strongest and information asymmetries lowest. Considering these findings, we entertain the strong suspicion that diversification in geographically relevant portfolios is equally important in unlocking the potential for consumption risk-sharing as inter-national portfolio investment itself. We expect, for instance, that in 2005 Ireland’s substantial 19.68% of foreign portfolio equity invested in the UK or Portugal’s 21.99% invested in Spain provide less consumption risk-sharing than if the same shares were invested in a world portfolio. We elaborate that notion in this paper.
The rest of the paper is organized as follows. Section 2 reviews two important branches of literature that are relevant for our study. Section 3 details the data sources, elaborates on the construction of our absolute and relative home bias measures and provides a first inspection. In Section 4, we carry out the empirical analysis and present our results. Section 5 concludes.
2
Literature review
Our paper is relevant to at least two strands of literature. It contributes to the discussion of the traditional consumption home bias literature as well as the more recent literature on the geography of international investment. Reviewing both strands provides motivation for our own approach.
Empirical studies on consumption home bias test the hypothesis that in the presence of complete financial markets, marginal utility growth is equated and consumption growth rates highly correlated across countries. Early research into correlation patterns points at the absence
of international consumption risk-sharing - an empirical anomaly known as the consumption
correlation puzzle or quantity anomaly (notably Backus et al., 1992, Obstfeld, 1994, 1995, and
Lewis, 1999).1 More recently, studies of international consumption risk-sharing interpret the
1To reconcile empirical findings with theory, the benchmark model of perfect risk-sharing has been amended in several respects: (1) tradable versus nontradable goods (Lewis, 1996, 1999, Stockmann and Tesar, 1995, (2) market incompleteness (Kollmann, 1995, Shiller, 1993, Lewis, 1996), (3) transaction costs (Obstfeld, 2001). For
hypothesis of perfect risk-sharing differently and seek to assess if consumption growth rates re-spond uniformly to aggregate, but not to country-specific output growth (Mace, 1991, Cochrane,
1991, Asdrubali et al., 1996, Sørensen and Yosha, 1998, M´elitz and Zumer, 1999, Becker and
Hoffmann, 2006). This strand of empirical research takes the form of regression analysis, where perfect consumption risk-sharing is tested under the null hypothesis. Standard, by now, are regressions of idiosyncratic consumption growth on idiosyncratic output growth, where under
the null hypothesis theβ-coefficient is statistically indiscernible from zero, or else, can be read
as the percentage deviation from the perfect risk-sharing case. Empirical results, to the extent that they coincide with the period of financial globalization, draw a more favorable picture, even though the lack of international consumption risk-sharing remains sizeable.
From here, empirical research directs its attention to the various channels through which consumption risk is shared and links it empirically to proceeding financial integration. Sørensen et al. (2007) document for a group of OECD countries a marked increase in international income and consumption risk-sharing associated with high levels of foreign portfolio equity and foreign direct investment. Fratzscher and Imbs (2007) extend the analysis to a bilateral context and confirm that intensity and composition (in terms of asset classes) of foreign assets are decisive determinants for the degree of risk-sharing between two countries. Kose et al. (2007) are most concerned with the apparent failure of developing countries to share in the benefits of financial integration. With a number of measures for financial openness (e.g. gross stocks and flows of foreign assets), they show that industrial countries are the main beneficiaries. Bracke and Schmitz (2007) refine the analysis by constructing a comprehensive dataset on capital gains on international portfolio equity holdings. They find that net foreign capital gains act in a countercyclical way and thus offer the desired insurance potential. The potential for risk-sharing is found to be increasing since the mid-1990s for industrial countries, while absent in emerging market economies.
Artis and Hoffmann (2008) introduce a new aspect to the discussion - the time profile of consumption risk-sharing. They point out that consumption risk-sharing is a function of the structure of business cycles and that regression results are blurred by concurrent changes in them across countries. They account for transitory and persistent shocks to output and find
that OECD countries are better able to insure against the former than the latter.
Our paper ties in with the more recent empirical literature that accumulates evidence on the outstanding role of foreign portfolio investment for international consumption-risk sharing. Our novel contribution to the literature is the examination of the geography of foreign portfolio investment for international consumption risk-sharing.
Drawing on the gravity model literature for international trade in goods, Lane and Milesi-Ferretti (2008) test an array of bilateral, host and source country characteristics to explain the structure of external equity portfolios for the year 2001. They show that underlying trade in goods and cultural and physical proximity are the key correlates for bilateral foreign equity holdings, e.g. all else equal, doubling physical distance reduces equity holdings by 61%. This constitutes a puzzle since investors should shift their portfolios to remote countries, as those countries usually provide better diversification potential due to less synchronous business cy-cles. Instead, Lane and Milesi-Ferretti (2008) find that investors seem to forego this potential by holding equity in destinations with similar business cycles (as measured by the correlation coefficient of GDP growth rates). Portes and Rey (2005) also build on gravity models and find that they perform at least as well in explaining asset trade as goods trade. According to their study, the size of asset markets in host and source countries, next to informational asymmetries, are the main determinants of gross transaction flows. They confirm the distance puzzle, but view distance as a proxy for informational asymmetries. Aviat and Coeurdacier (2007) directly address the study by Portes and Rey (2005) and find, not surprisingly, that the distance puzzle is drastically reduced once trade in goods is controlled for. They employ a simultaneous gravity equations framework and point out the complementarity of trade in goods and assets, e.g. all else equal, a 10% increase in bilateral goods trade raises bilateral asset holdings by 6% to 7%. The study by De Santis (2006) comes closest to ours by testing if investors trade assets as to reduce deviations from I-CAPM implied portfolio weights. The results are mixed. While bond flows seem to obey such diversification motives, they are absent for trade in portfolio equity.
3
Data sources and home bias measures
Our dataset comprises 23 OECD countries with annual data between 1980 and 2007. Data on GDP and private and public consumption are taken from the OECD Annual National Accounts
database and are expressed in US-$ at constant prices with base year 2000. To obtainper capita
estimates, population data from the same source are used. In our study, we concentrate on country idiosyncratic shocks and thus define variables relative to a worldwide aggregate, which is approximated as the weighted sum of our sampled countries. Data for our portfolio equity wealth measure and the home bias measures are taken from various sources, including the International Monetary Fund’s Coordinated Portfolio Investment Survey (CPIS) and International Financial Statistics (IFS), Datastream and the External Wealth of Nations Mark II (EWN II) dataset compiled by Lane and Milesi-Ferretti (2007).
A number of influential studies have documented the tremendous growth in portfolio equity wealth owing to rapidly expanding equity markets over the past two decades. We define the measure of overall portfolio equity wealth as
P EWi,t =
M CAPi,t+F Ai,t−F Li,t
GDPi,t
(1)
whereM CAPi,t is the equity market capitalization of countryi,F Ai,t and F Li,t are countryi’s
foreign asset and foreign liability holdings in portfolio equity, respectively. Data forM CAPi,t
are retrieved from Datastream, andF Ai,t and F Li,t are taken from the EWN II database and
carefully updated with IFS data for recent years. The first two columns of Table 1 show the portfolio equity wealth measures for the years 1990 and 2005. Two characteristics stand out. The wealth measures, and therefore the potential for risk insurance, vary hugely across country, but are uniformly increasing over time. Countries like Mexico, Portugal and Greece with less mature and deep financial markets stand opposite to countries like Switzerland, the UK and Sweden with overall portfolio equity wealth positions exceeding GDP.
The past two decades not only experienced a pronounced increase in overall portfolio equity wealth, but also a concomitant decline in equity home bias (French and Poterba, 1991, Bracke and Schmitz, 2007, Sørensen et al., 2007). These studies define measures of equity home bias in an absolute way as
abs. EHBi,t = 1−
F Ai,t
P EWi,tGDPi,t
1− M CAPi,t
M CAPw,t
(2)
whereF Ai,t,P EWi,tandM CAPi,tare defined above andM CAPw,tis worldwide equity market
concept of our measure for overall portfolio equity wealth. This will ensure consistency in our empirical study. The absolute EHB measures, defined this way, take on values between zero and one. A value of zero implies the absence of equity home bias; the share of domestic equity in the investment portfolio is consistent with the relative size of the domestic to the world equity market. In contrast, a value of one implies that a country is exclusively invested at home.
Columns three and four of Table 1 show the absolute home bias measures for the years 1990 and 2005. It is apparent that financial globalization has changed the structure of portfolio equity wealth positions since its onset in the mid-1980s. All EHB coefficients, with the exception of Belgium and Mexico, are falling and it is not surprising that many small open economies like Austria, Norway, and foremost, the Netherlands lead the ranks of the most financially integrated
economies. Nonetheless, an average coefficient of 0.56 for 2005 shows that investors’ preferences
are still tilted toward domestic portfolio equity and market integration remains far from perfect.
[Table 1 about here.]
Next we define our relative EHB measure that assesses the geography of the international component of a country’s portfolio equity wealth by comparing it to an empirical proxy of the world portfolio. The CPIS provides such information for the years from 2001 to 2007. It is the first and unique survey of its kind that records foreign portfolio equity and debt investment holdings for around 70 source and 240 host countries in a comprehensive and consistent way. For our sample of 23 OECD countries, we are considering foreign portfolio equity holdings in 33 host countries - covering the destinations of about 98% of total foreign portfolio equity investments.
The remainder is accounted for and grouped asROW.
First we compute country individual world portfolios (W Pi) as column vectors, where each
entrywpij,tdenotes the relative equity market size of our 33 considered host countries plus the
remainder grouped asROW:
W Pi,t =
M CAP1,t
M CAPw,t−M CAPi,t
, . . . , M CAP33,t M CAPw,t−M CAPi,t
, M CAPROW,t M CAPw,t−M CAPi,t
0 . (3)
Next we determine the actual allocation of the international component of a country’s portfolio
equity wealth (IP EWi,t) according to theCPIS data and obtain a column vector, where each
ROW: IP EWi,t = F E1,t T F Ei,t , . . . , F E33,t T F Ei,t ,F EROW,t T F Ei,t 0 . (4)
F Ej,t is foreign portfolio equity held in host country j and T F Ei,t is total foreign portfolio
equity of countryi.2 Finally, we determine absolute over- and under-investments according to
the international CAPM and sum them over all 33 host countries andROW:
rel. EHBi,t =
1 2
33+1
X
j=1
|wpij,t−ipewij,t|. (5)
The relative home bias measure as defined in Eq. (5) is bounded between zero and one. A value of zero implies that a country’s international portfolio is a one-to-one replicate of the world portfolio, whereas the measure approaches one, the more idiosyncratic a country’s investment strategy becomes. The right panel of Table 1 reports the relative EHB of all countries in our sample for the years 2001 to 2007. A number of characteristics are worth mentioning. They are important for the application of the relative EHB measure in our empirical study that fol-lows. First, we observe a high dispersion of relative EHB measures across countries with many countries joining the ranks of Japan (e.g. Canada, the Netherlands) and Italy (e.g Belgium, Portugal) - our polar cases with average measures of 0.12 and 0.63, respectively. The high dis-persion across countries is also reflected in the standard deviation of the relative EHB measure. It varies between 0.15 and 0.18 for the years 2001 to 2007. Second, the relative EHB measures for each country appear to be time invariant. This can be seen from the standard deviations in the last column of Table 1, which only range from 0.01 to 0.06. Moreover an ANOVA test
fails to reject the null hypothesis of time invariant average relative EHB measures.3 The time
invariance of the relative EHB measure is further supported by the literature on the geography of international portfolio investment which find that cultural and physical proximity are key cor-relates, both being time invariant (Portes and Rey, 2005, Lane and Miles-Ferretti, 2008). Third, we notice a remarkable pattern across countries that is of interest from an institutional point of view. Most Scandinavian and Anglo-Saxon countries, but also Japan and the Netherlands, do better in diversifying their foreign portfolio equity - their relative EHB measures are mostly
2
Note that total foreign portfolio equity,F Ai,t, in (1) and (2) is quantitatively not the same as total foreign
portfolio equityT F Ei,t, in (4). The former is sourced from IFS and EWN II databases, while the latter uses data
from the CPIS.
below the overall average of 0.39.
4
Consumption risk-sharing
Our estimation strategy proceeds in several steps. All estimations are carried out for two time horizons, the entire time period 1980-2007 and the more recent subperiod 1990-2007. It is often argued that cross-border portfolio investment accelerated only in the 1990s such that assuming a stable relationship back to 1980 is not warranted. Estimation results for both periods provide
further insights.4 Moreover we understand consumption as either private consumption or the
sum of private and public consumption as defined by the OECD Annual National Accounts database. Testing both consumption definitions is our answer to the dichotomy in past research. In addition, it serves as a robustness check for our own results and allows drawing conclusions about the role that governments play in smoothing consumption. We start with panel-data regressions of the form
∆logCit−∆logCt=α+β(∆logGDPit−∆logGDPt) +υit (6)
where the disturbance υit is specified as the one-way error component model with a
country-specific effect and a stochastic error term.5 Theβ-coefficient measures the co-movement between
idiosyncratic GDP and idiosyncratic consumption. Considering idiosyncratic variables is nec-essary in our analysis as even in the perfect risk-sharing case individuals cannot insure against fluctuations in aggregate output. In the perfect risk-sharing case the coefficient is equal to zero such that consumption decisions are decoupled from current output levels.
Next, we allow for slope heterogeneity by consecutively augmenting theβ-coefficient in Eq.
(6) with interaction terms. We start with the measure for portfolio equity wealth by imposing the following structure
β=β0+β1(P EWit−P EW) (7)
where the measure enters in deviation to an (un-weighted) average across countries and time to ease the interpretation. A country with an average overall portfolio equity wealth position
4
Estimation results for the earlier subperiod 1980-1989 are available from the authors upon request. They are not central for our analysis and have been omitted for expositional matters.
5
will experience consumption risk-sharing according to the coefficient β0. Since the portfolio
equity wealth measure captures a country’s degree of financial market completeness, we expect
the coefficient β1 to be negative. The size of the overall portfolio equity wealth is assumed
to matter, regardless whether it is invested domestically or abroad. Both investments provide consumption risk insurance.
Next, we further augment the coefficient structure in Eq. (7) by adding the measure for absolute EHB. We obtain
β=β0+β1(P EWit−P EW) +β2(abs.EHBit−abs.EHB). (8)
with an absolute EHB measure in deviation to an (un-weighted) average across countries and time. The inclusion of a volume-based wealth measure and its decomposition into domestic and foreign components in a single consumption risk-sharing regression is novel. Past research employed either volume-based measures of different classes of foreign asset and liability holdings (Sørensen et al., 2007, Kose et al., 2007, Fratzscher and Imbs, 2007, Bracke and Schmitz, 2007) or decomposition measures like our absolute EHB measure (French and Poterba, 1991, Sørensen et al., 2007). We argue that only the joint inclusion in a consumption risk-sharing framework is
able to single out theceteris paribus contributions of the two measures. We expectβ2 to have a
positive sign. That is consumption risk-sharing is reduced (for a given level of portfolio equity wealth) if countries exhibit above-average equity home bias measures.
Finally, we test our initial suspicion that diversification of international portfolio equity wealth is a decisive determinant of consumption risk-sharing. Many authors have pointed at the potential role of investment geography, yet we are the first to substantiate the assertion by imposing
β =β0+β1(P EWit−P EW) +β2(abs.EHBit−abs.EHB) +β3(rel.EHBi−rel.EHB) (9)
on the consumption risk-sharing coefficientβ.6 The use of our relative EHB measures is driven
by the availability of the underlying data. Since information on the geography of portfolio investment is only available for the years 2001 to 2007, we focus on the cross-country dimension
6
See for instance Lane and Milesi-Ferretti (2008) ”[...], the geography of investment positions also heavily shapes international risk-sharing patterns.”
and work with time invariant measures. They are obtained as averages over the period 2001-2007. This is a limitation of our study, but evidence in Table 1 suggests that most information in the relative EHB measures stem from the cross-country dimension and a time-invariant treatment is warranted. Again we employ the relative home bias measures as deviation from cross-country
averages and expect the corresponding coefficient β3 to have a positive sign, i.e. for a given
level of portfolio equity wealth and a given share invested abroad countries that pursue a more idiosyncratic international investment strategy will experience less consumption risk-sharing.
[Table 2 about here.]
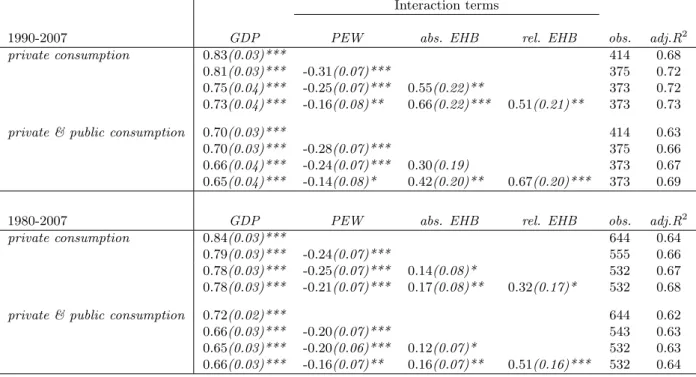
Table 2 presents our results. The upper panel gives the regression results for the more recent subperiod 1990-2007 and the lower panel for the entire data period 1980-2007, respectively. Our results for the standard risk-sharing regressions in Eq. (6) confirm past research. We find values
for the β-coefficient that are high and significantly different from zero. Considering the recent
data period, we obtain a value of 0.83 for the narrow definition of consumption, suggesting that
consumption risk-sharing is far from perfect. The value of theβ-coefficient is lower (0.70), when
we consider the sum of public and private consumption in our regressions. Governments use fiscal policies to contribute to smoothing of overall consumption. Considering the entire data period, we find consumption risk-sharing to be marginally lower for both the narrow and broad consumption definitions.
All coefficients of the portfolio equity wealth and absolute and relative home bias measures enter with correct signs and are statistically significant at the conventional levels. It is remark-able to note that the magnitude and statistical significance of the coefficients of the individual interaction terms remain relatively stable as we proceed in our estimations from Eq. (7) to Eq. (9). We interpret this as evidence that all three measures convey distinct information about a country’s ability to share in consumption risk. It proves, in particular, our earlier suspicion that the geography of international investment conveys information in explaining consumption risk-sharing that is distinct from information about the absolute integration in international financial markets. Comparing both time periods and consumption definitions, we notice the increased importance of relative and absolute EHB in explaining consumption risk-sharing in the more recent subperiod for the narrow consumption definition. In Eq. (9) and for private
to 0.51, respectively. Moreover, absolute and relative EHB measures provide more precise in-formation for consumption risk-sharing as their increased statistical significance and a higher adjusted-R2 level indicate.
An obvious limitation of our study is the time-invariant inclusion of the relative EHB measure in the regression framework above. Given that data on the geography of portfolio investment are only available for recent years, we believe that Table 1 provides convincing evidence that most information is contained in the cross-section of the data and a time-invariant treatment is warranted for the time being. A final conclusions about the role of international diversifica-tion for consumpdiversifica-tion risk-sharing can only be drawn once data over a longer time horizon are available. To further verify that the results obtained from time-invariant relative EHB measures are credible, we also examine their time-varying treatment by estimating all regressions over the time period 2001-2007. We find that all three measures exhibit individually the correct sign and are statistically significant at conventional levels. However their joint inclusion leads to diminishing statistical significance, which we attribute to the limited number of observations over the reduced time period. They are insufficient to discriminate the idiosyncratic effects of all three measures on consumption risk-sharing.
5
Conclusion
The main goal of this paper is the inclusion of the geography of international portfolio holdings into the discussion of international consumption risk-sharing. Many authors have pointed at the potential role of investment geography, but, to our knowledge, we are the first to empirically test the assertion and take it to the data. In this respect, our paper brings together the literature on the geography of portfolio investments and international consumption risk-sharing. We find that asymmetries in international portfolio investment positions are reflected in the ability of economies to share in consumption risk via international financial markets. This holds true even after controlling for a country’s overall portfolio equity wealth position and its absolute integra-tion in internaintegra-tional financial markets. Hence, we argue that there are conceptually two different channels through which financial integration enhances consumption risk-sharing: the first con-cerns the question of how much is being invested abroad, while the second channel recognizes the destinations of international portfolio investments. The first channel is well-documented in
the literature, whereas the second needs further investigations in the future once more data are available. Our relative home bias measures is a first innovation in this direction and shows that it is an important research avenue. Addressing both channels jointly, helps us in understanding the degree of consumption risk-sharing obtained.
References
Artis, M., Hoffmann, M., 2008. Financial Globalization, International Business Cycles, and Consumption Risk Sharing. Scandinavian Journal of Economics 110 (3), 447-471.
Asdrubal, P., Sørensen, B., and Yosha, O., 1996. Channels of Interstate Risk Sharing: United States: 1963-1990. The Quarterly Journal of Economics 111, 1081-1110.
Aviat, A., Coeurdacier, N., 2007. The Geography of Trade in Goods and Asset Holdings. Jour-nal of InternatioJour-nal Economics 71, 22-51.
Backus, D., Kehoe, P., and Kydland, F., 1992. International Real Business Cycles. The Journal of Political Economy 100, 745-775.
Becker, S., Hoffmann, M., 2006. Intra- and International Risk-Sharing in the Short Run and the Long Run. European Economic Review 50, 777-806.
Bracke, T., Schmitz, M., 2007. Channels of International Risk-Sharing: Capital Gains versus Income Flows. ECB Working Paper Series 938.
Cochrane, J., 1991. A Simple Test of Consumption Insurance. The Journal of Political Economy 99, 957-976.
the Role of Monetary Policy Frameworks. ECB Working Paper Series 678.
Fratzscher, M., Imbs, J., 2007. Risk Sharing, Finance and Institutions in International Portfo-lios. Journal of Financial Economics, forthcoming.
French, K., Poterba, J., 1991. Investor Diversification and International Equity Markets. Amer-ican Economic Review 81, 222-226.
Kollmann, R., 1995. Consumption, Real Exchange Rates and the Structure of International Asset Markets. Journal of International Money and Finance 14, 191-211.
Kose, M., Prasad, E., and Terrones, M., 2007. How Does Financial Globalization Affect Risk-Sharing? Patterns and Channels. IMF Working Paper 238.
Lane, P., Milesi-Ferretti, G.M., 2001. The External Wealth of Nations: Measures of Foreign As-sets and Liabilities for Industrial and Developing Nations. Journal of International Economics 55, 263-294.
Lane, P., Milesi-Ferretti, G., 2003. International Financial Integration. International Monetary Fund Staff Paper.
Lane, P., Milesi-Ferretti, G., 2007. The External Wealth of Nations Mark II: Revised and Extended Estimates of Foreign Assets and Liabilities, 1970-2004. Journal of International Eco-nomics 73, 223-250.
Lane, P., Milesi-Ferretti, G.M., 2008. International Investment Patterns. The Review of Eco-nomics and Statistics 90 (03), 538-549.
Lewis, K., 1996. What can Explain the Apparent Lack of International Consumption Risk-Sharing?. The Journal of Political Economy 99, 267-287.
Lewis, K., 1999. Trying to Explain Home Bias in Equities and Consumption. Journal of Eco-nomic Literature XXXVII, 571-608.
Mace, B., 1991. Full Insurance in the Presence of Aggregate Uncertainty. The Journal of Polit-ical Economy 99, 928-956.
M´elitz, J., Zumer, F., 1999. Interegional and International Risk-Sharing and Lessons for EMU.
Carnegie-Rochester Conference Series on Public Policy 51, 149-188.
Obstfeld, M., 1994. Are Industrial-Country Consumption Risks Globally Diversified?, in Lei-derman, L., Razin, A. (Eds.), Capital Mobility: The Impact of Consumption, Investment and Growth. Cambridge University Press.
Obstfeld, M., 1995. International Capital Mobility in the 1990s, in Kenen, P.B. (Ed.), Under-standing Interdependence. Princeton University Press.
Obstfeld, M., 2001. The Six Major Puzzles in International Macroeconomics Solved. NBER Macroeconomics Annual 2000 15, 339-390.
Obstfeld, M., Rogoff, K., 1996. Foundations of International Macroeconomics. MIT Press, Cambridge.
Portes, R., Rey, H., 2005. The Determinants of Cross-Border Equity Flows. Journal of Interna-tional Economics 65, 269-296.
Shiller, R., 1993. Macro Markets: Creating Institutions for Managing Society’s Largest Eco-nomic Risks. Oxford University Press.
Solnik, B., 1974. An Equilibrium Model of the International Capital Markets. Journal of Eco-nomic Theory 8, 500-524.
Sørensen, B., Wu, Y.-T., and Zhu, Y., 2007. Home Bias and International Risk Sharing: Twin Puzzles Separated at Birth. Journal of International Money and Finance 26, 587-605.
Sørensen, B., Yosha, O., 1998. International Risk Sharing and European Monetary Unification. Journal of International Economics 45, 211-238.
Stockmann, A., Tesar, L., 1995. Tastes and Technology in a Two-Country Model of the Business Cycle: Explaining International Comovements. American Economic Review 85, 168-185.
T able 1: Absolute and Relativ e Equit y Home Bias PEW absolute EHB relativ e EHB Coun try 1990 2005 1990 2005 2001 2002 200 3 2004 2005 2006 2007 A V G STD Australia 0.18 0.96 0.82 0.78 0.18 0.22 0.17 0.22 0.28 0.30 0.29 0.24 0.05 Austria 0.09 0.39 0.80 0.35 0.44 0.44 0.47 0.50 0.51 0.52 0.53 0.49 0.04 Belgium 0.31 1.35 0.51 0.51 0.63 0.61 0.64 0.66 0.65 0.62 0.61 0.63 0.02 Canada 0.26 1.06 0.68 0.60 0.13 0.13 0.11 0.13 0.13 0.16 0.17 0.14 0.02 Denmark 0.20 1.14 0.80 0.52 0.30 0.29 0.29 0.28 0.25 0.26 0.26 0.28 0.02 Finland 0.10 0.77 0.98 0.44 0.46 0.49 0.51 0.53 0.49 0.48 0.49 0.49 0.0 2 F rance 0.15 0.77 0.79 0.57 0.47 0.48 0.49 0.52 0.47 0.48 0.50 0.49 0.0 2 German y 0.16 0.64 0.83 0.41 0.51 0.52 0.53 0.56 0.56 0.51 0.52 0.53 0.02 Greece 0.05 0.29 0.95 0.89 0.51 0.43 0.44 0.47 0.47 0.48 0.53 0.48 0.03 Iceland -0.44 0.45 0.51 0.47 0.59 0.59 0.51 0.51 0.06 Ireland -0.27 0.29 0.27 0.27 0.25 0.28 0.28 0.27 0.01 Italy 0.11 0.62 0.83 0.54 0.61 0.58 0.59 0.62 0.62 0.69 0.71 0.63 0.05 Japan 0.93 0.79 0.96 0.83 0.10 0.12 0.10 0.13 0.13 0.14 0.13 0.12 0.02 Mexico 0.01 0.07 0.65 0.82 -0.51 0.53 0.56 0.59 0.55 0.04 Netherlands 0.27 1.13 0.64 0.14 0.21 0.20 0.17 0.15 0.13 0.20 0.19 0.18 0.03 New Zea land 0.07 0.51 0.86 0.56 0.22 0.33 0.3 5 0.33 0.32 -0.31 0.05 Norw a y 0.09 1.16 0.76 0.40 0.27 0.30 0.26 0.24 0.21 0.24 0.22 0.25 0.03 P ortugal 0.04 0.21 0.86 0.52 0.58 0.60 0.60 0.63 0.62 0.62 0.60 0.6 1 0.02 Spain 0.10 0.54 0.95 0.73 0.49 0.57 0.57 0.58 0.59 0.62 0.59 0.57 0.04 Sw eden 0.17 1.39 0.70 0.47 0.28 0.31 0.31 0.32 0.33 0.32 0.37 0.32 0.0 3 Switzerland 0.20 2.61 -0.47 0.53 0.53 0.54 0.63 0.52 0.52 0.54 0.54 0.04 United Kingd om 0. 52 1.57 0.66 0.57 0.38 0.29 0.29 0.32 0.27 0. 22 0.24 0.29 0.05 United St ates 0.29 1.28 0.86 0.59 0.25 0.21 0.20 0.20 0.19 0.19 0.19 0.20 0.02 A V G 0.20 0.92 0.80 0.56 0.38 0.38 0.38 0 .40 0.40 0.41 0.41 0.39 -STD 0.20 0.57 0.12 0.18 0.16 0.15 0.17 0 .18 0.18 0.18 0.18 -0.17
Table 2: Consumption Risk-Sharing
Interaction terms
1990-2007 GDP PEW abs. EHB rel. EHB obs. adj.R2
private consumption 0.83(0.03)*** 414 0.68
0.81(0.03)*** -0.31(0.07)*** 375 0.72
0.75(0.04)*** -0.25(0.07)*** 0.55(0.22)** 373 0.72
0.73(0.04)*** -0.16(0.08)** 0.66(0.22)*** 0.51(0.21)** 373 0.73
private & public consumption 0.70(0.03)*** 414 0.63
0.70(0.03)*** -0.28(0.07)*** 375 0.66
0.66(0.04)*** -0.24(0.07)*** 0.30(0.19) 373 0.67
0.65(0.04)*** -0.14(0.08)* 0.42(0.20)** 0.67(0.20)*** 373 0.69
1980-2007 GDP PEW abs. EHB rel. EHB obs. adj.R2
private consumption 0.84(0.03)*** 644 0.64
0.79(0.03)*** -0.24(0.07)*** 555 0.66
0.78(0.03)*** -0.25(0.07)*** 0.14(0.08)* 532 0.67
0.78(0.03)*** -0.21(0.07)*** 0.17(0.08)** 0.32(0.17)* 532 0.68
private & public consumption 0.72(0.02)*** 644 0.62
0.66(0.03)*** -0.20(0.07)*** 543 0.63
0.65(0.03)*** -0.20(0.06)*** 0.12(0.07)* 532 0.63
0.66(0.03)*** -0.16(0.07)** 0.16(0.07)** 0.51(0.16)*** 532 0.64
Notes:The dependent variable is idiosyncratic private or private and public consumption growth. The independent variables are idiosyncratic GDP growth (GDP) augmented with interaction terms of wealth (PEW), absolute equity home bias (abs. EHB) and relative equity home bias (rel. EHB). Estimations by weighted least squares. The corresponding standard errors are in parantheses, where ***, **, * denote significance at the 1, 5 and 10 percent level, respectively.