©
Copyright 2013 by Tatiana Chebonenko
All rights reserved
TEXTUAL ANALYSIS, INFORMATION DIFFUSION,
AND ASSET RETURNS
BY
TATIANA CHEBONENKO
DISSERTATION
Submitted in partial fulfillment of the requirements
for the degree of Doctor of Philosophy in Finance
in the Graduate College of the
University of Illinois at Urbana-Champaign, 2013
Abstract
The past decade has seen the rapid development of different techniques to retrieve
additional information from financial news. Various software and methods of news analytics are
used to quantify textual information. Text sentiment extracts text’s attitude by counting negative
words and has proved extremely useful in a variety of contexts. The literature interprets it in
three ways: quantitative information, soft news, and psychological sentiment. In the first chapter,
we use a quasi-natural experiment to show that text sentiment reflects primarily omitted
quantitative information and does not capture soft news or sentiment. We first extract text
sentiment from earnings call transcripts with dictionary and supervised-learning methods, and
then compare how it predicts returns during overnight and intraday calls; specifically, whether
text sentiment explains a larger portion of stock returns for overnight calls. The overnight and
intraday cases differ only in the timing of a quarterly report. Overnight calls are dominated by
quantitative news from a quarterly report, while the intraday cases contain mostly soft news and
sentiment. Text sentiment explains overnight returns well but fails to predict returns or volatility
during intraday calls. Thus, text sentiment reflects news only during periods dominated by
quantitative information.
Using textual analysis, the second chapter provides evidence that earnings announcements
contain mostly company-specific news and very little industry news. The main problem is how
to estimate the causal effect of an earnings announcement on firm and industry stock returns
given that many other factors could affect both returns. I address the identification problem by
directly measuring earnings news with text sentiment extracted from earnings call transcripts. I
find that text sentiment explains a large portion of announcer stock returns but very little of
industry returns during earnings announcements. The result is robust to alternative measures of
text sentiment and industry classification.
The third chapter finds that an earnings announcement emits information to option traders.
I use textual analysis to separate the earnings news flow to equity and option markets. Text
sentiment predicts stock price crash risk and volatility spike option estimates which illustrates
separate earnings information flow to the option traders. I find that firm size and analyst
coverage explain most of the predictability for volatility spikes. At the same time, text sentiment
proves to be useful in prediction of sudden drops in stock price.
Acknowledgments
My sincere gratitude goes to my advisor, Prachi Deuskar. This milestone in my life would
not be possible without her guidance, kind supervision and generous support. I am also very
grateful to Neil Pearson for his inspiring comments and suggestions that invariably strengthened
my work. I would also like to thank my committee members Scott Weisbenner and Vyacheslav
Fos for the friendly guidance and thought provoking suggestions that helped me to improve my
dissertation. I am very thankful for valuable discussions with Heitor Almeida and Ola Bengtsson
that guided my research.
I am thoroughly grateful to Bill Fearnley for his interest in my research topic. His
invaluable industry insight had a crucial effect on the final developments of my work.
I am very thankful to my husband and co-author of my first paper, Dmitriy Muravyev, for
his strong support and motivation. I benefited from our useful discussions during all phases of
my research.
Finally, I would like to thank my parents whose love, support and trust in me has made me
a stronger person.
Table of Contents
Chapter 1: What Does Text Sentiment Really Measure? Evidence from Earnings Calls...1
1.1 Introduction...1
1.2 Conceptual framework...4
1.3 Empirical test and hypothesis development...6
1.4 Data and sample construction...7
1.5 Text sentiment measures...8
1.6 Main results...9
1.7 Robustness tests...11
1.8 Volatility case study...12
1.9 Conclusion...13
1.10 Tables and Figures...15
Chapter 2: Do Earnings Announcements Contain Industry Information?...25
2.1 Introduction...25
2.2 Evidence of Stock Co-movement...27
2.3 Hypothesis Development...28
2.4 Data and Method...29
2.5 Industry Reaction to Earnings Announcements...31
2.6 Investors Reaction to the Firm-specific News...32
2.7 Industry Characteristics and Earnings Announcements...33
2.8 Robustness Tests...34
2.9 Conclusion...35
2.10 Tables...37
Chapter 3: Earnings Information Diffusion to the Option Market...49
3.1 Introduction...49
3.2 Data, Variable Construction and Methodology...51
3.2.1 Unexpected Stock Volatility...52
3.2.2 Stock Price Crash Risk...53
3.2.3 Other Variables Definitions...54
3.3 Option Market Information Flow...54
3.4 What Is Captured by Option Market Text Sentiment?...56
3.5 Conclusion...57
Chapter 1: What Does Text Sentiment Really
Measure? Evidence from Earnings Calls
1.1 Introduction
Advances in technology triggered a research boom in applications of textual analysis in social sciences with sentiment analysis being particularly popular. Sentiment analysis extracts text’s attitude by identifying words that are correlated with a variable of interest, such as stock return and aggregates it in a single number called text sentiment. A simple example of text sentiment is counting negative words in a text.
Hundreds of papers document the predictive ability of text–based sentiment measures in various contexts, but there is no consensus on how to interpret them.1 The literature interprets text sentiment in three ways: psychological sentiment, pure soft information, and omitted quantitative information.2 First, text sentiment may measure psychological sentiment. While in a good mood, investors overestimate expected cash flows and underestimate risks. Second, text sentiment can uncover pure soft information which cannot be extracted from numbers. For example, managers may hint on future acquisitions or products. Finally, text sentiment is correlated with quantitative information. For example, a purely quantitative statement that a company “posts a strong sales growth that surpasses expectations” has positive sentiment because of the words “strong” and “surpass.” Text sentiment substitutes quantitative variables that are known to the market but are omitted from an econometric analysis. Were we able to control for these quantitative variables, text sentiment would be redundant and lose its predictive ability.
What does text sentiment really measure? Which of the three interpretations prevails? The equity market is great place to study this question. A stock price quickly and fully absorbs company-specific news, while text sentiment is a less perfect information measure that reflects only a portion of the news flow. Thus, the news content of text sentiment can be measured by how much of same-period stock returns text sentiment is able to explain. Accordingly, stock returns serve as a benchmark for measuring information content of text sentiment.
An ideal experiment would compare two periods, one with only quantitative news and the other with only soft news and sentiment.3 If text sentiment explains higher portion of stock returns during the
1An incomplete list of popular text sources includes 10-Ks, earnings press releases, earnings calls, Wall Street Journal, Dow
Jones newswire, FOMC minutes, IPO prospectuses, Internet message boards, social networks.
2Tetlock, Saar-Tsechansky, and Macskassy (2008); Li (2010); Price, Doran, Peterson, and Bliss (2011) interpret text
sentiment as a measure of omitted quantitative news; Antweiler and Frank (2004); Mayew and Venkatachalam (2012); Kothari, Li, and Short (2009); Davis, Piger, and Sedor (2012); Demers and Vega (2008); Larcker and Zakolyukina (2012) as pure soft information; Tetlock (2007); Garcia (2013); Feldman, Govindaraj, Livnat, and Segal (2010) as investor sentiment.
3Also, the text source and text analysis method should be the same in both periods, and the text source should reflect the
first period, this will imply that text sentiment captures primarily quantitative news. In the special case where text sentiment has no ability to reflect soft news and investor sentiment, it will fail to predict returns during the second period. Obviously finding such an experiment is a challenge because news composition is unobservable and endogenous.
Our test comes close to the ideal experiment. We separate the three interpretations by comparing how much of same-period stock returns is explained by text sentiment during intraday versus overnight earnings calls. An earnings call is held a few hours after the release of quarterly earnings; management provides color on the numbers and answer analysts’ questions. Thus, the timing of a call is determined by the timing of an earnings announcement that is largely exogenous. Overnight and intraday calls have the same content, but an overnight call is accompanied by a huge amount of quantitative news from an earnings report. However, by the start of an intraday call, the overnight earnings release is already reflected in the stock price. Thus, quantitative news dominates the overnight period, while the time of intraday calls is full of soft news and sentiment. Figure 1.1 compares the timeline for the two cases. Overall, the timing of a quarterly report creates exogenous variation in news composition so that one case (overnight call) has mostly quantitative news while the other (intraday call) has mostly soft news and sentiment.
We find that text sentiment can explain same-period stock returns only during periods with predominantly quantitative news. For the Lasso-based method, text sentiment explains 1.6% of the overnight stock returns controlling for earnings surprise and other standard variables.4 However, text sentiment fails to predict returns or volatility during intraday calls.5 Meanwhile, average volume and volatility are higher during earnings calls compared to non-call time indicating that investors trade on information from an earnings call that is not captured by text sentiment. Humans can read between the lines and extract soft information while machines cannot.
We interpret the main result as evidence that text sentiment captures only omitted quantitative information, and not soft news or investor sentiment. Return predictability is directly proportional to the amount of quantitative news. Both predictability and quantitative news are huge for the overnight period,
is measured relative to its average in the preceding hour, then text sentiment can predict from a call transcript whether volatility is high or low during an earnings call. A closer look reveals that the predictability relies heavily on the words “morning” and “afternoon.” Indeed, it is well known that intraday volatility exhibits U-shape seasonality – it is lowest around lunchtime and highest at the open and close of trading.6 Thus, volatility is decreasing during morning earnings calls and is increasing during afternoon calls. After we control for the starting time of a call, the correlation between text sentiment and volatility disappears.
Our results have several implications. First, researchers may want to refrain from interpreting text sentiment in casual terms. The word “morning” does not cause lower volatility, it simply indicates the time of the day. Additionally, a CEO’s sentiment may predict future accounting restatements, not because the CEO leaks insider information, but because she repeats public information that for which an econometrician does notn’t account for. Second, human experts have a much better chance of extracting pure soft information from a text than machine-based methods. Third, text sentiment can reduce the omitted variable bias, because it captures a wide range of quantitative information. Finally, although we cover common text-sentiment methods, better methods will be developed in the future. These methods may start capturing soft information; however, they will be based on the same core principles and will be even better at capturing the omitted quantitative news. Thus, text sentiment will likely continue reflecting predominantly omitted quantitative information as the technology improves.
The paper provides additional insights on sentiment analysis in economics and finance. First, although the supervised-learning methods require more work, they substantially outperform the traditional dictionary approaches. The Lasso-based method explains 1.6% of close-to-open returns per standard deviation of text sentiment, while the financial dictionary yields only a 0.67% return. In addition, the dictionary methods have little to say about variables that are hard to measure on the positive/negative scale, such as volatility and volume. Second, the text sentiment of analysts’ questions predicts stock returns better than management’s answers and presentation (1.45% versus 0.56%). Finally, the supervised-learning methods estimate a custom weight for each word. We identify a small group of words that are extremely useful for explaining overnight returns. Specifically, if analysts use the word “congratulations” multiple times in their questions, the return is 0.8% higher on average. But the word has no predictive power for intraday returns as analysts do not create news here; they only reiterate what the market already knows.
A number of robustness tests validate the main result. The total amount of information released during the overnight period is larger than during an intraday call, which is reflected in larger overnight return volatility. The concern is that returns might be predictable because of the total amount of news
rather than its composition. We address it by showing that the main results remain qualitatively the same for subsamples of overnight and intraday calls with comparable return volatility. Specifically, we consider the following subsamples: (i) overnight calls with no earnings surprise, (ii) overnight calls with the same average volatility as in the intraday sample, and (iii) intraday calls with large earnings surprises.
Overall, the paper provides intriguing insights into the inner-workings of text sentiment. It shows in what case machine-base textual analysis is useful and how to interpret its results.
1.2 Conceptual framework
This section introduces a simple conceptual framework for how stock return and text sentiment interact in reflecting the news flow. The framework suggests a test for assessing whether text sentiment captures quantitative news, soft news, and sentiment by comparing text sentiment and stock returns in certain situations. The information content of text sentiment is proportional to a portion of stock returns it can explain. Hence, stock returns serve as a benchmark information measure.
A stock price quickly aggregates all public information relevant for a company’s value. Thus, stock returns are an extremely good measure of quantitative and soft news as well as changes in investor sentiment. Stock returns can be represented in Eq. (1) as the sum of the three news components and the residual term that absorbs other relevant factors and noise. Obviously, the amount and composition of news change across stocks and in time. The news gets into prices though trading, thus the total amount of news from a given period can be approximated by total stock return volatility or trading volume. However, how much each news component contributes to the total is not observable.
SktRett=QuantNewst+SoftNewst+Sentimentt+et (1) Text sentiment also measures news content but is obviously inferior to stock returns, which serve as a benchmark. Therefore, text sentiment captures only a fraction of each news component as reflected in Eq. (2). Here, text sentiment is transformed into stock return equivalent (e.g. with a regression) to make the units comparable.
method further condenses the news transcript into a single number, text sentiment. It is like telling from a single picture whether a person is happy or not. Thus, the text analysis method should be relevant to the specific application too. Finally, text sentiment is normalized with a regression to make the units comparable to stock returns. It is quite amazing that text sentiment is useful in many contexts given how much information is lost in the process.
Newst=t(QN,SN,PS)TexttMethosTextSentimenttwt (3) Overall, both the news text and the text analysis method must be relevant for text sentiment to reflect the news flow well. This paper studies complete transcripts of earnings calls, one of the most relevant sources of firm-specific news. We use a representative variety of currently available methods; future methods will work on the same principles and likely have similar properties.
The main question of which of the three news components prevails in text sentiment can be restated in terms of relative magnitude of the news weights in Eq. (2). If text sentiment measures primarily quantitative news, then its weight will be much larger than for soft news and sentiment. However, Eq. (2) cannot be easily estimated because the news components (QuantNewst,SoftNewst,Sentimentt) are not observed, a severe identification problem. We observe only two measures of news (stock returns and text sentiment) and a rough estimate of total news amount with return volatility.
The portion of stock returns that can be explained by text sentiment estimates weight average but not the individual weights. Accordingly, if we compare Eq. (1) and (2) and assume that the noise terms are uncorrelated, then the coefficient in the regression of stock returns on text sentiment will estimate an average of the weights from Eq. (2) weighted by news size. Thus, stock returns can be used as a benchmark news measure in this regression approach. The identification problem cannot be solved in general; however, if at certain time the news flow is exogenously dominated by one of the three components, then the regression will estimate the weight for this news component.
Building on this idea, an ideal experiment would compare two periods – one with only quantitative news and the other only with soft news and sentiment. If text sentiment explains a higher portion of stock returns during the first period, this will imply that text sentiment captures primarily quantitative news. If text sentiment has no ability to pick soft news and investor sentiment, then it will fail to predict returns during the second period. However, a number of additional conditions must be satisfied. Text source and the text-processing method should be consistent across the two periods. Also, the periods must be identified exogenously (without relying on news texts).7 Obviously, finding such an experiment is a challenge because news composition is endogenous.
7For example, if one assumes that the quantitative news component is proportional to the frequency of numbers in text, it
1.3 Empirical test and hypothesis development
Our test comes close to the ideal experiment described in the previous section. We separate the three interpretations by comparing how text sentiment predicts same-period stock return during intraday versus overnight earnings calls. The overnight period is dominated by quantitative news, while intraday calls contain mostly soft news and sentiment.
Earnings calls are held a few hours after an earnings release. Management walks investors through quarterly results, provides color on the numbers, and answers analysts’ questions. Earnings calls are broadcasted over the Internet in real time and are available to everyone. An earnings call is a major opportunity for analysts and investors to get insights directly from management. Thus, call transcripts are relevant and should capture the news flow well. Figure 1.1 compares the timeline for overnight and intraday calls.
Both overnight and intraday earnings calls have the same content and their timing is largely exogenous. Earnings are almost always released either before-market-open or after-market-close. The timing depends on headquarter location; East Coast companies usually report earnings before the open and then hold an earnings call during trading hours. Intraday and overnight calls have the same content. Indeed, if obvious time-related phrases (such as “good morning everybody”) are excluded, it is hard to tell based on the transcript whether a given call is overnight or intraday.
Although the calls in both periods have similar content, the news flow has very different composition. Overnight calls are coupled with quarterly report releases making this period full of quantitative news; while during intraday calls, soft news and sentiment dominate because the quantitative information repeats the quarterly report. This quantitative information is already reflected in price because the market has been open for at least half an hour before an earnings call.
Thus, following the ideal experiment from the conceptual framework we compare return predictability for two periods, one dominated by quantitative news and the other by soft news and sentiment. This framework implies the following testable hypotheses:
However, our volatility case study gives one example consistent with the last hypothesis. Text sentiment loses its ability to predict idiosyncratic volatility during an intraday call after we account for starting time and exclude obvious time references from a call transcript.
1.4 Data and sample construction
Transcripts of earnings conference calls are obtained from Seeking Alpha, a popular website for stock market opinion and analysis. A transcript contains the entire content of an earnings call as well as the starting time and the list of participating executives and analysts. A number of filters ensure the quality of the final sample.8 The data is then merged with I/B/E/S, CRSP, TAQ, and Compustat. The final sample consists of 25,992 transcripts from 3,852 companies from January 2006 to August 2012. Almost all earnings calls are held on business days with roughly one half starting during trading hours. Figure 1.2 shows the histogram of starting times. The vast majority of companies have earnings calls on the same day as earnings announcement.9
The subsample of overnight calls includes calls that start during non-trading hours between (between 4 pm and 9 am). For these, we focus on the to-open return that contains the call. The close-to-open return is adjusted everywhere for overall market performance by subtracting returns for S&P500 index ETF (SPY). The subsample of intraday calls include calls that that start between 10 am and 3 pm. Thus, all the overnight news including the earnings announcement are already reflected in the stock price when the call starts because the market has at least half an hour to process the news. For intraday earnings calls, we analyze stock returns from the start of the call until 90 minutes later. As more than 90% of calls end within 70 minutes, the market is given some time to process the call information after its end. The ending time is not reported in a transcript; however, the duration of a call can be estimated well by its word length. This point is supported by our analysis of manually-processed audio recordings for 500 earnings calls.10
Summary statistics in Table 1.1 confirm that there is little difference between the overnight and intraday samples in terms of transcript length or firm characteristics.
8The sample excludes transcripts of less than 200 words or with incomplete company name, ticker, date, or time. We extract
company name, ticker, date, and time from the first sentences of a transcript and then merge this information with CRSP and TAQ. To validate data quality, we compare our data with data from Earnings.com powered by Thomson Reuters and find about 1% disagreement for conference call date and 2% disagreement for its time. Observations with stock price below $5 or market capitalization below 10 million dollars on the day before a call are excluded. We require a stock to have at least one year of stock price data before a call.
9Earnings announcement dates are identified following a method of DellaVigna and Pollet (2009) who take a minimum
between Compustat and IBES dates.
10The duration estimates are derived from a regression analysis on a sample of 500 manually collected audio records of
earnings calls from the end of 2010.We estimate the following regression of duration measured in seconds on the number of words in a transcript: LongWords 0.21 ShortWords 51 . 0 TotalWords 0.71 4.48 Duration (-1.28) ) 65 . 3 -( ) 84 . 6 ( (5.99)
For the close-to-open sample, an earnings call is coupled with an earnings announcement, thus we use a number of control variables that are standard in the earnings announcement literature including analysts dispersion, previous abnormal returns, and company characteristics (book-to-market, market capitalization, share turnover, analyst coverage). DellaVigna and Pollet (2009) show that the relation between earnings surprise (SUE) and announcement returns is linear, we account for this non-linearity by having a separate variable for each SUE decile.
1.5 Text sentiment measures
We use four measures of text sentiment that represent both dictionary and supervised-learning approaches. These two are the most popular approaches to text sentiment analysis at the moment. The development of the NLP literature for the last decade indicates that the future methods will likely use the same core principles and thus have similar properties. Although dictionary methods are still popular in academic finance, they are abandoned by computer scientists in favor of supervised-learning methods that are usually more effective.
In the dictionary approach, words are split into a few categories such as “positive” or “active.” Each word in a category has the same weight. We use two dictionaries that are popular in finance literature: Harvard IV-4 psychological dictionary (Tetlock, 2008) is a general-purpose dictionary, and the financial dictionary of Loughran and McDonald (2011) is a specialized one. The main advantage of dictionary methods is that they are easy to implement and can be applied to small samples.
Following the literature, dictionary-based sentiment measures are defined in two simple steps. First, we count the number of “negative” words according to a dictionary and then divide it by total length of a transcript. Previous literature establishes that out of all dictionary categories, only negative words can predict returns; in unreported results we find evidence consistent with this point. We reverse the sign so that more positive sentiment corresponds to higher stock returns.
a text in words of number Total a text in dictionary Harvard from words negative of Number v FracNegHar (4)
data rather than assigning it based on our prior beliefs as dictionary methods do. Essentially, a regression is estimated where each English word serves as a separate covariate predicting stock return, volatility or any other variable of interest. For example, one standard deviation increase in the word “congratulations” increases stock returns by 0.8%, while the word “impressive” only increases returns by 0.04%. The supervised-learning approach is much more powerful and flexible than the dictionary approach, but it requires more work and expertise. The supervised-learning approach is now the industry standard and is widely used in all sorts of applications.
Special care is taken to avoid overfitting. The sample is split into five non-overlapping subsamples similar to standard cross-validation. Method parameters are estimated over four parts, and then the parameters are used to compute the predicted returns for the remaining fifth part. This way all the predictions are done out-of-sample. Thus, the coefficient estimates differ slightly for each part, but our analysis only needs predicted values.
We use the two most popular supervised-learning methods: SVM and Lasso. These are default choices for classification (SVM) and regression (Lasso) in the machine learning literature if the number of covariates is large compared to sample size. An attractive feature of Lasso is that it assigns non-zero weights only to a relatively small fraction of the total dictionary making it easy to identify the words with most impact. Further details about SVM and Lasso measures can be found in Appendices B and C, while Appendix A explains how a text is preprocessed before it can be used as inputs to a text sentiment method.
A call transcript can be split into three parts: management presentation, analyst questions, and management answers. For some of the tests, we compute text sentiment separately for each of these parts.
1.6 Main results
Our main test compares how text sentiment predicts stock returns during intraday and overnight earnings calls. We show that while text sentiment predicts overnight returns extremely well, it fails to predict intraday returns. This result allows us to conclude that text sentiment captures primarily quantitative information.
For the overnight sample, the close-to-open return is predicted by text sentiment extracted from overnight earnings call. This period is dominated by quantitative news because an earnings call is coupled with an earnings release (Figure 1.1 clarifies the timeline).
As mentioned above, text sentiment predicts overnight market-adjusted returns extremely well. As reported in Table 1.2, the general dictionary explains 0.5% of the overnight return while the financial dictionary does slightly better with a 0.67% return. These magnitudes are consistent with Tetlock et al. (2008) and Engelberg (2009) for the general dictionary and Loughran and McDonald (2011) for the financial dictionary. The first of the supervised-learning methods, SVM, performs slightly worse than the dictionary methods (with 0.34% return), perhaps because it is designed for discrete rather than continuous
variables. Finally, Lasso outperforms all other methods by a larger margin. If Lasso-based text sentiment increases by one standard deviation, overnight stock returns will increase by 1.6%.11 Text sentiment has almost the same economic magnitude as SUE. After Lasso-based text sentiment is included in the regression, the R-square increases from 8% to 14%.
Lasso not only performs better than other methods, it but also assigns custom weights to each word providing an insight into what drives the predictability. Words with the largest impact on returns are reported in Table 1.3. The list is consistent with human intuition about text sentiment. Most words with positive weights have positive linguistic meaning and the reverse for negative. Although this seems natural, remember that the method knows nothing except a call transcript and stock return, yet Lasso is able to filter out noise and build a good dictionary. Some of the top positive words include: “benefit,” “nice,” “improved,” and “strength.” Some of the top negative words include: “disappoint,” “delay,” “weakness,” “pressure,” and “revise.” However, the word “congratulations,” typically mentioned at the start of an analyst’s question, stands out. Each mention of this word is associated with 0.8% increase in overnight return. SVM also produces sensible weights, some of which are quite intriguing (e.g. the word “leadership” is negative, while “ownership” is positive). The custom-weights feature gives the supervised-learning methods an advantage over the dictionary methods that simply assign a unit weight to each dictionary word. The other advantage is that Lasso can adjust to a specific context such as stock volatility, where the dictionary approach is not helpful, as we show below.
For the intraday sample, the same methods are applied to predict market-adjusted returns during intraday earnings calls. All the text sentiment measures have little success as shown in Panel B of Table 1.2. The financial dictionary, the best performer, is only able to squeeze a 0.06% return which is statistically and economically insignificant. The general dictionary even gets the sign wrong, that is calls with positive sentiment are predicted to have a negative return. The general conclusion is further supported by Figure 1.3, which compares cumulative returns for calls with the most positive and negative sentiment according to each method. The returns for these extreme portfolios are contained between -0.1% and 0.1% and are statistically indistinguishable. If anything, the returns for the positive sentiment portfolio
Another alternative explanation is that maybe no new information is released during an earnings call and that is why text sentiment fails. It is hard to imagine why management, analysts, and investors would waste their valuable time if no news is released during earnings calls. Also, extensive anecdotal evidence indicates that management takes earnings calls extremely seriously.12Earnings calls receive a lot of news coverage and investor attention.
To test the “no news” hypothesis, we check whether idiosyncratic volatility and trading volume are higher during an earnings call compared to non-call time during the same day. Table 1.4 shows that trading volume is 19% higher during the call, while volatility is 9% higher. Indeed, some news is being released and investors are trading on it, but text sentiment algorithms cannot capture it. Importantly, we control for intraday seasonality in volatility and volume in these regressions by including half-hour dummy variables. Idiosyncratic volatility is estimated for each half-an-hour interval from six 5-minute returns adjusted for the market.
Overall, we find that text sentiment can predict same-period return only during periods with a significant amount of quantitative news. Thus, test sentiment captures primarily omitted quantitative information rather than the soft news of investor sentiment.
1.7 Robustness tests
This section conducts a number of crucial robustness checks that validate the main conclusion. It also provides additional insights into the overnight return predictability.
The total amount of information released during the overnight period is larger than during an intraday call, which is reflected in larger close-to-open return volatility. The concern is that returns might be predictable because of the total amount of news rather than its composition. We address this concern by showing that the main results remain qualitatively the same for subsamples of overnight and intraday calls with comparable stock volatility. Specifically, we consider the following subsamples: (i) overnight calls with no earnings surprise, (ii) overnight calls with the same average volatility as in the intraday sample, and (iii) intraday calls proceeded with large earnings surprises. The first two subsamples look at overnight calls with small volatility, while the last one looks at intraday calls with large return volatility.
First, we look at the subsample with no earnings surprise (measured by SUE) in Panel A of Table 1.5. Lasso and SVM use the same dictionaries and weights learned from the full overnight sample. Text sentiment continues to predict overnight returns well in this subsample. For example, Lasso explains a 1.2% return per standard deviation. The second subsample contains calls with an absolute overnight return
12“The next day was going be the biggest of her career, a chance to single-handedly extinguish the flames threatening to
engulf Lehman—and to prove her critics inside the firm wrong. In just a few hours Callan would represent Lehman Brothers—to the market, to the world. She would run the crucial conference call detailing the firm’s quarterly results. After presenting Lehman’s numbers, there’d be questions. Her answers might literally make or break the firm. Finally giving up on getting any sleep, she rolled out of bed.” Lewis (2011)
of less than 4.5%. As a result, the average absolute return for this subsample is 1.7%, which is the same as the absolute intraday return for the intraday calls. Even in this challenging subsample, all text sentiment measures remain significant. For example, Lasso explains a 0.24% return, still several times larger than for intraday returns. Finally, the last subsample contains intraday calls with large earnings surprise overnight, i.e. absolute overnight return of more than 2.7%. After a large earnings surprise, intraday earnings calls have more news and higher stock volatility. However, as Panel C shows, even in this case intraday returns remain unpredictable for all text sentiment measures even with overnight dictionaries. Overall, text sentiment continues to predict returns only for overnight subsamples irrespective of total volatility.
An earnings call consists of three parts: presentation by management, analysts’ questions and management answers. Text sentiment of which of these parts has better return predictability? We find that questions are by a large margin more informative than answers or presentation. We compute text sentiment separately for each part and then examine how they predict overnight returns for the overnight sample in Panel A of Table 1.6. SVM and Lasso are re-trained for each part of a call so that the same word can have different weight depending on a part of a call. Sentiment of each part can predict stock returns but question sentiment is more informative than the rest. For example, using Lasso, questions explain 1.5% of stock returns while presentation and answers only 0.6% and 0.3%, respectively.
All four text sentiment measures (two dictionaries, SVM, and Lasso) can predict overnight returns, but how independent they are? We put the text sentiments together to predict overnight returns in Panel B of Table 1.6. Lasso captures all of the sentiment predictability while other measures have little to add. Lasso has the same magnitude in individual (Table 1.2) and joint regressions (1.6% and 1.55%). The other measures lose any predictive power. The general dictionary explains a 0.18% return down from 0.5% in individual regression. The financial dictionary drops from 0.67% to 0.096%. Thus, Lasso absorbs all other measures, and instead of computing all measures, we can simply use Lasso.
If volatility is measured relative to its average in the preceding month, then both SVM and Lasso after re-training for this volatility measure can predict from “reading” a transcript whether volatility is high. This is not surprising because we already showed that text sentiment can predict the direction of earnings returns, and thus the magnitude of earnings surprise. Large earnings surprise leads to increased trading and volatility on the following day including the earnings call. In this case, volatility is the same during and before an earnings call. Thus, this measure cannot distinguish news coming from the intraday earnings call from compared against the rest of the day.
If an earnings call generates news, volatility should be higher during the call than before it. Thus, instead of measuring volatility relative to historical average, we should measure it relative to the time before the call. We compute relative idiosyncratic volatility from 5-minute market-adjusted returns during an earnings call and then normalize it by the idiosyncratic volatility during the hour before the call. SVM and Lasso are re-trained to predict the relative volatility. Although dictionary methods are not particularly useful for predicting volatility, SVM and Lasso actually do pretty well as Panel A of Table 1.7 shows. If Lasso sentiment increases by a standard deviation, relative volatility will be 10% higher during the intraday call, which is highly statistically significant.
At first glance, text sentiment is very good at predicting relative volatility. However, if we look at what words have the largest weight, we will start to worry. The word “afternoon” (“morning”) has the most positive (negative) weight. “Afternoon” has an eight times larger weight then the next most positive word (“easily”). The words “morning” and “afternoon” are most commonly used as greetings and Lasso uses them to infer the time of an earnings call. Indeed, it is well known that trading volume exhibits a U-shape intraday seasonality – it is lowest around lunch time and highest at the open and close of trading. Thus, trading volume is decreasing during morning earnings calls and is increasing during afternoon calls. After we control for intraday seasonality with half-an-hour dummies in Panel B of Table 1.7, text sentiment loses its correlation with volatility.
Thus, text sentiment loses its ability to explain variation in relative volatility after we control for the relevant quantitative information – in this case, intraday seasonality in volatility.
1.9 Conclusion
Even though text sentiment has proved extremely useful in numerous contexts, little is known about what type of information it measures. There is no consensus on how to interpret text sentiment; it can measure quantitative news, soft news, or psychological sentiment. This paper finds evidence that text sentiment captures predominantly omitted quantitative information rather than soft news or psychological sentiment. Thus, only one out three interpretations is consistent with our results. We reach this conclusion by comparing two information measures, stock returns and text sentiment, during two periods, one with predominantly quantitative news (overnight calls), and the other with mostly soft news and sentiment
(intraday calls). The information content of text sentiment is proportional to the stock returns it can explain. We find that text sentiment explains a large part of stock returns when the news flow is mostly quantitative, but fails during periods of mostly soft news and sentiment. Thus, text sentiment only reflects quantitative news and not soft information and sentiment.
If text sentiment reflects only omitted quantitative information, it should lose its predictive ability after all the relevant quantitative variables are controlled for. We find evidence consistent with this point in our volatility case study. Text sentiment loses its ability to predict whether volatility during an intraday earnings call is high or low only after we control for intraday seasonality in volatility.
The main result helps to identify environments where text sentiment is likely to be particularly useful and to choose economic hypotheses that are consistent with the quantitative news interpretation of text sentiment.
1.10Tables and Figures
Table 1.1:Summary statistics. The statistics are reported separately for the overnight and intraday earnings calls. An earnings
call is started by management presentation (“Present.”) which is followed by questions and answers section (“Q&A”). Earnings surprise is normalized by stock price. Stock returns are adjusted for the market by subtracting the return of SP500 index ETF (SPY).
Overnight Earnings Calls Intraday Earnings Calls Mean Median Std. Dev. Mean Median Std. Dev. Total Num. of Words 6,236 6,299 2,410 6,078 6,041 2,445 Num. of Words (Present.) 2,202 2,181 1,444 2,040 2,014 1,389 Num. of Words (Q&A) 4,035 3,990 1,858 4,038 3,982 1,973 Earnings Surprise, SUE -0.01 0.00 0.28 -0.01 0.00 0.24
Analyst Coverage 7.87 6 6.18 6.51 5 5.31
Log(ME) 21.13 21.06 1.91 21.10 21.08 1.76
Return Market-Adj., Overnight 0.001 0.002 0.065 0.003 0.002 0.054
Return Market-Adj., Intraday 0.000 0.000 0.027
Table 1.2: Reports main results. Overnight and intraday stock returns (Panel A for overnight and Panels B and C for intraday) are
predicted by text sentiment from earnings call transcripts. Text sentiment is estimated in four ways: the general dictionary, the financial dictionary of Loughran and McDonald, SVM, and Lasso regression. For all measures, higher text sentiment is associated with higher returns. The coefficients for text-sentiment are in percentage points, e.g. “1.6” for Lasso means that if text sentiment increases by one standard deviation, the overnight stock returns will be higher by 1.6%. Panel C uses a dictionary learned by SVM and Lasso from the overnight case to predict intraday returns. Panel A includes standard controls for earning announcement regressions as in DellaVigna and Pollet (2009) that are not reported to save space. Stock returns are adjusted for the market by subtracting the return of SP500 index ETF. The absolute t-statistics reported in parentheses are based on robust standard errors clustered by date.
Panel A. Overnight stock returns (N=9,673).
Dict. Fin.Dict. SVM Lasso
Text Sentiment 0.506 0.669 0.343 1.601
(8.11) (9.43) (5.74) (22.72)
Standard Controls Yes Yes Yes Yes
R2 0.09 0.09 0.08 0.14
Panel B. Returns during intraday earnings calls (N=10,610).
Dict. Fin.Dict. SVM Lasso
Text Sentiment -0.004 0.058 0.010 0.024
(0.14) (1.58) (0.37) (1.07)
Intercept -0.000 -0.000 -0.000 -0.000
(0.21) (0.21) (0.21) (0.21)
R2 0.00 0.00 0.00 0.00
Panel C. Returns during intraday earnings calls with a dictionary learned from the overnight case (N=10,610). SVM Lasso Text Sentiment 0.001 0.047 (0.02) (1.77) Intercept -0.000 -0.000 (0.21) (0.21) R2 0.00 0.00
Table 1.3: Twenty most positive and negative words according to the Lasso method for overnight stock returns. Weight tells how much stock return will increase if an earnings call contains one standard deviation more of a given word, e.g. a 0.81% return increase per standard deviation of words “congratulations.” Frequency tells the number of overnight transcripts containing a word. Each word is actually a lemma that absorbs multiple parts of speech (see Appendix A for details). “NOT_” before a lemma means a negation. Frequency is the number of earnings calls containing at least one given word. Only words that appear in at least one thousand call transcripts are considered for the table.
Positive
Words Weight, % Freq.
Negative
Words Weight, % Freq.
congratulations 0.81 3066 disappoint -0.27 2176 benefit 0.23 12978 delay -0.27 4549 nice 0.21 6959 weakness -0.22 4008 improved 0.16 9813 take -0.17 15250 strength 0.16 9302 pressure -0.15 7725 better 0.15 13917 revise -0.14 2286 improvement 0.14 11819 issue -0.13 12136 exceed 0.13 6478 impact -0.13 14264 favorable 0.13 6429 loss -0.12 8813 please 0.12 13208 shortfall -0.12 1008 outstanding 0.09 8309 decline -0.11 12005 update 0.08 11359 why -0.11 11618 statistics 0.07 1289 lose -0.10 5344 operate 0.06 14469 cause -0.09 6297 might 0.06 12678 transition -0.08 5842 solve 0.06 1270 spring -0.08 2049 carefully 0.05 2781 NOT_revenue -0.08 5395 government 0.05 5163 weak -0.08 5921 proud 0.05 2939 below -0.07 8185 sustainable 0.05 3954 promotional -0.07 2111
Table 1.4: Compares volume and idiosyncratic volatility during an earnings call with the rest of that day. Each observation is
based on a half-an-hour interval on a day of an earnings call (for the overnight sample, a day following earnings announcement). Earnings call dummy is set to one if a given interval is within 90 minutes from the start of an earnings call. “Average (log Volume)” is a historical average computed during a month preceding the call. Half-an-hour dummies control for intraday seasonality in volume and volatility. Idiosyncratic volatility in Panel B is computed from six 5-minute market-adjusted returns. Logarithm of an average of six 5-minute dollar trading volumes is a dependent variable in Panel A. The regression is in logarithms so that the coefficients can be interpreted in relative terms. E.g. trading volume is 19% higher during an earnings call. The absolute t-statistics reported in parentheses are based on robust standard errors clustered by date.
Panel A. Dollar Trading Volume
Log Trading Volume Earnings Call Dummy 0.193 0.190
(29.64) (28.67)
Log (Average Volume) 0.570
(25.22)
Half-Hour Dummies Yes Yes
R2 0.83 0.82
N 228,942 229,541
Panel B. Idiosyncratic volatility
Log Idiosyncratic Volatility Earnings Call Dummy 0.089 0.067
(11.62) (14.66)
Log (Average Id.Vol.) 0.698
(38.72)
Half-Hour Dummies Yes Yes
R2 0.50 0.38
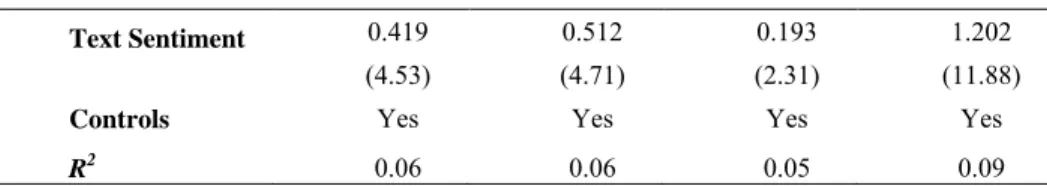
Table 1.5: Robustness tests – subsamples which make volatility between intraday and overnight calls comparable. Panels A and
B show how text sentiment predicts overnight returns for a subsample of calls with (A) no earnings surprise measured by SUE, and (B) same average volatility as for the intraday sample. For Panel B, only calls with absolute close-to-open returns of less than 4.5% are considered making average absolute return equal to 1.7%, which is the same as absolute return during intraday calls. Panel C shows how text sentiment predicts intraday returns for a subsample with large earnings surprise measured by absolute close-to-open return (>2.7%). Stock returns are adjusted for the market by subtracting the return of SP500 index ETF. Standard controls for earnings announcement returns are included. The coefficients for text-sentiment are in percentage points, e.g. “1.2” for Lasso means that if text sentiment increases by one standard deviation, overnight stock returns will be higher by 1.2%. The absolute t-statistics reported in parentheses are based on robust standard errors clustered by date.
Panel A. Overnight returns for subsample with no earnings surprise by SUE (N=3,781)
Dict Fin.Dict. SVM Lasso
Text Sentiment 0.419 0.512 0.193 1.202
(4.53) (4.71) (2.31) (11.88)
Controls Yes Yes Yes Yes
R2 0.06 0.06 0.05 0.09
Panel B. Overnight returns for subsample with the same total volatility as for the intraday call sample (N=6,335)
Dict Fin.Dict. SVM Lasso
Text Sentiment 0.104 0.157 0.084 0.238
(3.63) (5.28) (3.02) (8.76)
Controls Yes Yes Yes Yes
R2 0.05 0.05 0.05 0.06
Panel C. Intraday returns for subsample with large earnings surprise (N=3,517)
Dict Fin.Dict. SVM Lasso
Text Sentiment -0.059 0.029 0.005 0.021
(1.22) (0.49) (0.09) (0.42)
Controls Yes Yes Yes Yes
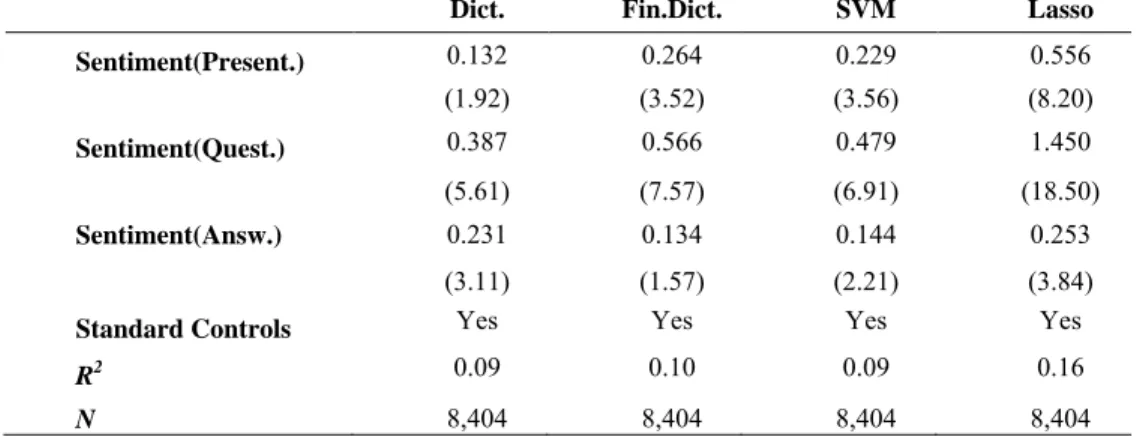
Table 1.6: Parts of an earnings call (Panel A) and all sentiment measures together (Panel B). Panel A shows how text sentiments,
computed for each part of a call with a given method, together predict overnight returns. An earnings call consists of management presentation, analysts’ questions, and management answers. Panel B shows how four sentiment measures (two dictionaries, SVM, and Lasso) together predict overnight returns. Each column reports a separate regression with sentiment from each part of a call. The coefficients for text-sentiment are in percentage points, e.g. “0.55” for Lasso means that if text sentiment increases by one standard deviation, overnight stock return will be higher by 0.55%. SVM and Lasso are re-trained for each part of a call so that the same word can have different weight depending on a part of a call. Thus, their dictionary and text sentiment here differ from the return analysis above. Stock returns are adjusted for the market by subtracting the return of SP500 index ETF. Standard controls for earnings announcement returns are included, but not reported. The absolute t-statistics reported in parentheses are based on robust standard errors clustered by date.
Panel A. Overnight returns and text sentiment of earnings call parts.
Dict. Fin.Dict. SVM Lasso Sentiment(Present.) 0.132 0.264 0.229 0.556 (1.92) (3.52) (3.56) (8.20) Sentiment(Quest.) 0.387 0.566 0.479 1.450 (5.61) (7.57) (6.91) (18.50) Sentiment(Answ.) 0.231 0.134 0.144 0.253 (3.11) (1.57) (2.21) (3.84)
Standard Controls Yes Yes Yes Yes
R2 0.09 0.10 0.09 0.16
N 8,404 8,404 8,404 8,404
Panel B. Overnight returns and all four sentiment measures put together.
Total Present. Questions Answers
Dict. 0.177 0.062 0.148 0.219 (2.62) (0.83) (2.44) (3.39) Fin.Dict. 0.096 0.129 0.343 0.208 (1.22) (1.56) (5.19) (2.72) SVM -0.038 -0.023 0.015 -0.022 (0.64) (0.37) (0.22) (0.35) Lasso 1.551 0.934 1.597 0.683 (21.00) (13.29) (20.36) (9.78)
Table 1.7: Volatility case study compares how text sentiment predicts volatility during intraday calls before and after accounting
for intraday seasonality. Relative idiosyncratic volatility is computed from 5-minute market-adjusted returns during an earnings call and then is normalized by idiosyncratic volatility during an hour before the call. SVM and Lasso are trained to predict relative volatility. Thus, their dictionary and text sentiment here differ from the return analysis above. The coefficients for text-sentiment are in percentage points, e.g. “10.4” for Lasso means that if text sentiment increases by one standard deviation, volatility will be higher by 10.4% during the earnings call. Average volatility is computed during a month preceding the call. Half-an-hour dummies control for intraday seasonality in volume and volatility. The absolute t-statistics reported in parentheses are based on robust standard errors clustered by date.
Panel A. Relative idiosyncratic volatility
Dict. Fin.Dict. SVM Lasso Text Sentiment 0.482 1.350 3.542 10.423 (0.80) (2.11) (5.87) (17.15) Intercept -0.280 -0.280 -0.280 -0.280 (42.01) (42.14) (42.01) (42.61) R2 0.00 0.00 0.00 0.03 N 10,714 10,714 10,714 10,714
Panel B. Relative idiosyncratic volatility after controlling for intraday seasonality
Dict. Fin.Dict. SVM Lasso Text Sentiment 0.007 1.139 0.037 0.634
(0.01) (1.73) (0.07) (0.99)
Abs (Overnight Return) -1.203 -1.190 -1.201 -1.210
(0.99) (0.98) (0.99) (1.00)
Average Volatility 1.009 1.192 1.009 0.999
(2.36) (2.68) (2.39) (2.36)
Half-Hour Dummies Yes Yes Yes Yes
R2 0.14 0.14 0.14 0.14
Figure 1.1: Compares the timeline for overnight (top) and intraday (bottom) earnings calls. The overnight period contains both an
earnings call and an earnings release, thus the period is dominated by quantitative news. Quarterly report is mostly quantitative, while an earnings call has a significant amount of soft news and sentiment. We study close-to-open stock return for the overnight case and stock return during an earnings call for the intraday case.
Close (t-1)
Open (t)
Close (t)
Time
Earnings
Call
Quant News
Soft News
Sentiment
Quant News
Soft News
Sentiment
Quarterly
Report
Quant News Dominates
Mostly Soft News and
Sentiment
Overnight
Case
Intraday
Case
Earnings
Call
Quant News
Soft News
Sentiment
Quant News
Soft News
Sentiment
Quarterly
Report
Time
Figure 1.3: Cumulative abnormal returns during intraday earnings calls for portfolios with extreme sentiment. Intraday calls are
sorted based on text sentiment during an earning call into most positive 20% (green), most negative 20% (red), and the remaining 60% (blue). Cumulative returns for equally-weighted portfolios are reported from 20 minutes before until 100 minutes after the starting time and are normalized to zero at the start of a call. Return ranges from –0.2% to +0.2% (vertical axis). Stock returns are adjusted for the market by subtracting the return of SP500 index ETF.
Chapter 2: Do Earnings Announcements Contain
Industry Information?
2.1 Introduction
An earnings announcement is a major source of information about a company. It contains both firm-specific as well as industry-wide news components. A large literature13 studies the industry-wide component relying on stock return co-movement with industry-related firms around the announcement date. However, Foster (1981) identifies a major flaw in this approach by arguing that firms in the same industry are affected by many actors besides earnings news. Although, he considers only other news releases on the announcement days, the factors also include correlated financial and operational decisions due to competition and the same economic environment as well as correlated flows to funds that hold industry-concentrated portfolios. As a result, stock returns of these firms are highly correlated on a day-by-day basis for the non-news related reasons. Foster provides returns-based evidence of information transfers around both actual and pseudo earnings announcement dates. Thus, we need a measure of news content that is otherwise unrelated to the trading process.
Using textual analysis, I suggest a direct measure of earnings sentiment that separates firm-specific and industry-wide components of earnings news. I find that earnings announcements are the major firm-specific news and contain little industry-wide information. However, in industries with low competition and entry costs, earnings news has somewhat greater importance among industry rivals.
Researchers try to avoid returns’ correlation problem using earnings announcement surprise measure in the search for industry response (Pyo and Lustgarten (1990), Han and Wild (1990), Kim, Lacina, and Park (2008)). According to their findings, earnings surprise has little economical or statistical effect on the returns of business-related firms. This result can be interpreted in different ways. On the one hand, it points at low information value of a single firm’s earnings announcement to the industry. On the other hand, it can be attributed to the limitations of earnings surprise measure. It captures only the earnings part from the information flow on the announcement day. Industry rivals might be more interested in changes of sales, investments, and other variables from the financial report related to the firm’s strategic decisions as a result of economic and firm-specific factors. Therefore, current evidence on the industry effect of an earnings announcement is still inconclusive.
In the first chapter we show that earnings conference calls text sentiment measure aggregates major quantitative information from an earnings announcement. This measure is based on words from earnings
13Foster (1981), Han, Wild and Ramesh (1989), Pyo and Lustgarten (1990), Thomas and Zhang (2008), and Tookes (2008)
conference call transcripts and is not related to fundamental factors that drive stock returns’ correlations within an industry. Therefore, if earnings announcements convey industry-wide information, the text sentiment value would partially explain industry index return variation.
The main result of the paper is that firm-related earnings sentiment measures (text sentiment and earnings surprise) have strong explanatory power for the announcing firm’s returns and volume and almost no effect on the industry portfolio returns and volume on the day of announcement. In particular, one standard deviation of text sentiment index explains 1.5% of announcement return and at best 0.03% of the industry portfolio’s return variation. Such findings make it doubtful that earnings announcements have a considerable amount of industry-wide information.
I consider a number of alternative explanations. First, investors can be slow in reacting to earnings news as shown for economically linked firms by Cohen and Frazzini (2008). However, even a month after an announcement there is no industry cumulative response to the released news.
Another hypothesis is that industry-wide news doesn’t change frequently enough to make each earnings announcement informative to the industry. Freeman and Tse (1992) show that industry reactions are stronger for the first earnings reports in the financial quarter and deteriorate considerably for the subsequent reports. Therefore, aggregating among all announcements in the industry we might lose the actual effect of earnings news on the industry. Additional tests on a subsample of early earnings releases still give us economically insignificant industry information flow.
However, I don’t exclude a possibility that industry-related news in an earnings announcement has been accounted for long before the announcement day. Firms tend to anticipate investors’ negative surprises doing financial releases and announcements about changes in their forecasted quarterly results. An example of such events is the UPS announcement on July 12, 2013 that the company considerably reduced its’ earnings expectations due to economic slowdown. UPS stock price fell by 5.5%, while its main competitor FedEx dropped 2% that day.
This paper is related to the wide literature investigating information transfer between economically related firms. The underlying hypothesis of such studies is that firm’ news reveal firm-specific
(2010) is an example of studies regarding industry response to IPO. They find negative stock price reactions among IPO firm competitors if the IPO is completed and positive responses to IPO withdrawals. Therefore, the existing evidence suggests that these types of firm announcements convey industry-wide information.
At the same time, not all firm announcements are informative for competitors. Hertzel (1991) concludes that share repurchase news is primarily firm specific. I extend the list of news from a company that does not emit information for its industry, arguing that an earnings announcement of a firm is mainly populated by firm-related news.
An overview of the paper is as follows. In Section 2 of this paper, I show that stock returns of a firm are largely explained by the variation in the industry portfolio return of the same day. This correlation is strong for any industry classification implemented in this paper. Section 3 describes the underlying hypothesis for the chosen methodology. Section 4 introduces the data description and methods of industry classifications. Section 5 presents the industry reaction to a single firm’s earnings announcement. While in Section 6, I show that both sentiment measures effectively explain cross-sectional variation in announcing firm returns and volume. In Section 7, I examine if an industry’s reaction to earnings announcements differ depending on the industry’s specific characteristics (such as industry competition level). Section 8 presents robustness tests to the main results of the paper. Section 9 provides concluding remarks.
2.2 Evidence of Stock Co-movement
Financial literature provides traditional and friction- or sentiment-based theories of the stock co-movement.
First, the most intuitive theory relates co-movement in prices with co-movement in underlying firm fundamentals. This theory is mostly based on the frictionless markets and the concept that prices are derived from firms’ financial outcomes. Industry-wise, firms face the same economic environment and competition. Therefore, they have interconnected operational decisions and similar financial and investment responses to shifts in supply and demand conditions as well as changes in the regulatory environment. This leads to the correlated firm financial outcomes and, as a result, co-movements in the stock prices. Since equity traders explore this fact to their advantage, this might explain aggregated industry price movements as a response to a firm’s earnings announcement. At the same time, observed price co-movement might also be due to other fundamental changes in an industry.
Friction- or sentiment-based theory is nested on investors’ simultaneous trading stocks of the same industry. One reason for this type of trading is illustrated by Barberis and Shleifer (2003). According to their findings, many investors often trade groups of assets based on some common characteristics, for example “industry”. Another reason is geographic location. Firms in the same industry cluster geographically to explore the benefits of geographic proximity (Marshall (1980), Glaeser et al. (1992),
Prinsky and Wang (2006)). A number of research papers demonstrate investors’ tendency to overweight local companies in their portfolios. For instance, Coval and Moskowitz (1999) find that professional money managers have strong preferences toward locally headquartered stocks. Ivković and Weisbenner (2005) and Zhu (2002) document similar patterns for individual investors. If some of these investors have similar trading sentiment or demand to relocate their cash holdings, and if their trading affects stock prices, then they can easily induce price co-movements in an industry without actual information flow. Thus, we should be careful interpreting stock price co-movement as firms’ simultaneous reaction to an earnings announcement in an industry.
Stock price co-movement is a fairly pronounced phenomena independent from a strategy we use to find business-related firms. For the purpose of this paper, I suggest four different industry classifications described in the “Data and Method” section. Stock returns are correlated in any of four classifications. To illustrate this point, I examined how industry portfolio returns can explain contemporaneous returns of announcing firms on a daily basis. I constructed industry value-weighted portfolios for each announcing firm on the trading day interval [-30; 30] around earnings announcement excluding 2 days before, 2 days after, and the day of the earnings release.
Table 2.1 shows that even controlling for standard factors known to explain stock returns behavior, the industry portfolio captures a significant portion of firms’ daily returns. Here, the industry portfolio includes all stocks existing in the same industry that did not have an earnings announcement within 3 days around announcement day for a chosen firm. The market portfolio is a portfolio formed from all CRSP firms except those in the industry portfolio, announcing firm and firms with earnings release within 3 days around announcement day of chosen firm. Betas for an industry portfolio are greater than 40% in each industry classification except for the classification with the most positively correlated returns during last 12 months. Taking into account that the last industry classification represents the most business-related firm or two, it can explain the impressive 11% stock price movements.
to be correlated with industry returns the day of announcement. The magnitude of the correlation will give us the estimation of the industry-wide component of earnings news.
To avoid model complexity as there is enormous amount of variables in financial report of a company, I use text sentiment measure calculated from earnings conference call transcript. First chapter provides evidence that this measure serves as a great proxy for the main quantitative information form earnings announcements that drive stock price of the reporting firm.
Apart from text sentiment that focuses on quantitative information from earnings conference calls, I also use unexpected earnings. The reason for adding this measure of earnings sentiment in the analysis is two-fold. First, its explanatory power might be magnified from 2006 to 2010 due to high information uncertainty during this period. Second, since it has a nonlinear effect on the returns of the announcing firm, we might find some dependencies for particular values of this variable. By combining text sentiment and earnings surprise, I capture most of the information about earnings sentiment on the day of the announcement.
The main question of the paper is whether earnings sentiment measures can explain industry returns variation and investor activity during the day of an earnings announcement.
2.4 Data and Method
The analysis of this paper is based on a sample of firms with earnings conference call transcripts for the years 2006 through 2011. Transcripts are downloaded from seekingalpha.com and filtered to have accurate and complete data on company’s symbol, name, date, and time of earnings conference call.14
In this paper, I use two direct measures of earnings sentiment. First is standardized unexpected earnings calculated from IBES database. It is equal to the difference between the actual earnings and the median analyst forecast from the last survey before the earnings announcement (normalized by stock price five days before the announcement).15 Second is the text sentiment from firm’s earnings conference call transcripts measured by lasso regression.16 I use CRSP, IBES, and Compustat as sources of data and controls in this analysis.
The main variables of interest are: first, value-weighted industry portfolio’s return; and, second, volume on the day of earnings conference call. Since most of the conference calls (nearly 80%) are held on the day of earnings announcement, I use conference day as the day of earnings release. To avoid spurious correlations in the main results, for each industry portfolio I exclude the announcing firm, stocks with price below $5, and firms with market capitalization below $50 million on the day of the
14The full process of clearing earnings calls’ sample is described in the first chapter.
15Standardized unexpected earnings are calculated follow