The Impact of a
Microfinance Program
on Private Health Care
Providers in Uganda
Eric E. Seiber
FUNDED BY
The US Agency for International Development USAID Contract No. HRN-C-00-90-00039-00
IN PARTNERSHIP WITH
Abt Associates Inc.
Population Services International
Commercial Market Strategies (CMS) is the flagship private sector project of USAID’s Office of Population and Reproductive Health. The CMS project, in partnership with the private sector, works to improve health by increasing the use of quality family planning and other health products and services.
COUNTRY RESEARCH SERIES
The papers in CMS’s Country Research Series were developed to inform specific CMS country program operations, but they also contain results that may be of interest to a wider audience. All papers in the series were reviewed by CMS research staff in the field and in Washington, DC, as well as by relevant CMS program management staff.
THIS PUBLICATION FINANCED BY USAID
This publication was made possible through support provided by the Bureau of Global Health, Office of Population and Reproductive Health, US Agency for International Development (USAID) under the terms of Contract No. HRN-C-00-98-00039-00. The views and opinions of authors expressed herein do not necessarily state or reflect those of USAID or the US Government.
ABOUT THE AUTHORS
Eric E. Seiber is an Assistant Professor of Public Health at Clemson University. Amara Robinson-Miller is a Monitoring and Evaluation Officer with UNAIDS.
ACKNOWLEDGEMENTS
Thanks to Ruth Berg, Meaghan Smith, Beth Fischer, and Sohail Agha for reviewing a draft of the paper.
ABSTRACT
This evaluation assesses the impact of a microfinance program on small-scale private health care practices in Uganda. The objectives of the program included (1) increasing the viability of the practices, (2) improving services, and (3) expanding services.
This study uses data on respondents’ perceived quality of care utilization preferences to examine the program’s success. The report finds the loan program has improved perceived quality and increased utilization. In addition, the program has enhanced clinic viability through strengthened revenue, with improved drug availability emerging as a lead reason for choosing loan clinics.
KEY WORDS
Contents
Executive Summary ... 1
Introduction ... 3
Ugandan health indicators... 3
The Intervention ... 4
The Summa Foundation ... 4
Uganda private providers loan fund... 4
Data and Methods... 6
Study objectives ... 6
Study design and survey methodology ... 6
Questionnaire and indicators... 6
Data analysis ... 7
Results ... 9
Descriptive (Bivariate) Results ... 9
Midwives versus other providers ... 10
Multivariate results and impact assessment ... 11
Discussion ... 14
Limitations ... 15
References ... 16
Appendices ... 17
Appendix I: Report Tables... 18
Appendix II: Baseline Questionnaire ... 24
Appendix III: Follow-up Questionnaire... 29
Executive Summary
This evaluation assesses the impact of Summa’s microfinance program on the viability of small-scale private health care practices in Uganda. Summa is a not-for-profit investment fund that provides financing and technical assistance to the private health care sector in developing
countries. Summa’s microfinance program began disbursing loans in January of 2001 in Uganda, after recipients had received training in core business skills. The program has had three main objectives:
• Increasing practice viability
• Improving services
• Expanding services
Summa asked the authors to conduct an assessment during the loan program’s second year. Study design and survey methodology parallel the impact assessment conducted during the loan
program’s first year (Agha et al., 2002). By examining loan impact on client perception of quality of care in recipient practices, the study indirectly assesses the role of perceived quality in
improving client flow through increased client loyalty and new-client recruitment. The evaluation found that the program achieved its goal of improving practice viability, largely through
increased utilization and enhanced drug sales that have resulted from more consistent drug availability.
Both the first-year and second-year studies used a quasi-experimental design, including baseline and follow-up surveys and a nonequivalent comparison group, to assess loan impact on program goals. The findings of this second-year assessment are based on 2,387 client exit interviews carried out in October 2001 and October and November of 2002. Interviews were conducted at 22 intervention clinics and seven comparison clinics.
The current assessment draws on data that reflects respondents’ perceived quality of care utilization preferences to examine program success. Perceived quality at follow-up improved for loan recipients’ practices: clients were 4.2 times as likely to choose the provider on the basis of drug availability; 2.0 times for fair charges; 1.6 times for cleanliness; and 5.2 times for
confidentiality.
Despite these improvements in perceived quality, the changes have translated into mixed results for client loyalty — for example, respondents were only half as likely to “always” visit a particular clinic. Closer examination of the data suggests, however, that this change results from more clients reporting that they “sometimes” use the clinic, and does not necessarily indicate a decline in client loyalty — it may instead reflect a broadening of the client base, which has also been a program goal. And loan clinics do seem to have attracted new clients. The comparison between baseline and intervention surveys showed that loan clinics had an average increase of five clients per week (a 12 percent average increase) over comparison clinics — although, as noted in the Discussion section, the result cannot be extrapolated to an annual estimate.
Broadening a clinic’s client base through the addition of more casual users could cause a decline in the percentage of clients reporting that they always visit the clinic.
example, despite client perceptions that the range of services and presence of essential equipment remained unchanged over the study period, follow-up respondents were four times as likely to cite drug availability as the reason for their clinic choice. (This finding coincides with follow-up survey respondents being half as likely to cite drug availability as needing improvement.) The new perception of these clinics as reliable drug outlets will provide an enhanced and sustainable revenue stream for providers.
While the evaluation did not collect data on fees charged, it did include “fair charges” among the list of reasons that survey respondents chose to come to a loan recipient’s clinic. Clients at follow-up were twice as likely to base their choice on a perception that the clinic charged fair price for its services.
In general, the assessment results suggest that the microfinance program has improved the financial viability of loan-recipient providers. The results also suggest that the intervention may have contributed to improved public health outcomes. The data indicate that recipients primarily invested loan proceeds in pharmaceuticals. Given Uganda’s high level of malaria infection — 40 percent of outpatient visits can be attributed to malaria (Root et al., 2003) — clinics’
pharmaceutical investments are likely to have responded to high demand for malaria drugs. At follow-up, loan clinic respondents were 1.9 times as likely to visit the clinic for malaria treatment. The loans were, however, less successful in promoting preventative visits. Study results show no change in the percentage of clinic respondents seeking preventative or family planning services. Despite these flat results, strengthening the viability of small private-sector providers does provide a safety net for the provision of reproductive health services if public-sector provision is threatened in the future.
Introduction
Although there is growing interest in understanding and increasing private-sector provision of health services in developing countries, few studies shed light on the relative impact of strategies designed to enhance the private sector’s role. Franchising and accreditation (Mills et al., 2002) and — more recently — microfinance are among the strategies that have been employed to increase private-sector health care provision.
Microfinance programs have been used since the 1950s to alleviate poverty, often with the intermediate goals of empowering women or improving children’s education by increasing available assets. Until recently, however, microfinance has seldom been applied to providing reproductive health services in a developing country. The only published study — a precursor to this study (Agha et al., 2002) — found that microfinance loans improved perceived quality and client loyalty at recipient Ugandan midwives’ clinics. There are also descriptive results indicating that among a group of midwives in Indonesia, microfinance loan recipients saw a marked
increase in the number of new family planning clients within one year (Summa Foundation, n.d.). This second Ugandan study assesses the impact of the microfinance program on clients’
perceptions of quality of care offered by an expanded group of private providers. (In addition to midwives, it includes doctors, nurses, clinical officers, and pharmacists, among others.) The overall goal of the program has been to improve public health outcomes by improving and expanding small-scale private health care practices. An underlying program hypothesis is that client perceptions of improved quality-of-care will lead to enhanced client flows (the result of higher retention of current clients and an increase in new clients). An additional assumption is that expanded service offerings and more consistent drug availability will result in increased revenues.
Ugandan health indicators
With an estimated per capita income of $259 in 2003, Uganda remains one of the poorest countries in the world. Although Uganda has shown improvement in a number of health indicators, including a decreasing level of HIV prevalence (UNAIDS, 2004), others point to the country’s continued need for expanded health services. This is particularly true for women and children, the most vulnerable members of society. In 2001, the infant mortality rate in Uganda was estimated at 88 deaths per 1,000 live births, with a life expectancy of 45 years. The use of modern contraceptive methods is still low among Ugandans (23 percent), with the total fertility rate estimated at 6.9 children per woman in 2001 (Uganda Demographic and Health Survey, 2001).
A number of health observers have recently cited malaria as the country’s most significant health problem (Root et al., 2003). Much of Uganda’s population lacks access to anti-malarial drugs and treatment, with under-five children and pregnant women most at risk, due to life-threatening anemia and cerebral malaria.
The Intervention
The Summa Foundation
The primary goal of the Summa Foundation, a not-for-profit investment fund created by USAID (and now operating as part of the USAID-funded Commercial Market Strategies project, or CMS), is to improve a wide range of public health outcomes in developing countries by expanding and improving the private health sector. Summa uses financing and technical assistance as its main tools.
Summa’s microfinance program is one of several financing mechanisms it employs in addressing the varied needs of differing loan recipients. Recipients include commercial companies, non-governmental organizations (NGOs), and individual health care providers, such as midwives, nurses, doctors, and pharmacists. Through the microfinance program, Summa works in
partnership with local financial institutions and provider associations to offer revolving small or micro loans to borrowers. The goal of making loan funds available is to expand and improve the services offered by private health care providers. By enabling providers to invest in their practices and by offering training in business skills, Summa gives providers the opportunity to improve service quality. The underlying premise is that improved quality of care will be reflected in improved client quality-of-care perceptions — which in turn will attract more clients, increase client loyalty, and make these private sources of health care services, including reproductive health services, more sustainable.
Uganda private providers loan fund
Although for several years the Ugandan government has recognized that small private-sector health care providers — including pharmacists, nurses, midwives, and doctors — could play an important role in meeting the country’s health care needs, a lack of credit has been a major constraint to small-provider expansion (SEATS, 2000). In response, Summa, in collaboration with CMS/Uganda, launched the Uganda Private Providers Loan Fund in 2001. The fund was designed to provide a package of both financing and technical assistance to small-scale private health care providers. More specifically, the loan program has had three primary objectives:
• Improving private-practice viability
• Improving services
• Expanding services
Initial loans went to 15 midwives, who were recruited through the Uganda Private Midwives Association. Midwives typically work for a number of years in government service and then establish their own private clinic. Beyond reproductive health services, such clinics often provide primary care services that include administering immunizations to children and dispensing drugs to both male and female clients. An impact assessment of the midwives’ loans on their clients’ perceptions of quality of care was conducted in 2002 (Agha et al., 2002).
pharmacists, and other clinic owners. The level of available funds was increased from $175,000 to $300,000, and the program’s timeframe extended for an additional two years. The current study, conducted between October 2001 and November 2002, assesses the impact of the loans made to the expanded group of providers.
Loan recipients in the expanded provider group were identified through professional associations and direct marketing carried out by the Uganda Microfinance Union, which has administered the fund. Just over 44 percent of this broader group of loan recipients were midwives and 30.5 percent were nurses. Clinical officers made up 15.4 percent, and doctors, 8.9 percent. Just over half (56.5 percent) of all borrowers resided in peri-urban areas, with remaining loan recipients located in urban (26.5 percent) and rural (17.2 percent) settings.
Loans were disbursed to providers on a revolving basis. Recipients could use loan proceeds as working capital, to purchase drugs or equipment, or to renovate or upgrade their clinic.
Monitoring data indicate that the majority of loan recipients, regardless of how many times they had received a loan, planned to use a portion of the money to increase their drug stocks. Just over four out of five first-time borrowers (82.9 percent) used a portion of their loan proceeds to purchase drug supplies, and slightly under half (45.3 percent) used a portion to buy equipment. More than a quarter (27.1 percent) used a portion of loan proceeds to renovate or expand their clinic. While subsequent borrowers continue to use a significant portion of loan proceeds to purchase drug stocks, an increasing number also invest in equipment and clinic renovation and expansion.
For the purpose of this study, it should be noted that providers in the intervention group had at least one and a maximum of two loans. Due to changing patterns in how borrowers invest loan proceeds, future evaluations of borrowers who have received more than two loans may produce different findings. The changes may have on impact on clients’ perceptions, particularly as they relate to range of services offered and essential equipment.
The loan program has also included a five-day business skills training component conducted by the National Smallholder Business Center. The training curriculum included such core business-management elements as business planning, record-keeping, financial reporting, credit
management and marketing, with an emphasis on customer satisfaction. The curriculum also included an introduction to the family planning products sold by the CMS project in Uganda.
Data and Methods
Study objectives
The goal of this second impact study is to assess the impact of Summa loans on the viability of an expanded group of Ugandan private-provider practices through increased client loyalty and improved sources of revenue. The evaluation considers the impact of loans on clients’ perceived quality of care and indirectly examines the role of perceived quality in improving client flows through current client loyalty and the recruitment of new clients.
Study design and survey methodology
The study design and survey methodology used in this assessment parallel that used in the first impact assessment (Agha et al., 2002). The study employs a quasi-experimental design that uses baseline and follow-up surveys and a nonequivalent comparison group to evaluate the impact of the loans on the outcomes of interest.
This study considers 29 clinics, of which 22 received a Summa loan (the intervention group) and seven did not (the comparison group). Twenty-three clinics —18 intervention and five
comparison — were located in the Kampala district; the remainder were located in either the Mukono or Wakiso districts. The survey instrument was developed by CMS, which also supervised the training of all interviewers. Each interviewer remained at the same clinic throughout the data collection period.
The number of exit interviews completed for each study group during the baseline and follow-up surveys is:
Baseline Follow-up
Intervention clinics 951 856
Comparison clinics 319 261
Baseline data was collected during October 2001, and the follow-up survey was administered in October and November 2002. Exit interviews of all clients leaving the clinics were conducted over a five-day period. Survey acceptance was high, with only a few clients declining to participate.
Questionnaire and indicators
The questionnaire was designed to collect data on socio-demographic characteristics of clients (including median age, gender, marital status, educational attainment level); reason for visit; and level of client satisfaction. The survey instrument was pre-tested using several clinics in
Kampala, and appropriate changes subsequently made. The analysis focused on three questions: Why was the client visiting the outlet; why did the client choose the particular outlet instead of another; and, based on the visit, what recommendations would the client have for service improvement? See the appendices of this report for tables presenting the complete list of disaggregated indicators.
Data analysis
As mentioned earlier, this assessment parallels the evaluation done by Sohail Agha and others of the impact on a cohort of midwives receiving Summa loans in the program’s first year. We use a similar data analysis in this report for comparability. A descriptive analysis was conducted first. The data in the current cohort required modifications of the multivariate models.
Descriptive analyses of the client exit interviews compare the profiles of clients at baseline and follow-up, as well as changes in client response between baseline and follow-up. The bivariate results establish which quality dimensions are most important to Ugandan clients and illustrate changes in the quality indicators over time. All bivariate analysis used Pearson chi-squared and Wald tests to test for significant differences between clinic groups (Table 1) and over time (Tables 2 and 3). Each clinic is treated as its own stratum in calculating the test statistic. Attributing the changes over time observed in the bivariate analysis requires multivariate analysis. The first multivariate analysis tests the hypothesis that the indicator has changed between baseline and follow-up, after controlling for differences in respondent demographics between the two survey rounds. Separate logistic regressions for loan and comparison clinics estimate the model:
(1)
Perceived Quality Indicator = α + β1follow-up + β2age + β3female + β4some_education + β5Secondary_education + β6Exenditures_per_capita.
Where:
Perceived Quality Indicator = the quality indicator of interest
Follow-up = 1 if interview conducted in the follow-up round (time trend) Age = age of the respondent
Female = 1 if respondent is female
Some_education = 1 if respondent has some schooling, but has not finished secondary school
Secondary_education = 1 if respondent finished secondary school
Exenditures_per_capita = food and rent expenditures per household member in thousands of Ugandan Schillings.
The coefficient β1 in each model tests the significance of the time trend for the comparison and intervention clinics, independent of the demographic characteristics in the sample. The model treated each clinic as a separate stratum when calculating standard errors for the estimates. A significant time trend indicates that perceived quality has changed, independent of respondent demographics, but the time trend is insufficient to attribute the change to the intervention. A final model estimated from the pooled data from all clinics and survey rounds determined the net impact of the project. Logistic regression for all respondents estimated the final model:
(2)
Perceived Quality Indicator = α + β1loan_group*follow-up +β2loan_group
+ β3follow-up + β4age + β5female + β6some_education +
β7Secondary_education + β8Exenditures_per_capita.
This final model includes all variables from the time trend model, but also adds two new variables. Since loans cannot be issued randomly to clinics, a dummy variable indicating clinic group controls for differences in quality between loan and comparison groups at baseline. Second, a time trend clinic group dummy variable assigns impact by testing if perceived quality changed more at loan clinics than comparison clinics. Finally, the model treated each clinic as a separate stratum when calculating standard errors for the estimates.
Results
Descriptive (Bivariate) Results
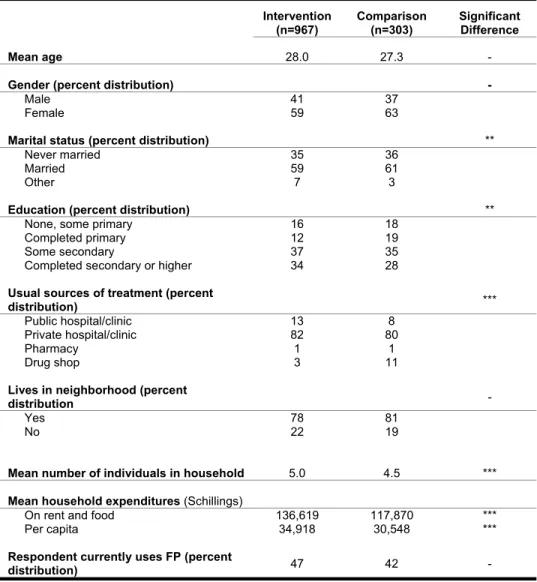
Tables 1 through 5 (see appendices) display the results of the bivariate analysis. Since the comparison clinics provide the reference point for measuring program impact, the first table examines the intervention and comparison clinics at baseline to assess the validity of making comparisons between these two groups. Due to data limitations, the descriptive analyses can make only a rough approximation of changes in client volume over the study period. Table 1 shows the distribution of respondents in the intervention and comparison groups by selected demographic and household characteristics. Respondents in both groups had a mean age of about 28 years. There were no significant differences in the proportion of men and women interviewed in the two groups, with women making up somewhat less than two-thirds of respondents at both intervention and comparison clinics.
The marital status of respondents showed a minor significant difference between groups. Fewer clients did state that they were married at intervention clinics (59 percent versus 61 percent). The significance arises from the four-point difference in those reporting Other Marital Status (7 percent versus 3 percent). Similarly, respondents visiting intervention clinics were significantly more likely to have higher levels of education than clients interviewed at comparison clinics. Only 28 percent of respondents in the comparison group reported completing at least a secondary-level education, compared to 34 percent of respondents surveyed at intervention clinics.
Respondents in the two study groups also differed significantly with regard to their usual source of treatment. Thirteen percent of clients at loan clinics stated that they normally sought care at a public hospital or clinic, compared to only 8 percent of those receiving service at a comparison facility. Those surveyed at comparison clinics were also more likely to rely on a drug shop or pharmacy for treatment (12 percent) than those visiting an intervention clinic (4 percent). Clients visiting clinics receiving loans reported larger households than those visiting comparison clinics (5 versus 4.5 persons per household), and enjoyed higher household socioeconomic status. No significant differences were found in the proportion of respondents residing in the clinic’s neighborhood. Although slightly more respondents (47 percent) stated that they currently used a family planning method at intervention facilities, this was not significantly different when compared to the proportion of those reporting the same behavior at comparison clinics (42 percent).
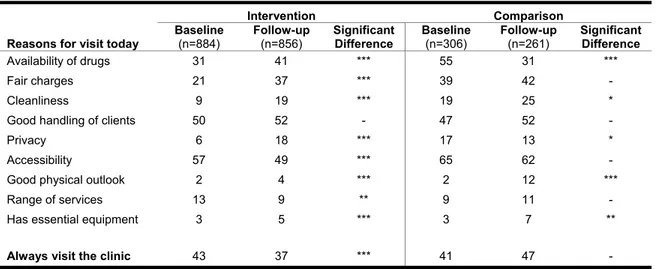
As seen in Table 2, the data display an overall positive trend among loan clinic respondents for the majority of indicators that measured reasons for clinic visit between baseline and follow-up. The proportion of clients who stated that they visited an intervention facility instead of an
alternate clinic due to the availability of drugs increased from 31 percent at baseline to 41 percent at follow-up. This same indicator showed a significant decrease for comparison clinics, dropping from 55 percent at baseline to 31 percent at follow-up. The proportion of respondents visiting intervention clinics due to a perceived fairness of charges also increased over time, rising from 21 percent at baseline to 37 percent at follow-up.
although this increase was not as dramatic (19 to 25 percent). Loan clinics also appeared to have a greater percentage of clients that chose their facility due to concerns regarding privacy. Eighteen percent of respondents reported electing an intervention clinic due to its ability to provide anonymous care, compared with only 6 percent of clients citing this reason for their visit at baseline. Conversely, clients visiting a comparison facility due to perceived privacy fell between the two survey rounds, from 17 to 13 percent.
Both comparison and intervention clinics exhibited significant increases in the number of client visits due to the good physical appearance of their facilities, as well as in the availability of essential equipment. The proportion of clients at intervention clinics that stated they always visit this facility decreased significantly between baseline and follow-up (from 43 to 37 percent). This same indicator among respondents utilizing comparison clinics showed no significant difference between the first and second impact assessments.
Client recommendations for improving their visit were also measured at each survey round. For these indicators, a decrease in the percentage of respondents at follow-up stating a need for improvement was the desired result. As seen in Table 3, the proportion of respondents visiting intervention clinics who felt they were charged an unfair amount decreased significantly from baseline (22 percent) to follow-up (13 percent).
Comparison clinics showed no significant favorable changes for the same set of indicators, with a greater proportion of respondents stating a need for improvement in four areas. (Four indicators also emerged for improvement at intervention clinics: availability of drugs, privacy, range of services offered, and presence of essential equipment.)
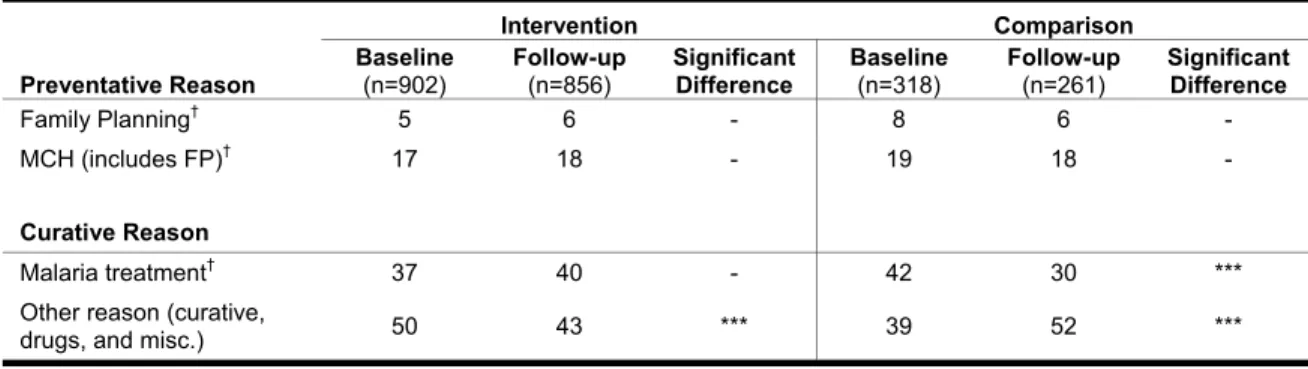
Table 4 examines the preventative and curative reasons for clinic visit between baseline and follow-up surveys in the intervention and comparison groups. Patients visit these clinics for both kinds of services, with roughly 25 percent of clients in both intervention and comparison clinics obtaining preventative care for the surveyed visit. Between 5 and 8 percent of all clinic visits were for family planning, regardless of clinic type.
Overall, only the proportion of clients stating their visit was due to “other reasons” showed significant trends, decreasing from 50 percent at baseline to 43 percent at follow-up among the intervention group, and increasing from 39 percent to 52 percent among respondents at
comparison clinics. Similarly, the percentage of clients visiting comparison clinics for malaria treatment decreased between the baseline (42 percent) and the follow-up (30 percent) surveys. Although not significant, this same indicator showed an upward trend among patients at intervention clinics (from 37 percent to 40 percent).
Midwives versus other providers
Tables 1 through 4 compare client perceptions at intervention and comparison clinics overall. The diverse range of providers receiving loans raises the question of whether the intervention may have had a more pronounced effect within one provider group. The first assessment of intervention impact (Agha et al., 2002) found that Summa loans improved perceived quality among clients of midwives, who made up the first cohort of loan recipients. But with only seven comparison clinics in the current assessment of a broader group of providers, it was not possible to stratify the analysis for midwives and other providers — stratification created comparison groups of only three and four clinics and produced very volatile comparison clinic estimates. Despite this limitation, the 22 intervention clinics surveyed do allow a revealing bivariate
comparison between midwife clinics and other provider clinics receiving loans. Tables 5 and 6 present this comparison with data for “reason for visit today” and “preventative and curative visits.”
Table 5 reveals a striking similarity in results for midwives and other providers receiving loans. Each group showed similar starting values and near identical changes for the categories
“Availability of Drugs,” “Fair Charges,” “Cleanliness,” and “Privacy.” Although results diverged for several of the other indicators, it is not possible to indicate why. Three divergent trends do, however, merit highlighting. First, midwives saw more clients choosing their clinics due to accessibility (increasing from 51 percent to 60 percent), while other providers saw a large drop (from 61 to 42 percent) in their clients citing accessibility as a reason for their visit. Second, while the percentage of clients visiting midwives due to the presence of essential equipment remained largely unchanged, other providers saw a modest increase (from 3 to 8 percent) of clients citing essential equipment as a reason for their visit. Finally, while the percentage of respondents who always visit the clinic decreased for both provider groups, midwives started with higher client loyalty and saw an insignificant drop. Other providers started from a lower level of loyalty and suffered a larger, significant drop.
Table 6 repeats the patterns of Table 5, with both provider groups generally displaying similar changes over the study period. For preventative visits, neither provider type saw a significant change in the percentage of clients visiting for family planning or MCH visits (although midwives do provide a substantially higher percentage of client visits for preventative reasons). The percentage of visits for malaria treatment did change for midwives, increasing from 36 percent to 42 percent, while malaria treatment visits for other providers stayed relatively flat, moving from 37 to 39 percent.
Multivariate results and impact assessment
The next step in the assessment was examining clients’ perceptions regarding quality of care using multivariate logistic regression models, controlling for individual-level characteristics that may bias the estimates. Adjusted odds ratios were separately computed for intervention and comparison groups in order to look at the changes in indicators over time, independent of clinic group. This allows the impact of the program itself to be examined, which indicates whether the observed changes in the outcomes can be attributed to the intervention. Net program impact was determined by the interaction model described in the Methodology section. The odds ratio for net impact was estimated by pooling all interviews from both intervention and comparison clinics, and indicates whether clients’ perceptions of quality at intervention clinics changed relative to comparison clinic perceptions over the study period.
Table 7 shows the adjusted odds ratios for the reasons the client chose the clinic in lieu of
another. Of particular interest is the significant increase in clients visiting intervention clinics due to the perceived availability of drugs.
Clients at intervention clinics were just over 1.5 times more likely in the follow-up than the baseline round to report availability of drugs as the reason for their current visit. Comparison clinic clients were about one-third as likely to state this reason. The observed difference resulted in a large net positive program impact, with clients at intervention clinics proving 4.2 times more likely than clients at comparison clinics to cite availability of drugs as the reason for clinic
The same trend emerged for the indicator measuring perceived privacy of client visit.
Respondents visiting loan clinics were over three times more likely at follow-up to state that they had chosen that particular clinic because of a confidential environment. In contrast, clients at comparison clinics became less likely to visit current clinic because of perceived privacy. These findings also produced a positive net program impact, with respondents surveyed at intervention clinics over five times more likely to cite privacy as the main reason for their visit.
The program also improved the likelihood of visiting an intervention clinic due to fair charges for services (just over 2 times more likely) and general cleanliness of the facility (about 2.5 times more likely). Again, these positive impact results represent the relative improvement of intervention clinics compared to comparison clinics between baseline and follow-up surveys.
Although clients at both comparison and intervention clinics proved more likely to cite the facility’s good physical appearance as a reason for their visit, this trend resulted in a net negative program effect. In this case, both groups showed improvement, but the comparison group showed an unusual 10 percent increase (from 2 to 12 percent) in clients identifying appearance as a reason for their visit. Finally, the net negative program effect on clients’ visit due to the perceived range of services derived from both a modest drop at intervention clinics and an insignificant increase at comparison clinics.
Over the study period, loan clinic clients proved less likely to report that they “always visit this clinic.” Although this result seems to suggest that loan clinics experienced a decline in client loyalty, further examination indicates that it stems from more clients reporting that they
“sometimes” use the clinic. Because the data consist of two cross sections, we cannot explicitly track an individual client’s clinic preferences. With two cross sections, a broadening of the clinic’s client base with more casual users would cause the percentage of clients who responded “always visit the clinic” to decline.
While the data cannot fully answer if this decline is attributed to lower client loyalty or to a broadening of the client base, the data collection format does allow a rough estimate of weekly utilization (since each sample includes all clients for a particular week). If the decline in loyalty comes from new clients, then utilization must have increased. In the year between the baseline and intervention surveys, loan clinics did see an average increase of five clients per week (a 12 percent average increase) over comparison clinics. While this finding does suggest that client flows have increased, the result applies only to the week of the sample and cannot be extrapolated to an annual estimate.
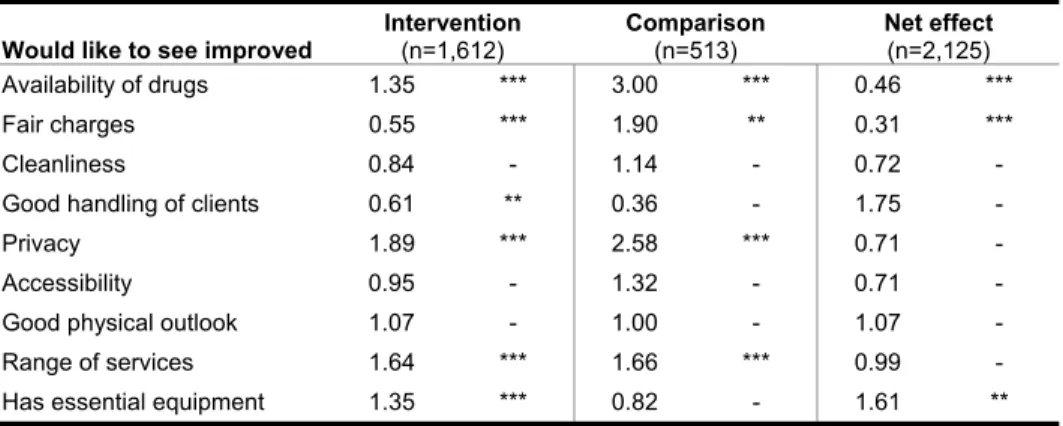
As observed in Table 8, intervention clinics have not been able to keep up with client
expectations. With the exception of Charges and Client Service, more clients would like to see improvements in follow-up for all categories. In the face of client expectations, the program did have a net positive effect on two indicators measuring elements of care that clients want
improved. In the first case, clients at intervention clinics were less than half as likely as comparison clinic clients to cite drug availability as an area needing improvement. Similarly, intervention clients were less than a third as likely as comparison clinic clients to cite fair charges as an area for improvement. More clients did, however, view the availability of essential facility equipment as an area for improvement at loan clinics.
Of particular importance in Table 8, clients at loan clinics were 0.31 times as likely to be concerned with fair service charges than comparison clinic clients. While the evaluation did not collect data on fees charged, if providers have raised fees to service their loans, clients show no
negative reaction. In fact, the percentage of respondents at loan clinics expressing concern about fair charges declined from 22 to 13 percent over the study period.
Table 9 examines the multivariate and net impact results for the preventative and/or curative reasons for client visit. As observed, clients at loan clinics were 1.2 times more likely to visit the facility for malaria-associated care at follow-up. Clients of comparison clinics, however, were less than two-thirds as likely to be at the clinic at follow-up for malaria treatment. These trends resulted in a net positive program effect, with a loan clinic client being nearly two times more likely to be seeking malaria treatment at follow-up. Program impact was also associated with the observed decrease in clinic visits for “other reasons.” This decrease reflects a compositional shift in visits away from the general “other reason” to the more specific “malaria treatment” category. Table 10 presents the determinants of whether a client “always visits this clinic.” This regression measures whether client loyalty has increased at loan clinics and which characteristics clients value most in choosing a preferred clinic.
As indicated by the “loan clinic at follow-up” variable, clients at follow-up were .45 times less likely to state that they always visit a loan clinic. As discussed in relation to Table 7, this apparent decrease in client loyalty includes the effect of mixing in an average of 12 percent more new clients at loan clinics at follow-up.
Of particular programmatic interest are the associations between clients’ reasons for their visit and continued loyalty. Respondents who cited availability of drugs as a reason for the clinic visit were 1.5 times more likely to always choose that loan clinic. Similarly, clients who perceived value in services received (fair charges) were 1.7 times more likely to frequent the same clinic. Perceived cleanliness of the loan clinics and the feeling that they were treated well were also positively associated with client loyalty and subsequent visits. Interestingly, visiting a clinic due to a perceived broad range of services and essential equipment were not important predictors for return to that facility.
Discussion
The main objective of Summa’s microfinance program has been to improve the viability of the small-scale practices of private health care providers who received one or more loans. The data suggest that the program achieved this goal. Improved viability rests on new revenue from more consistent availability of drugs and an increase in utilization relative to comparison clinics. Improvements in clients’ perceived quality of care were expected to lead to improved client flows through the retention of current clients and an increase in new clients. Similarly, an improvement in the range of services and the availability of drugs was expected to broaden revenue sources available to the clinic. This study used data on respondents’ perceived quality-of-care utilization preferences to examine the program’s success in both of these dimensions. The perceived quality at follow-up did improve for loan recipients, with clients at loan clinics being 4.2 times as likely to choose that provider due to drug availability, 2.0 times as likely for fair charges, 1.6 times for cleanliness, and 5.2 times as likely for confidentiality.
Despite the improvements in perceived quality, the changes led to mixed results for client loyalty. At follow-up, loan clinic respondents were only half as likely to “always visit that clinic.” Closer examination of the data suggests, however, that this change may stem from more clients reporting that they “sometimes” use the clinic. As the program hoped, loan clinics did seem to attract new clients — while the data allowed only a partial answer to this question, data collection did provide a rough weekly utilization estimate (since all clients in a given week were interviewed). The comparison between baseline and follow-up surveys showed that loan clinics saw an average increase of five clients per week (a 12% average increase) over comparison clinics. While this finding indicates that client flows did increase for the interview week, the result cannot be extrapolated to an annual estimate.
Along with improved perceived quality and utilization, the assessment shows that the program appears to strengthen revenue, contributing significantly to future loan clinic viability. Despite perceptions about the range of services and the presence of essential equipment remaining largely unchanged over the study period, respondents were four times as likely to cite drug availability in the up survey as the reason for their loan clinic choice. This finding coincides with follow-up loan clinic clients being half as likely to cite drug availability as an area needing improvement. The new perception of these clinics as reliable drug outlets will provide an enhanced and
sustainable revenue stream for these providers.
While the evaluation did not collect data on fees charged, if providers have raised fees to service their loans, clients show no negative reaction. In fact, loan clinic clients at follow-up were twice as likely to base their clinic choice on a perception that it charged fair price for its services. These results imply that the loan program successfully improved the financial viability of these providers. In addition, the findings suggest the program achieved some success in reaching the broader goal of improving public health outcomes. The data strongly suggest that the majority of recipients have invested a portion of loan proceeds in pharmaceuticals. With high levels of malaria infection in Uganda, pharmaceutical investments are likely to have responded to high demand for malaria drugs. This investment in pharmaceuticals can explain loan clinic
respondents being 1.9 times as likely to visit the clinic for malaria treatment at follow-up.
The loans found less success in increasing preventative visits. The results found no change at loan clinics for the percentage of respondents seeking preventative or family planning services.
Although the loans showed no impact on family planning utilization, it is nevertheless important to remember that they have strengthened the supply of reproductive health (RH) services
available from the private sector in Uganda. In case of a future setback in public-sector resources, these private providers will remain a viable source of RH services to Ugandan women.
Limitations
The preceding results hinge on several key assumptions. First, these findings should be viewed as a case study and cannot be generalized to a broader clinic population. This assumption allowed each clinic to be treated as a separate stratum in the standard error calculations. In order to generalize the results, a substantially larger random sample of clinics would be needed. Furthermore, this evaluation cannot determine whether clinics not included in the study would respond to loans in a similar manner. If similar loans were disbursed to a random cohort of clinics, the program effects may prove weaker.
Finally, the evaluation includes some methodological limitations. First, the analysis relies on clients’ perceptions of quality. As discussed in the introduction, clients’ perceptions may introduce biases into the analysis. In particular, the perceptions are subjective. Improved drug availability is based on the client’s opinion, and expectations may change over the study period. Additionally, the client data could only suggest how the loans were applied; the evaluation could only infer that the increased availability of drugs referred to malaria pharmaceuticals.
References
Agha, S; A Balal; and F Ogojo-Okello. 2002. The Impact of a Microfinance Program on Client Perceptions of the Quality of Care Provided by Private Sector Midwives in Uganda. Washington, DC: USAID/Commercial Market Strategies Project.
Hulme, D and P Mosley, eds. 1996. Finance Against Poverty. Vol 1: “Analysis and Recommendations.” London: Routledge.
Mills, A; R Brugha; K Hanson; and B McPake. “What can be done about the private health sector in low-income countries?” Bulletin of the World Health Organization, 2002: 80: 325-330.
Root, G; A Collins; M Kaendi; and K Sargen. Roll Back Malaria Scoping Study. January/February, 2003. Malaria Consortium.
SEATS (Family Planning Service Expansion and Technical Support Project). 2000. Uganda Final Country Report. Arlington, VA: John Snow International.
Summa Foundation. n.d. Can a Revolving Loan Fund Be Used to Encourage Private Midwifery Practices? Case study: Indonesia Midwives Loan Fund. Washington DC: USAID/Commercial Market Strategies Project.
Uganda Bureau of Statistics and ORC Macro. 2001. Uganda Demographic and Health Survey 2001. Calverton, MD.
UNAIDS. February, 2004. Uganda: Epidemiological Fact Sheets on HIV/AIDS and Sexually Transmitted Infections. United Nations.
Appendix I: Report Tables
Table 1: Socio-demographic characteristics of clients at baseline (N=1270) Intervention (n=967) Comparison (n=303) Significant Difference Mean age 28.0 27.3 -
Gender (percent distribution) -
Male 41 37
Female 59 63
Marital status (percent distribution) **
Never married 35 36
Married 59 61
Other 7 3
Education (percent distribution) **
None, some primary 16 18 Completed primary 12 19
Some secondary 37 35
Completed secondary or higher 34 28
Usual sources of treatment (percent
distribution) ***
Public hospital/clinic 13 8 Private hospital/clinic 82 80
Pharmacy 1 1
Drug shop 3 11
Lives in neighborhood (percent
distribution -
Yes 78 81
No 22 19
Mean number of individuals in household 5.0 4.5 ***
Mean household expenditures (Schillings)
On rent and food 136,619 117,870 ***
Per capita 34,918 30,548 ***
Respondent currently uses FP (percent
distribution) 47 42 -
*** Significant at the α=0.01 confidence level ** Significant at the α=0.05 confidence level * Significant at the α=0.10 confidence level
Table 2: Clients stating reason for visiting the clinic rather than another clinic, at baseline and follow-up (percent)
Intervention Comparison
Reasons for visit today
Baseline (n=884) Follow-up (n=856) Significant Difference Baseline (n=306) Follow-up (n=261) Significant Difference Availability of drugs 31 41 *** 55 31 *** Fair charges 21 37 *** 39 42 - Cleanliness 9 19 *** 19 25 *
Good handling of clients 50 52 - 47 52 -
Privacy 6 18 *** 17 13 *
Accessibility 57 49 *** 65 62 -
Good physical outlook 2 4 *** 2 12 ***
Range of services 13 9 ** 9 11 -
Has essential equipment 3 5 *** 3 7 **
Always visit the clinic 43 37 *** 41 47 -
*** Significant at the α=0.01 confidence level ** Significant at the α=0.05 confidence level * Significant at the α=0.10 confidence level
Table 3: Clients stating recommendations for improving clinic visit at baseline and follow-up (percent)
Intervention Comparison
Would like to see improved
Baseline (n=884) Follow-up (n=856) Significant Difference Baseline (n=306) Follow-up (n=261) Significant Difference Availability of drugs 21 27 *** 11 28 *** Fair charges 22 13 *** 9 15 ** Cleanliness 10 11 - 10 11 -
Good handling of clients 5 3 ** 3 1 -
Privacy 11 18 *** 10 24 ***
Accessibility 2 2 - 1 2 -
Good physical outlook 28 29 - 47 47 -
Range of services 26 37 *** 22 33 ***
Has essential equipment 31 38 *** 33 30 -
Note: A decrease in the percentage of respondents at follow-up stating a need for improvement was the desired result *** Significant at the α=0.01 confidence level
** Significant at the α=0.05 confidence level * Significant at the α=0.10 confidence level
Table 4: Preventative and curative reasons for visiting clinics at baseline and follow-up (percent) Intervention Comparison Preventative Reason Baseline (n=902) Follow-up (n=856) Significant Difference Baseline (n=318) Follow-up (n=261) Significant Difference Family Planning† 5 6 - 8 6 - MCH (includes FP)† 17 18 - 19 18 - Curative Reason Malaria treatment† 37 40 - 42 30 ***
Other reason (curative,
drugs, and misc.) 50 43 *** 39 52 ***
†Note: MCH/FP and Malaria not exclusive
*** Significant at the α=0.01 confidence level ** Significant at the α=0.05 confidence level * Significant at the α=0.10 confidence level
Table 5: Clients stating reason for visiting the clinic rather than another clinic, at baseline and follow-up for midwives and other providers receiving loans (percent)
Midwives Receiving Loans Other Providers Receiving Loans Reasons for visit today
Baseline (n=299) Follow-up (n=351) Significant Difference Baseline (n=585) Follow-up (n=505) Significant Difference Availability of drugs 29 41 *** 33 41 *** Fair charges 21 40 *** 22 35 *** Cleanliness 10 17 *** 9 20 ***
Good handling of clients 53 47 - 49 56 **
Privacy 5 18 *** 6 17 ***
Accessibility 51 60 ** 61 42 ***
Good physical outlook 4 4 - 1 5 ***
Range of Services 11 15 - 14 6 ***
Has Essential Equipment 3 2 - 3 8 ***
Always visit the clinic 47 42 - 40 33 **
*** Significant at the α=0.01 confidence level ** Significant at the α=0.05 confidence level * Significant at the α=0.10 confidence level
Table 6: Preventative and curative reasons for visiting clinics at baseline and follow-up for Midwives and Other Providers Receiving Loans (percent)
Midwives Receiving Loans Other Providers Receiving Loans
Preventative Reason Baseline (n=304) Follow-up (n=351) Significant Difference Baseline (n=598) Follow-up (n=505) Significant Difference Family planning† 6 8 - 4 4 - MCH (includes FP)† 23 20 - 14 16 - Curative Reason Malaria treatment† 36 42 * 37 39 -
Other reason (curative,
drugs, and misc.) 47 39 ** 52 46 **
†Note: MCH/FP and Malaria not exclusive
*** Significant at the α=0.01 confidence level ** Significant at the α=0.05 confidence level * Significant at the α=0.10 confidence level
Table 7: Adjusted odds ratios indicating changes in reasons for visiting the clinic rather than another clinic between baseline and follow-up, and net effects of the intervention (n=2,278)
Reasons for visit today
Intervention (n=1,729) Comparison (n=549) Net effect (n=2,278) Availability of drugs 1.55 *** 0.37 *** 4.21 *** Fair charges 2.16 *** 1.11 - 1.96 *** Cleanliness 2.26 *** 1.46 * 1.60 **
Good handling of clients 1.08 - 1.22 - 0.90 -
Privacy 3.63 *** 0.66 * 5.17 ***
Accessibility 0.73 *** 0.87 - 0.83 -
Good physical outlook 2.21 *** 6.17 *** 0.38 * Range of services 0.71 ** 1.28 - 0.57 * Has essential equipment 1.98 *** 2.75 ** 0.90 -
Always visit the clinic 0.73 *** 1.39 * 0.51 ***
*** Significant at the α=0.01 confidence level ** Significant at the α=0.05 confidence level * Significant at the α=0.10 confidence level
Table 8: Adjusted odds ratios indicating changes in recommendations for improving intervention clinic between baseline and follow-up, and net effects of the intervention (n=2,125)
Would like to see improved Intervention (n=1,612)
Comparison (n=513) Net effect (n=2,125) Availability of drugs 1.35 *** 3.00 *** 0.46 *** Fair charges 0.55 *** 1.90 ** 0.31 *** Cleanliness 0.84 - 1.14 - 0.72 -
Good handling of clients 0.61 ** 0.36 - 1.75 -
Privacy 1.89 *** 2.58 *** 0.71 -
Accessibility 0.95 - 1.32 - 0.71 -
Good physical outlook 1.07 - 1.00 - 1.07 - Range of services 1.64 *** 1.66 *** 0.99 - Has essential equipment 1.35 *** 0.82 - 1.61 **
*** Significant at the α=0.01 confidence level ** Significant at the α=0.05 confidence level * Significant at the α=0.10 confidence level
Table 9: Adjusted odds ratios indicating changes in preventative and curative reasons for clinic visit between baseline and follow-up, and net effect of the intervention (n=2,307)
Preventative Reason Intervention (n=1,747) Comparison (n=560) Net effect (n=2,307)
Family planning 1.05 - 0.63 - 1.54 -
MCH (includes FP) 0.97 - 0.94 - 1.10 -
Curative Reason
Malaria treatment 1.17 * 0.63 *** 1.86 *** Other reason (curative,
drugs, and misc.) 0.77 *** 1.71 *** 0.45 *** *** Significant at the α=0.01 confidence level
** Significant at the α=0.05 confidence level * Significant at the α=0.10 confidence level
Table 10: Adjusted odds ratios indicating factors associated with always visiting the clinic (n=2,273)
Variable Odds Ratio
Loan Group at follow-up 0.45 *** Loan Group 1.45 ***
Follow-up 1.36 *
Age 1.01 ***
Female 1.36 ***
Married 1.22 **
Expenditure per capita1 1.01 - Education2
Less than Secondary 0.89 - Finished Secondary 0.53 ***
Reason for Visit
Availability of drugs 1.48 *** Fair charges 1.72 ***
Cleanliness 1.50 ***
Good handling of clients 2.31 ***
Privacy 0.77 *
Accessibility 1.22 **
Good physical outlook 1.32 - Range of Services 0.89 - Has Essential Equipment 0.74 -
1 Thousands of Ugandan Schillings 2 No Education is the base category.
*** Significant at the α=0.01 confidence level ** Significant at the α=0.05 confidence level * Significant at the α=0.10 confidence level
Appendix II: Baseline Questionnaire
COMMERCIAL MARKET STRATEGIES PROJECT SUMMA LOAN M&E EXIT QUESTIONNAIRE
Hello, my name is _______________ from the Institute of Public Health and I am part of a team of people who are carrying out a survey on health issues in this area. We are talking to people visiting this and other health units to learn more about their health needs. This will last about 15 minutes. Your answers will remain confidential and we will not take down your name or address. May I ask you some questions?
SECTION A: BACKGROUND INFORMATION
1. Interviewer's name____________________________________________ Date of interview ___/ ___/ ___/
Interviewer: The interviewer is to directly observe and record answers to Questions 2-5. 2. District Kampala Mukono Mpigi Wakiso Kayunga Masaka 1 2 3 4 5 6
3. Neighborhood City center
Commercial Residential Rural village 1 2 3 4
4. Type of outlet Out-patient clinic only
In-patient & outpatient clinic Drug store Pharmacy 1 2 3 4
5. Respondent’s gender Male
Female 1 2
6. Marital status Married
Never married Divorced Separated Widowed No response 1 2 3 4 5 7. Do you live in this neighborhood Yes
No
No response
1 2 8. What is the highest level of education you have
attained Some primary Completed primary Some secondary Completed secondary College/institution University
Never attended school
1 2 3 4 5 6 7
9. How old are you (write exact age, ask all individuals visiting the unit
alone; ask oldest individual in a group/family visit) Don’t know
Undisclosed
/_____/ 98 99
10.What is your main occupation
(One answer only) Peasant farmer Large-scale farmer Businessman/woman Employed (private sector) Employed in public sector Unemployed No response 1 2 3 4 5 6 11. What is the main occupation of your spouse? (See Q. 6)
(One answer only) Peasant farmer Large-scale farmer Businessman/woman Employed (private sector) Employed in public sector Unemployed 1 2 3 4 5 6 11 b. How many people in total live in your household, including yourself? (Write
the number) /______/
11 c. Approximately how much money does your household spend each month on the following?
Food Rent
/___/___/___/___/___/___/ /___/___/___/___/___/___/
SECTION B: SERVICE UTILIZATION
12. Are you currently using any type of family planning? Yes No
No response
1 > to Q15 2 > to Q13 13. Do you intend to adopt a family planning method in the next 12 months? Yes
No
No response
1 2 14. Have you ever used any type of family planning before? Yes
No
No response
1>to Q.16 2>to Q.17 15. From which of the following outlets do you currently get your family
planning services (Read out) (Multiple answers possible)
Public hospital/clinic This outlet Private hospital/clinic Pharmacy Drug shop Traditional healer GM shop Other SP.__________ Don't know No response 1 2 3 4 5 6 7
16. Have you ever obtained family planning services from a public sector health
Antenatal Postnatal Immunization Delivery
Child nutrition/ growth monitoring AIDS/STI counseling STI treatment Malaria treatment Other sp. ___________ No response 03 04 05 06 07 08 09 10 11 18. Other than today, when was the last time you visited this outlet?
(One answer only) Within the past 4 weeks 4 to 8 weeks ago 8 to 12 weeks ago 12 to 16 weeks ago More than 16 weeks ago Never visited before Don't know No response 1 2 3 4 5 6> to Q20 19. What was the reason(s) for your last visit to this outlet
(Multiple answers possible)
Start FP user Repeat FP user Antenatal Postnatal Immunization Delivery
Child nutrition/ growth monitoring AIDS/STI counseling STI treatment Malaria treatment Other sp. ___________ Don't know No response 01 02 03 04 05 06 07 08 09 10 11 20. Where do you normally go for treatment when you are sick or
when you need health services? (One answer only, Read out) Public hospital/clinic Private hospital/clinic Pharmacy Drug shop GM shop Traditional healer Other sp. ___________ 1 2 3 4 5 6 7 21. The last time you were sick, where did you go to obtain treatment?
(More than one answer possible) Public hospital/clinic Private hospital/clinic Pharmacy Drug shop GM shop Traditional healer Other sp., ___________ Can’t Remember Don't know No response 1 2 3 4 5 6 7 8
SECTION C: SERVICE SATISFACTION (Ask all respondents)
22. How did you come to know about this provider? Family / friends who visited the provider and were satisfied with the service received
Clinic signboard Other sp_______________________________ No response 1 2 3 23. Could you please give me all the reasons that you
came to this outlet today instead of any other? (Spontaneous answers only, Multiple answers
possible)
Cleanliness/hygiene Availability of drugs Has essential equipment Good handling of clients Fair charges
Good physical outlook Range of services Privacy Easily accessible Other sp._____________ Don't know No response 01 02 03 04 05 06 07 08 09 10
24. How often do you visit this outlet for treatment or
health services? (Read out) See Q.18 Always Sometimes Never visited before Don't know No response 1 2 3 Ve ry sa tisfi ed Somewhat satisfi ed Somewhat dissa tisfi ed Very dissa tisfi ed No op ini on Don' t k now No res pons e Cleanliness/hygiene Availability of drugs Essential equipment Handling of clients Charges Physical outlook Range of services Privacy Accessibility 1 1 2 2 3 3 4 4 5 5 6 6 7 7 8 8 9 9 1 1 2 2 3 3 4 4 5 5 6 6 7 7 8 8 9 9 1 1 2 2 3 3 4 4 5 5 6 6 7 7 8 8 9 9 1 2 3 4 5 6 7 8 9 25. I’d like to know whether you are very satisfied,
somewhat satisfied, somewhat dissatisfied, or very dissatisfied with the services you get from this outlet. How satisfied are you with…(read out each
response, code one answer only for each response category, do not explicitly tell respondent they have the option to answer “no opinion or don’t know” but do code if this is their spontaneous response)
26. What areas, if any, would you like improved in this outlet to make you a more satisfied client? (Multiple
answers possible, do not read out, probe in detail) Cleanliness/hygiene Drugs availability Essential equipment Handling of clients Treatment/service charges Physical outlook Range of services Level of privacy Accessible Other sp ______________________________ 01 02 03 04 05 06 07 08 09 10
27. Taking everything into consideration, how satisfied are you with the facilities and services provided in this outlet? (One answer only)
Very satisfied Just satisfied Not satisfied Don' t know No response 1 2 3
Appendix III: Follow-up Questionnaire
COMMERCIAL MARKET STRATEGIES PROJECT
SUMMA LOAN M&E EXIT QUESTIONNAIRE
Hello, my name is _______________ from the Institute of Public Health and I am part of a team of people who are carrying out a survey on health issues in this area. We are talking to people visiting this and other health units to learn more about their health needs. This will last about 15 minutes. Your answers will remain confidential and we will not take down your name or address. May I ask you some questions?
SECTION A: BACKGROUND INFORMATION
1. Interviewer's name____________________________________________ Date of interview ___/___/___/ Interviewer: The interviewer is to directly observe and record
answers to Questions 2-5. 2. District Kampala Mukono Mpigi Wakiso Kayunga Masaka 1 2 3 4 5 6
3. Neighborhood City center
Commercial Residential Rural village 1 2 3 4
4. Type of outlet Out-patient clinic only
In-patient & outpatient clinic Drug store Pharmacy 1 2 3 4
5. Respondent’s gender Male
Female 1 2
6. Marital status Married
Never married Divorced Separated Widowed No response 1 2 3 4 5 99
7. Do you live in this neighborhood Yes
No
No response
1 2 99
8. What is the highest level of education you have
attained Some primary Completed primary
Some secondary Completed secondary College/institution University
Never attended school No response 1 2 3 4 5 6 7 9. How old are you (write exact age, ask all individuals visiting the
unit alone; ask oldest individual in a group/family visit) Don’t know
Undisclosed
/_____/ 98 99 10. What is your main occupation
(One answer only) Peasant farmer Large-scale farmer
Businessman/woman Employed (private sector) Employed in public sector Unemployed No response 1 2 3 4 5 6 99 11. What is the main occupation of your spouse? (See Q. 6)
(One answer only) Peasant farmer Large-scale farmer
Businessman/woman Employed (private sector) Employed in public sector Unemployed 1 2 3 4 5 6 11 b. How many people in total live in your household, including yourself?
(Write the number) /______/
11 c. Approximately how much money does your household spend each month on the following?
Food Rent /___/___/___/___/___/___/ /___/___/___/___/___/___/
SECTION B: SERVICE UTILIZATION
12. Are you currently using any type of family planning? Yes
No
No response
1 > to Q15 2 > to Q13 99 13. Do you intend to adopt a family planning method in the next 12
months? Yes No
No response
1 2 99
14. Have you ever used any type of family planning before? Yes
No
No response
1>to Q.16 2>to Q.17 99 15. From which of the following outlets do you currently get your family
planning services (Read out) (Multiple answers possible)
Public hospital/clinic Private hospital This outlet 1 2 3
Other private clinic Pharmacy Drug shop Traditional healer GM shop Other SP.________________ Don’t know No response 4 5 6 7 8 98 99 16. Have you ever obtained family planning services from a public
sector health facility (e.g. Public hospital/clinic)? Yes No
No response
1 2 99 17. For what reason(s) did you visit this outlet today?
(Multiple answers possible) Start FP user Repeat FP user
Antenatal Postnatal Immunization Delivery
Child nutrition/ growth monitoring AIDS/STI counseling STI treatment Malaria treatment Other sp. ___________ No response 01 02 03 04 05 06 07 08 09 10 11 99 18. Other than today, when was the last time you visited this outlet?
(One answer only) Within the past 4 weeks 4 to 8 weeks ago
8 to 12 weeks ago 12 to 16 weeks ago More than 16 weeks ago Never visited before Don't know No response 1 2 3 4 5 6> to Q20 98 99 19. What was the reason(s) for your last visit to this outlet
(Multiple answers possible) Start FP user Repeat FP user
Antenatal Postnatal Immunization Delivery
Child nutrition/ growth monitoring AIDS/STI counseling STI treatment Malaria treatment Other sp. ___________ Don't know No response 01 02 03 04 05 06 07 08 09 10 11 98 99
Drug shop GM shop Traditional healer Other sp. ___________ 5 6 7 21. The last time you were sick, where did you go to obtain treatment?
(More than one answer possible) Public hospital/clinic Private hospital
Private clinic Pharmacy Drug shop GM shop Traditional healer Other sp., ___________ Can’t Remember Don't know No response 1 2 3 4 5 6 7 8 98 99
SECTION C: SERVICE SATISFACTION (Ask all respondents)
22. How did you come to know about this provider? Family / friends who visited the provider and were
satisfied with the service received Clinic signboard Other sp_______________________________ No response 1 2 3 99 23. Could you please give me all the reasons that you
came to this outlet today instead of any other? (Spontaneous answers only, Multiple answers possible)
Cleanliness/hygiene Availability of drugs Has essential equipment Good handling of clients Fair charges
Good physical outlook Range of services Privacy
Easily accessible
Skill/competence of health provider Reputation of clinic Other sp._____________ Don't know No response 01 02 03 04 05 06 07 08 09 10 11 98 99
24. How often do you visit this outlet for treatment or
health services? (Read out) See Q.18 Always Sometimes
Never visited before Don't know No response 1 2 3 98 99
Ve ry sa tisfi ed So m ewha t sa tisfi ed Somewhat dissa tisfi ed Ve ry d issa tisfi ed No opinion Don' t k now No res pons e Cleanliness/hygiene Availability of drugs Essential equipment Handling of clients Charges Physical outlook Range of services Privacy Accessibility Skill/competence of health provider Reputation of clinic 1 2 3 4 5 6 7 8 9 10 11 1 2 3 4 5 6 7 8 9 10 11 1 2 3 4 5 6 7 8 9 10 11 1 2 3 4 5 6 7 8 9 10 11 1 2 3 4 5 6 7 8 9 1 0 1 1 1 2 3 4 5 6 7 8 9 10 11 1 2 3 4 5 6 7 8 9 10 11 25. I’d like to know whether you are very satisfied,
somewhat satisfied, somewhat dissatisfied, or very dissatisfied with the services you get from this outlet. How satisfied are you with…(read out each response, code one answer only for each response category, do not explicitly tell respondent they have the option to answer "no opinion or don't know but do code if this is their spontaneous response)
26. What areas, if any, would you like improved in this outlet to make you a more satisfied client? (Multiple answers possible, do not read out, probe in detail) Cleanliness/hygiene Drugs availability Essential equipment Handling of clients Treatment/service charges Physical outlook Range of services Level of privacy Accessible
Skill/competence of health provider Reputation of clinic Other sp ______________________________ Don't know No response 01 02 03 04 05 06 07 08 09 10 11 98 99 27. Taking everything into consideration, how
satisfied are you with the facilities and services provided in this outlets? (One answer only)
Very satisfied Just satisfied Not satisfied Don' t know No response 1 2 3 98 99 THANK YOU VERY MUCH FOR PARTICIPATING IN THIS RESEARCH