Inter-American Development Bank Banco Interamericano de Desarrollo (BID)
Research department Departamento de investigación
Working Paper #434
Natural Disasters in Latin America
and the Caribbean:
An Overview of Risk
ByCéline Charvériat
Inter-American Development Bank
Cataloging-in-Publication data provided by the Inter-American Development Bank
Felipe Herrera Library
Charvériat, Céline.
Natural disasters in Latin America and the Caribbean : an overview of risk / by Céline Charvériat.
p. cm. (Research Department Working papers series ; 434) Includes bibliographical references.
1. Natural disasters--Latin America--Economic aspects. 2. Natural disasters--Caribbean Area--Economic aspects. 3. Emergency management--Latin America. 4. Emergency
management--Caribbean Area. I. Inter-American Development Bank. Research Dept. II. Title. III. Series.
363.34 C86--dc21
82000
Inter-American Development Bank 1300 New York Avenue, N.W. Washington, D.C. 20577
The views and interpretations in this document are those of the authors and should not be attributed to the Inter-American Development Bank, or to any individual acting on its behalf. The Research Department (RES) publishes the Latin American Economic Policies Newsletter, as well as working papers and books, on diverse economic issues. To obtain a complete list of RES publications, and read or download them please visit our web site at:
Acknowledgments
The author wants to thank the following individuals for their guidance and useful comments: Jim Bruce, Caroline Clarke, Suzanne Duryea, Luis García, Alejandro Gaviria, Eduardo Lora, Sergio Mora-Castro and Naoko Shinkai.
TABLE OF CONTENTS Introduction
1 Natural Disaster Risk in Latin America and the Caribbean: Impact, Dynamics and Distribution
1.1 The Human and Economic Impact of Natural Disasters in Latin America and the Caribbean
1.1.1 The Impact of Disasters on Household Welfare 1.1.2 The Impact of Disasters at the Aggregate Level
1.1.2.1 The Direct and Indirect Cost of Disasters: Theory and Empirical Evidence
1.1.2.2 The Effect of Disasters on Short-Term Macroeconomic Performance
- Theoretical Elements - Empirical Evidence
- Explaining Variations of Macroeconomic Impact: Key Variables
1.1.2.3 The Longer-Term Economic and Social Impact of Disasters
- Growth Effects - Distributional Effects
1.2 Risk Trends: Disaster Occurrence and Impact over Time 1.3 The Geographical Distribution of Risk
1.3.1 Within Latin America and the Caribbean
1.3.2 The Latin American and Caribbean Region and the World
2 Sources of Natural Disaster Risk In Latin America and the Caribbean 2.1 Sources of Disasters: A Conceptual Framework
2.2 Natural Hazards Occurrence in Latin America and the Caribbean 2.2.1 Natural Hazards: General Characteristics
2.2.2 Natural Hazards in Latin America and the Caribbean
2.2.2.1 Hazard Distribution and Relative Impact in the Region: Empirical Evidence
2.2.2.2 Sources of Hazards in the Region
- Seismic, Volcanic and Geologic Hazards - Meteorological and Hydrological Hazard
2.2.3 Future Hazard Occurrence in the Region: The Impact of Climate Change 2.3 Vulnerability of Exposed Elements
2.3.1 Vulnerability: Theoretical elements
2.3.2 Sources of Socio-Economic Vulnerability in LAC: The Pattern of the Region’s Development
- Demographic Growth, Distribution and Migration Patterns - Urban Growth and Emergence of Mega-Cities
- Persistence of Widespread Poverty - Environmental Degradation
3. Risk Management
3.1 Risk Management: A Basic Framework 3.2 Risk Management Options
3.2.1 Risk Management Strategies at Household and Community Level 3.2.1.1 Risk Reduction
3.2.1.2 Risk Coping Mechanisms 3.2.2 Public Policy Options
3.3.1.1 Risk Identification
3.3.1.2 Prevention and Mitigation 3.3.2.1 Preparedness
- Physical and Institutional Preparedness - Financial Preparedness
3.3 Risk Management in the Region: Strengths and Weaknesses 3.3.1 Risk Identification
3.3.2. Disaster Prevention and Mitigation
- Infrastructure Construction and Maintenance
- Land Use, Development and Housing in Urban Areas
- Environment and Natural Resources Management
3.3.3. Preparedness
3.3.4. Emergency and Reconstruction
3.4 Improving Public Policy: Finding the Adequate Policy Mix 3.4.1 Risk Reduction or Post-Disaster Response?
3.4.2 What Type of Risk Reduction?
3.4.3 The Share of Responsibilities Between Local, Regional and National Levels
3.4.4 Direct Intervention or Market-Based Solutions? Conclusion
Introduction
In the last five years, the Latin American and Caribbean region suffered from several large natural disasters whose magnitude, in terms of fatalities and damages, has renewed national governments’ and international donors’ interest in better managing risk.
Natural disasters, though, are hardly a novelty in the region. They have had a considerable importance in its history and its economic development. Historians now believe that an unusually long and severe drought was a primary cause of the disappearance of the Maya civilization.1 During the past thirty years alone, there have been an average of 32.4 disasters per
year, which have caused a total of 226,000 fatalities (or around 7,500 deaths a year) in the region. In addition to causing fatalities, homelessness and injuries, natural disasters have represented an enormous cost for the countries affected and the international community. In this paper, we estimate that the annual average cost between 1970 and 1999 ranges between $700 million and $3.3 billion. Due to the disruption of economic activity and the loss of capital assets they provoke, natural disasters have had negative short-term effects on GDP growth. In many instances, disasters have also resulted in longer-term economic consequences, such as slower growth, higher indebtedness and higher regional and income inequality. Environmental and social costs, though more difficult to assess in monetary terms, have also been substantial.
Natural disasters can be defined as temporary events triggered by natural hazards that overwhelm local response capacity and seriously affect the social and economic development of a region.2 The sources of risk in the region are both natural and man-made. Because of its
geographical conditions, the region is prone to natural events of severe intensity. But the large economic and human cost associated with these natural events is mainly the result of extreme vulnerability. This vulnerability stems from the pattern of socioeconomic development in the region as well as inadequate risk management policies.
Despite renewed preventative efforts at regional and international levels, the risk associated with natural events has not decreased. Economic costs can be expected to increase, as economic assets accumulate and economic interdependence reaches new levels. While the human toll taken by disasters has remained more or less stable, it is unlikely to decrease because of the persistence of widespread poverty, continuing demographic growth and migration towards coasts and mega-cities. Finally, preliminary evidence regarding climate change seems to indicate that the probability of occurrence of severe weather events will rise in the region.
Rather than taking a proactive approach towards risk management focused on risk reduction and preparedness, the region continues to rely upon costly reconstruction processes and post-disaster international assistance. This reactive stance is not only costly in terms of lives and destroyed assets, but also appears largely unsustainable as worldwide international assistance decreases and natural disaster proneness increases everywhere. This is why the improvement of risk management appears essential to guarantee the protection and future progress of economic and social development in the region.
1
Hodell, Curtis and Brenner (1995).
2
After presenting empirical evidence of the substantial impact of natural disasters in the region, this paper examines occurrence trends and the geographical distribution of risk (Section 1). The paper then analyzes the natural as well as man-made sources of natural disasters (Section 2) before exploring risk management options and practices for the region (Section 3).
1 Natural Disaster Risk in Latin America and the Caribbean: Impact, Trend
and Distribution
In this first section we analyze the characteristics of the risk of natural disasters by studying their impact on household and aggregate welfare, trends in terms of frequency and impact, and their geographical distribution.
1.1 The Human and Economic Impact of Natural Disasters in Latin America and the Caribbean
1.1.1 The Impact of Disasters on Household Welfare
From a household perspective, natural disasters can represent a multifaceted shock to welfare. There are three categories of impact on an individual or household’s welfare: physical integrity, assets and income. Adverse effects are usually combined and occur at a time when individuals are out of their familiar environment, community solidarity is unlikely, and public services unavailable or severely disrupted. These factors contribute to magnifying the overall adverse impact on welfare. Even if the physical event experienced by the community might be the same, there is certainly an idiosyncratic aspect to its impact. Not all households and individuals are affected in the same way, depending on their degree of vulnerability, perception of risk, and capacity to mitigate risk and cope with the consequences of the disaster.
The direct impacts of disasters on an individual’s physical integrity include fatalities, injuries, sickness and violence. Fatalities are a direct and immediate effect of the disaster, as buildings collapse and flows of water, mud or debris carry people away. Fatalities, which constitute a permanent shock to a household’s welfare, leave individuals orphaned and widowed at a time when community and extended family solidarity might not be available. According to available disaster statistics (see Box 1.1), natural disasters have caused an estimated 464,000 fatalities in the Latin American and Caribbean region, over the century, and an estimated 226,000 fatalities over the last 30 years, or an average of 7,500 fatalities per year in the Latin American and Caribbean region.
Box-1.1. A Word of Caution about Disaster Statistics
Analyzing natural disasters is especially difficult due to the lack of information about occurrence of hazards and detailed analysis of the cost of disasters. The database used in this chapter is the EM-DAT database developed by the Center for the Epidemiological Study of Disasters (CRED) of the Catholic University of Louvain in Belgium. In this database, natural disasters are defined as natural hazards, which have caused of 10 or more fatalities, affected 100 or more people or resulted in a call for international assistance or the declaration of a state of emergency.3 The database includes the following types of natural hazards: drought, earthquakes, extreme temperature, famine (natural), flood, insect infestation, slides, volcano, wave/surge, wildfire, wind storms and epidemics.4
The database covers all natural disasters for the entire world over the 1900-1999 period but suffers from underreporting, especially for the 1900-1970 period. To minimize this bias, we focus our analysis on the last 30 years, where the quality and amount of information available has become significantly better. This period is sufficiently long to provide some indication about the rate of occurrence of natural hazards and probably represents the time basis used by populations and governments to assess risk and make risk management decisions. For 1970-99, EM-DAT covers 972 disaster cases for Latin America and the Caribbean. Sources of information include, by order of importance, the US government, UN agencies, insurance companies, the IFRC, governments of affected countries and the press. The dataset provides fatality information for 90% of recorded disaster cases, information about affected population for 57% of the cases, and damage information for 29% of the cases. For regional comparison, we also used the worldwide dataset, which covers 5,970 disasters and has fatality information in 90% of the cases, affected population information in 62% of the cases and damage information in 34% of the cases.
Finally, it is important to underline that the disaster statistics used in this paper do not account for smaller disasters, which occur at a household or community level. These events might have serious effects on the welfare of the affected household or community but are not considered as natural disasters because their impact is not significant at the aggregate level. These smaller disasters are considered as idiosyncratic events, similar to accidents or illness. Nevertheless, the accumulation over time of smaller disasters might have a sizable effect on welfare at regional or even aggregate levels. High-frequency small-scale natural hazards might also induce changes in behavior of economic agents because of perceived risks. For instance, medium level climatic variability might have greater effects on agricultural production and development over the long run than a flood happening once every thirty years. By nature, these smaller disasters are extremely difficult to track and their effects even more difficult to capture. According to statistics produced by La Red de Estudios Sociales en Prevención de Desastres (La Red) for 11 countries of Central and Latin America, more than 20,000 small-scale natural disasters occurred in Latin America over the last 30 years.5
In addition to fatalities, disasters can have various adverse effects on an individual’s physical integrity. First of all, disasters can cause grave or permanent injuries that can provoke a fall in income and an increase in health-related expenditures. Sickness and violence can also accompany disasters, depending on the quality of the management of a disaster situation. Earthquakes, storm surges and floods tend to destroy water distribution or contaminate water supply, leading to increased risks of water-borne diseases in the aftermath of a disaster. The
3
CRED (2000).
4
We excluded epidemics from our analysis in this paper due to the nature and complexity of their origins.
5
stagnation of waters following a flood is also a factor in the increase of certain endemic diseases such as malaria. Unsanitary and crowded shelters can also promote the easy spread of diseases. For instance, Vos, Velasco and Labastida (1999) estimate that the health conditions of 2.5 million Ecuadorians in the coastal regions worsened as a result of the 1997-98 El Niño.6
In terms of mental health, sudden disasters such as earthquakes or hurricanes are found to have a profound psychological impact on victims, resulting in higher rate of incidence of stress, alcoholism, violence and depression.7 Individuals are also more likely to become victims of
violence because of looting, the gathering of population in shelters, and the breakdown of family units. Case studies report an increase in violence, rape, child abuse and prostitution in temporary shelters, which usually regroup the poorest and most marginalized members of a community.8
Natural disasters can also affect household welfare through homelessness, as well as the loss of productive assets and income. Over the past 30 years, an estimated 148 million people have required immediate assistance during a period of emergency for basic survival needs such as food, water, shelter, sanitation and immediate medical assistance.9
Household assets such as housing and income-generating assets can be damaged or destroyed by disasters. Housing is likely to be destroyed by earthquakes, high winds, volcanic eruptions and landslides, while damages in times of flood might be more limited and null in the case of droughts. Disasters are estimated to have made 2.5 million people homeless between 1990 and 1999. The partial or total loss of income-generating assets (shops, factories, crop, cattle, arable land, forests, etc.) is also a consequence of disasters. In the case of agricultural income-generating assets, the loss might be temporary or permanent. Floods make land unsuitable for agricultural production until waters recede, while hurricanes might wash out arable land or permanently increase its salinity through storm surges and flash floods. Loss of perennial crops such as forests or banana trees also has long-term consequences on the ability to generate income. In the case of Hurricane Mitch, banana production is expected to return to its historical level in 2002, i.e., four years after the disaster. The effect of disasters on employment, though, is still largely unknown, since no study has looked into their impact on open unemployment and underemployment. The impact on unemployment depends primarily on the degree of destruction of income-generating assets and the period of disruption of flows of goods and services. The frictional unemployment generated by a disaster results in a long-term reduction of income if alternative sources of employment are not available inside or outside of the affected area and the reconstruction efforts are limited in scale and slow in their execution. During the last El Niño in Ecuador, Vos estimated that around 12,000 workers on banana and sugar cane plantations in the lowlands temporarily lost their jobs. In Honduras, the press reported that the rate of unemployment in the immediate aftermath of Mitch had reached an estimated 32%, according to the firm Asesorias Económicos. But these figures differ significantly from official estimates of unemployment by November 1999 that registered 89,000 unemployed people, or 3.7%, compared with 3% before the hurricane. A reason for the discrepancy of these
6
Vos, Velasco and Labastida (1999).
7
Fogerthill (1998, p. 19).
8
Anderson and Woodrow (1989, p. 165).
9
figures might be explained by the fact that much of the frictional unemployment was absorbed between March and November of 1999.10
1.1.2 The Impact of Disasters at the Aggregate Level
Natural hazards can have effects on a country’s economy when the sum of individual asset and income losses is significant at the aggregate level. Effects at the aggregate level can represent more than the sum of individual, household or community losses because of negative synergies and because of losses of common assets or resources (e.g., public infrastructure and environmental damage). In the short term, major natural disasters might have an impact on a country’s GDP due to the loss of assets and the associated disruption of economic activity. But GDP growth and other flow indicators do not fully capture the effect of disasters, whose principal impact is on the stock of human and physical capital. In the longer term, the destruction of capital can have effects on factor endowments, income distribution, regional inequalities, growth trajectory and public indebtedness.
1.1.2.1 The Direct and Indirect Cost of Disasters: Theory and Empirical Evidence
Within hours of their occurrence, hazards produce direct damages to fixed assets and capital. As defined by ECLAC, direct damages comprise total or partial destruction of housing, buildings, installations, machinery, equipment, means of transport, storage, and furniture, as well as damages to cropland, irrigation works and dams and the destruction of crops ready for harvesting. Calculating direct damages is a difficult enterprise, especially in countries where the coverage of land titles, property taxes and insurance is low, resulting in problems for the valuation of assets. Under these circumstances economic agents and governments might be encouraged to overvalue lost assets to obtain insurance compensation, international assistance and debt relief. Inversely, assets lost by poor individuals, typically uncovered by insurance, might not be included in the valuation of losses. Moreover, direct damage assessments tend to underestimate damages to the environment (for instance, erosion or total sedimentation that makes the land unsuitable for cultivation) as well as negative effects on human capital because of fatalities and injuries.
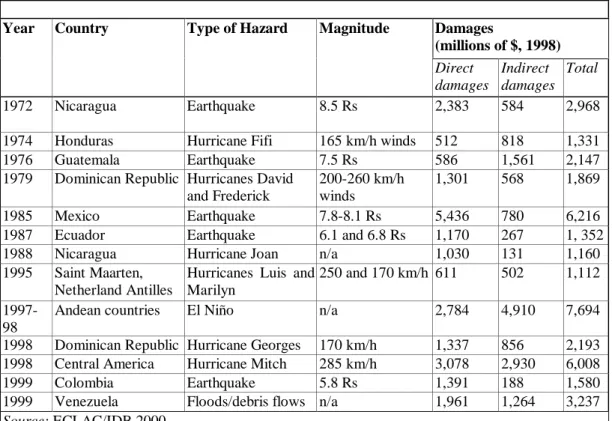
Disasters also cause indirect damages, which refer to the loss of potential production due to the disturbed flow of goods and services, lost production capacities and increased costs of production. As shown in Table 1.1, indirect damages, which are the consequence of direct damages to production capacity and social or economic infrastructure, can be substantial. They include loss of future harvests as a result of flooding of farmland or loss of perennial crops, loss of industrial output as a result of damages to factories or lack of inputs and increased transport costs due to destruction of road infrastructure. Indirect damages continue to occur until reconstruction is completed and the entire production capacity is restored, which can take several years. Other indirect damages are less tangible but might have serious economic consequences. For instance, the destruction of school infrastructure and the decrease in enrollment due to impoverishment in affected areas can have a negative impact on school achievement and human capital building.
10
Table 1.1. Direct and Indirect Damages of Selected Natural Disasters
Year Country Type of Hazard Magnitude Damages
(millions of $, 1998) Direct damages Indirect damages Total 1972 Nicaragua Earthquake 8.5 Rs 2,383 584 2,968
1974 Honduras Hurricane Fifi 165 km/h winds 512 818 1,331
1976 Guatemala Earthquake 7.5 Rs 586 1,561 2,147
1979 Dominican Republic Hurricanes David and Frederick
200-260 km/h winds
1,301 568 1,869
1985 Mexico Earthquake 7.8-8.1 Rs 5,436 780 6,216
1987 Ecuador Earthquake 6.1 and 6.8 Rs 1,170 267 1, 352
1988 Nicaragua Hurricane Joan n/a 1,030 131 1,160
1995 Saint Maarten, Netherland Antilles
Hurricanes Luis and Marilyn
250 and 170 km/h 611 502 1,112
1997-98
Andean countries El Niño n/a 2,784 4,910 7,694
1998 Dominican Republic Hurricane Georges 170 km/h 1,337 856 2,193 1998 Central America Hurricane Mitch 285 km/h 3,078 2,930 6,008
1999 Colombia Earthquake 5.8 Rs 1,391 188 1,580
1999 Venezuela Floods/debris flows n/a 1,961 1,264 3,237
Given the complexity of damage assessment, estimating the total impact of disasters in monetary value is quite difficult. It is also complicated by the fact that governments and international agencies use different methodologies and there is an obvious incentive for governments to overestimate losses to receive more assistance. Given these obstacles, it is not surprising that estimates of cumulative losses differ widely.
ECLAC, given its specific mandate to evaluate damages after disasters, is the primary source of information for the assessment of economic costs. According to their estimates, the cumulative damages from disasters for the period 1972-1999 amount to $50 billion in 1998, with $29 billion in direct damages and $21 billion in indirect damages, or $1.78 billion a year.11 This figure probably underestimates the actual economic burden associated with disasters, as ECLAC bases its estimates on studies of about 40 disasters during that period whereas, according to CRED, 972 natural disasters occurred during that period. On the other hand, ECLAC figures include indirect damages,12
whose assessment is particularly controversial. According to the CRED database, the cumulative damage figure amounted to $100 billion in 1998 dollars for 1970-1999, or $3.3 billion a year. The reliability of these figures is limited, however, as only one third of the recorded disasters include damage information and data comes from a variety of sources. Between 1990 and 1999 (when information reliability is much higher), losses reached $30.5 billion, or $3 billion a year. A third source, Munich Re— a major reinsurance company— estimated that, between 1985 and 1999, the total cumulative amount of damages caused by the 570 disasters in Latin America and the Caribbean (versus a total of 648 disasters according to CRED) was $10.9 billion, $420 million of which was covered by insurance.13 Considering all
sources together, the estimated annual average cost of recorded disasters over the last 30 years is between $700 million and $3.3 billion.
1.1.2.2 The Effect of Disasters on Short-Term Macroeconomic Performance Theoretical Elements
Natural hazards of a sufficient magnitude can have an impact on overall economic performance, as measured by changes in the GDP, balance of payments, level of indebtedness, state of public finances, and investment rate (Table 1.2). These effects are expected to take place in the year of the disaster, as well as during the two to three years following the disaster. The timing of the impact varies depending on the month of occurrence of the disaster.
The impact of disasters on GDP growth can be expected to be transitory when the overall public and private investment effort for reconstruction (which boosts the growth rate of gross fixed capital formation) outweighs the adverse growth effects of the disaster. According to Albala-Bertrand (1993b), the amount of investment effort needed to counterbalance the negative impact of the disaster does not necessarily have to be massive because of the large multiplier effect associated with the increase in investment for the reconstruction. In addition, the process
11
ECLAC/IDB (2000).
12
Indirect damages refer to impact of hazards on the flows of goods and services that cease to be produced, distributed or provided. For a more detailed definition, see Section 2.
13
of replacement of lost fixed capital can be expected to raise its quality, and therefore capital productivity.14
Table 1.2. Effects of Disasters on Macroeconomic Indicators
Macroeconomic Indicator Expected change after disaster
Growth rate of GDP Decrease or negative rate in year of disaster and subsequent increase during 1 to 2 years.
Agricultural Sector Significant fall in production (if hurricane, flood or drought).
Manufacture Sector Decrease in activity due to disruption of transportation, reduced production capacities.
Export sector Poor performance due to the effects described above Gross Formation of Fixed Capital Sharp increase in the year following the disaster.
Inflation rate Increase caused by the disruption of production and
distribution and increasing transportation costs.
Public finances Worsening of deficit due to a shortfall in tax
revenues and increase in public expenditures.
Trade balance Deficit due to decrease in exports and increase in
imports, associated with the decline in production capacities and strong public and private investment for reconstruction.
Current Account Increase in deficit due to trade imbalance, partially offset by capital inflows generated by official and private donations.
Adapted from Albala-Betrand (1993a) and Downing, Holstoorn and Tol (1999).
Empirical Evidence
To provide empirical evidence on the impact of disasters on GDP growth, we analyze 35 disaster cases between 1980 and 1996 in 20 Latin American and Caribbean countries to assess their effects on real GDP growth. All 35 cases have loss-to-output ratios superior to 1%. The distribution by type of disasters is fairly similar to the regional distribution between 1970 and 1999 (see Table 1.3).
14
Table 1.3
Selected Disaster Cases
Country Year Type of hazard Loss as share of GDP (%)
Argentina 1985 Flood 1.48% Bahamas 1992 Hurricane 8.75% Barbados 1987 Hurricane 6.86% Bolivia 1982 Flood 19.80% Bolivia 1986 Flood 1.26% Bolivia 1988 Drought 1.09% Bolivia 1992 Flood 1.63% Brazil 1984 Flood 1.00% Chile 1985 Earthquake 9.10% Colombia 1983 Earthquake 1.06% Colombia 1985 Volcano 2.87%
Costa Rica 1988 Hurricane 1.50%
Costa Rica 1991 Earthquake 8.87%
Costa Rica 1996 Flood 2.73%
Ecuador 1982 Flood 1.68%
Ecuador 1987 Earthquake 6.65%
Ecuador 1993 Landslide 3.50%
Guatemala 1982 Flood 1.20%
Haiti 1988 Hurricane 4.09%
Honduras 1982 Tropical storm 3.44%
Honduras 1990 Flood 1.57% Honduras 1993 Hurricane/Flood 3.39% Jamaica 1980 Hurricane 2.39% Jamaica 1986 Flood 3.00% Jamaica 1988 Hurricane 28.21% Jamaica 1991 Flood 6.62% Mexico 1985 Earthquake 2.18%
Nicaragua 1982 Tropical storm 18.74%
Nicaragua 1988 Hurricane 32.57% Nicaragua 1992 Earthquake 1.36% Nicaragua 1994 Drought 8.74% Panama 1988 Hurricane 1.23% Paraguay 1983 Flood 1.36% Peru 1983 Flood/drought 5.96%
St. Kitts & Nevis 1995 Hurricane 85.42%
We find that real GDP growth tends to decrease in the year of the disaster and increase sharply in the two successive years. The median real GDP growth decreases by almost 2% and subsequently increases by almost 3% during the next two years (see Chart 1.1). These observations corroborate the theory according to which the depressionary effect of the disaster is outweighed by the sharp increase in GFCF in the years following the disaster.
Chart 1.1. Median Real GDP Growth
As shown in Table 1.4, growth decelerates in the year of disaster in 28 cases out of 35. In 5 of the 7 cases in which growth accelerates, the loss to GDP ratio is inferior to 5%, which might explain the absence of aggregate negative effect. Growth accelerates during the two years following the disaster in 30 cases and 21 cases, respectively.
Table 1.4.Real GDP Growth Rate in Cases Analyzed
y+0 y+1 y+2
Change Down 28 5 14 Negative 13 5 13 Positive 15 0 1 Up 7 30 21 Negative 1 5 1 Positive 6 25 20
For the 28 cases with decreasing GDP growth, GDP changes still vary widely among cases, and these variations do not always coincide with the level of loss-to-output ratio, suggesting that other contemporary events might enhance or counteract the effects of the disaster. This variation could also show different levels of economic vulnerability to natural hazards (see Chart 1.2).
2.46% 0.74% 3.54% 3.46% 0.00% 0.50% 1.00% 1.50% 2.00% 2.50% 3.00% 3.50% 4.00% t-1 t0 t1 t2
Chart 1.2. Cases with Decreasing GDP Growth in Year of Disaster
Studying twenty-one cases of hurricanes occurring between 1970 and 1997 in the Carribbean Development Bank’s borrowing member countries, Crowards (1999) finds similar results: GDP growth slows down by 3% on average the year of the disaster and rebounds by 3% in the subsequent year. But there are wide deviations from this average pattern, with certain countries even experiencing an acceleration of GDP growth in the year during the disaster, as in the case of St. Lucia in 1988. During the subsequent two years, once the activity boom subsides, average growth slows down again. Exports are reduced by 9% in the year of the disaster while imports increase by 8.2%, causing a substantial increase in the trade deficit. Sugar-exporting countries such as Barbados and St. Kitts tend to suffer a greater loss in exports in the year following the disaster, since hurricanes hit after the sugar harvest. There is no discernible pattern in the variation of government expenditures, but external debt tends to rise during the disaster year, presumably due to emergency borrowing. Similarly, Crowards finds no observable pattern in the response of consumer prices.15
A study by Albala-Bertrand of twenty-eight case studies16
between 1960 and 1979 finds that disasters result in an increase or constancy of GDP growth rate in 75% of the cases studied. This result might be explained by the fact that 13 of the 26 cases studied are earthquakes, which usually have less of an aggregate effect than other disasters. In addition, there is no analysis of the real GDP growth rate, while inflation accelerates in a third of the cases studied. Finally, since the aggregate effect of the disaster seems to be proportional to the degree of development of the
15 Crowards (1999, pp. 12-18). 16 Albala-Bertrand (1993a, pp. 57-89). -15.00% -10.00% -5.00% 0.00% 5.00% 10.00% 15.00%
y-1 y0 y+1 y+2
Years Re al G DP Gr ow th Ra te (% )
economy affected,17 these results, based on 1960s and 1970s data, might not be indicative of the
effect that disasters have today on LAC economies. Other macroeconomic effects during the year of the disaster in this study include an increase in the growth of Gross Rate of Formation of Fixed Capital, a worsening of the public and trade deficits and an increase of capital flows. No discernible change in the inflation rate is observed.
Explaining Variations in Macroeconomic Impact: Key Variables
The wide variation in the macroeconomic effects of disasters observed in these empirical studies can be explained by analyzing three factors: the size of direct and indirect damages caused by a disaster as a share of the economy, the nature of the hazard and the vulnerability of the economy.
A natural disaster will have a strong impact on a country’s economic performance if the size of damages compared with the size of the economy (loss-to-output ratio) is high, as in the case of Hurricane Mitch (see Box 1.2). Not surprisingly, smaller countries are more likely to experience a sharp decrease in GDP in the short term as their loss-to-output ratios are substantially higher on average (see cases in Table 1.3). On the contrary, medium and large-size countries do not usually suffer from significant aggregate secondary effects of disasters. The regional or asymmetric shock that the disaster represents for a larger country is absorbed by activity in other regions.
17
Benson and Clay find that the aggregate impact of droughts was less substantial in the least developed economies, mainly due to the lack of intersectoral linkages (1998, p. 26).
Box 1.2. The Case of Hurricane Mitch in Honduras
This case is particularly interesting due to the very high loss-to-output ratio (38% for direct damages, 70% for all damages) and the fact that economic prospects for Honduras before the hurricane, which occurred at the end of October 1999, were estimated as very promising. The IMF projected that real GDP growth, which was 4.7% in 1997, would reach 5% annually for 1998 and 1999. According to ECLAC, the total amount of damages incurred by Honduras amounted to $3.8 billion, with $2 billion in direct damages and $1.8 billion in indirect damages. Losses in the productive sector represented 68% of total losses, the rest consisting of the loss of housing, health and education facilities (11.6%), infrastructure (17.5%), and the environment (1.2%). Losses in the productive sectors were distributed as follows: 77.6% in agriculture, livestockand fisheries; 14.4% in industry, and 8% in commerce.
Table 1.5
Macroeconomic indicators 1997 1998 1999 (est.) 2000 (forecast)
Real GDP growth (%) 4.5 3.0 -2.0 3.0
Inflation (%) 20.2 13.7 11.6 12.2
Central government finances (balance, La m) -- 2,080.7 1,089.5 N/a
Exports $ m 1,857 2,017 1,773 2,077
Imports $ m -2,150 -2,340 -2,580 -2,904
Current account deficit (%GDP) 5.7 6.4 6.5 N/a
Total external debt $ million 4,698 5,017 5,652 N/a
As shown in Table 1.5, real GDP growth was 3% in 1998 (i.e., 2% points less than forecast) and
–2% in 1999 as a result of the indirect damages brought about by Hurricane Mitch, as well as the decreasing price of bananas and coffee. Activity in the agricultural sector, which contributes to 20% of the GDP, contracted by 8.7%. By contrast, the construction sector grew by 10.4%, fueled by reconstruction effort. As expected, exports decreased while imports increased (fueled by demand for materials for reconstruction). Remittances and capital inflows compensated for the increase in the deficit of the current account. Central government finances worsened due to a 40% increase in capital expenditures. The only surprising result was the decrease in inflation despite rising oil prices. It appears that low consumer demand and the quick recovery of basic foodstuff production (grains and beans) contributed to stabilizing prices.
Source: EIU (2000) and ECLAC (2000).
The duration and geographical size of the disaster is another important factor. Localized disasters tend to produce limited aggregate impacts, unlike countrywide natural events such as Hurricane Mitch. Sudden hazards (such as storms) usually have fewer long-lasting effects than slowly developing ones (such as droughts). Hurricanes, floods and droughts tend to have stronger aggregate effects than earthquakes and volcanic eruptions, mainly because of their stronger adverse effects on the agricultural sector, especially in countries dependent on agriculture.18 Recurrent disasters in the same geographical area (such as El Niño) might induce
long-term effects such as a reduction in investment due to the perceived risk of asset loss, or emigration from stricken areas.
The third key element, the vulnerability of the impacted economy, depends mainly on the degree of diversification of the economy and its macroeconomic performance before the disaster hits. Smaller countries such as the Caribbean islands (see Box 1.3) are particularly vulnerable
18
because island economies are often dependent on tourism and agricultural exports of cash crops.19 Nevertheless, when the main economic activity is severely hit, even larger countries can
be affected. For example, the 1987 earthquake in Ecuador represented a loss-to-output ratio of only 1.8% but destroyed the most important oil pipe in the country, cutting down oil exports for months.20A country’s type of economic structure and the linkages between different sectors also
play an important role. Countries with large informal sectors are likely to suffer more,21 since
these sectors are poorly covered by insurance and reconstruction assistance. They are also less likely to have access to private financing in the post-disaster credit crunch, increasing risks of bankruptcy. The size of the agricultural sector is also an important factor. The agricultural sector (including agroindustries) represents around 25% of GDP in the region but is much higher for some countries, magnifying their vulnerability to weather-related hazards.22 Finally, in countries
dependent on hydroelectricity for their electricity supply, drought conditions might have important ripple effects on the entire economy, by interrupting production in various sectors, as shown by the effects of El Niño on electricity supply in Nicaragua or Brazil.23
Box 1.3.Economic Impact of Disasters on Small Island Economies: The Case of Montserrat, UK
The Caribbean island of Montserrat, whose territory is 0.6 times the size of Washington DC and has 12,853 inhabitants, constitutes an extreme example of the kind of impact disasters can have on a small and undiversified economy. In 1996, 81% of the island’s activity was linked with tourism. In 1989, Hurricane Hugo caused an estimated $240 million in damages, i.e., a loss-to-output ratio of more than 600%.24 98% of the housing stock was damaged or destroyed by the hurricane. In 1995, while the island was still recovering from Hugo (with growth rates between 0 and 2% in 1992, 1993 and 1994), the Soufriere Hills Volcano became active again for the first time in 350 years, causing 32 fatalities and the evacuation of 70% of the population. Volcanic activity, which peaked in 1996-97 with several violent eruptions, subsided by March 1998, leaving much of the island unsuitable for agricultural production or inhabitable. The UK government has committed about $100 million for reconstruction (i.e., 300% of the island’s GDP). Despite this massive assistance and the boom generated by reconstruction in the construction sector, GDP declined by 18.5% in 1997 in real terms and declined again in 1998 (CIA World
Factbook 1999; DFID, 1999, pp. 60-61; Crowards, 1999, p.18).
1.1.2.3 The Longer-Term Economic and Social Impact of Disasters
Due to the loss of fixed capital they cause, disasters can have long-term effects on growth and distribution of income.
Growth Effects
Factor endowments, such as natural resources and physical and human capital, play an essential role in long-term growth. Disasters can impact these variables in several ways. The sudden destruction of individual assets, as well as common assets such as public infrastructure, reduces the amount of physical capital in an economy, at least until reconstruction is completed. The
19 Anderson (1990, p. 14). 20 Albala-Bertrand (1993b, p. 1419). 21 Anderson (1990, p.17). 22
Such as Bolivia, Ecuador, Paraguay, Haiti and Nicaragua (Pichon and Uquillas, 1997, p. 483).
23
Benson and Clay (1998, p. 6); IDB (1998b); Wall Street Journal, July 20, 1999, p. A1.
24
losses incurred can reduce the rate of accumulation of fixed capital as risk and solvency problems limit investment willingness and capacities. Disasters can also have an adverse impact on the human capital available in a given region or country because of fatalities, emigration, or decrease in school enrollment due to the destruction of schools and hazard-related impoverishment. Finally, the impact of hazards on water reserves, forests, arable soil, and coral reefs, as well as land subsidence and coastal erosion, can modify a country’s endowment in natural resources.
The level, mode and timing of financing of reconstruction efforts are essential in determining the long-term growth effect of the disaster (see Box 1.4). If lost capital is not replaced, because of an insufficient public policy or private sector response to the disaster, there might be longer-term negative effects on the supply side, whose magnitude depends primarily on the capital per output ratio of the affected economy. When reconstruction is financed by reallocating public resources (of national or donor origin) away from other investments, an opportunity cost arises. The growth potential of the economy might be reduced if the expected rates of return of the investments planned before the event exceed the marginal growth in productivity of the physical capital replaced by reconstruction funds. The accomplishment of other development goals can be delayed or abandoned altogether because of reallocation needs.
If reconstruction is fully financed by insurance payments, the cost for the economy amounts to disaster insurance premiums paid by economic agents. The aggregate negative impact on aggregate welfare is therefore minimized, unless the premiums paid were high enough to discourage investments or insurance payments are delayed because of solvency problems or lengthy appraisal of damages. When massive international assistance finances the replacement of lost capital, the cost for the economy as a whole is limited or null depending on the share of grants and concessional funds in the assistance package. If international assistance is only composed of concessional resources, the overall impact might be positive because of the multiplier effect of the reconstruction process and the increase in capital stock productivity.
Box 1.4. Simulation of Macroeconomic Effects of a Major Storm in Honduras
This study uses risk assessments provided by Swiss Re and the World Bank’s Revised Minimum Standard Model for simulating macroeconomic effects. Total annualized hazard exposure is estimated at $82 million per year of 0.63% of the capital stock.
The model analyzes macroeconomic effects of a 1-in-100-year storm under three scenarios:
• 100% of the foreign financing needed to resume growth trajectory is available immediately following the event;
• only half of the necessary funding is available;
• all funding necessary is available, but with disbursement spanning over two years following the event.
Results show that under the first scenario macroeconomic effects are temporary: After a decrease of GDP in the year of the disaster, the economy gets back to its long-term growth pattern. The only lasting effect is the increase of the stock of the country’s debt as a share of GDP by around 60%. Under scenarios 2 and 3, the GDP further deviates from its baseline growth trajectory for 7 years after the disaster (after the decrease observed in year of the disaster also observed under scenario 1). Other macroeconomic indicators behave as follows (changes observed are greater under scenario 2 than under scenario 3): • total investment decreases as immediate consumption needs diverts resources;
• total exports decrease;
• an increased deficit in the balance of payments becomes more likely;
• private savings are lower than before the disaster due to decreased, subsistence-level income; • government consumption increases to provide relief to the very poor;
• stock of government debt increases as the public deficit increases.
• ability to service debt decreases due to additional need for external financing and decreased export earnings.
Source: Freeman, McKellar, Martin, Mechler and Warner (2000).
Given the low rate of insurance coverage in developing countries, the negative effect of disasters on fiscal balances and the limited amount of available international assistance, governments in the region usually have to resort to borrowing to finance reconstruction. The degree of additional indebtedness involved directly depends on the amount of capital inflows obtained via international assistance or insurance. Cochrane (1997) claims that increased indebtedness would have long-term negative effects on a country’s growth because of the increase in its interest rates associated with an increased debt stock and higher risk premiums required by lenders.25
Distributional Effects
Natural disasters can affect the distribution of income among regions, income groups or genders. As demonstrated by the Inter-American Development’s Economic and Social Progress Report
(abbreviated in Spanish as IPES) for 2000, geographical factors can have a sizeable impact on levels of wealth at regional, national and local levels.26
In the case of repeated disasters, affected
25
Cochrane (1997, p. 14).
26
regions might be stalled in their economic development. This is due to the fact that affected households might not be able to fully recuperate between disasters when those disasters occur frequently. Repeated disasters might cause a gradual depletion of households’ asset base. Adverse conditions might also cause the emigration of the most skilled individuals to other regions and result in a decline of the quality of human capital available. Investment in high-risk regions also becomes less attractive because high risks of asset loss are detrimental to the competitiveness of a given region, especially if adjacent areas are much less risk-prone. In fact, regions repeatedly hit by natural disasters, such as Northeast Brazil (see Box 1.5), or the coasts of Peru and Ecuador, are usually poorer on average than less hazard-prone areas in a given country.27
27
This said, the above-average disaster proneness of these regions might be the result of higher poverty rather than the reverse. More research would be needed to clear establish the direction of the relationship.
Box 1.5: The Impact of Droughts on Northeast Brazil
A study of several droughts in Sub-Saharan economies, as well as India and Australia, found that the aggregate impact of droughts could be quite significant in terms of growth. A 50% fall in agricultural GDP would translate into a 10% decrease in GDP for an economy in which agriculture accounted for 20% of total activity in the pre-drought year.28
A study of the supply-side shock (and associated demand effects) triggered by 10 drought episodes in Northeast Brazil between 1970 to 1993 produced similar results (see Table 1.6).29
Table 1.6 Estimates of Drought Impact on the GDP of North-East Brazil
Drough t years (Y) Growth of regional agricultural GDP, year Y (%) Growth of regional GDP, year Y (%) Estimated supply and demand effect of drought on regional GDP (%) (D) Difference between actual growth of regional GDP and growth trend of GDP (G) (% points) Difference between drought effect and deviation from growth pattern (D-G) (% points) 1970 -17.5 -4.2 -9.2 -9.2 0 1976 -8.3 7.0 -4.8 2.0 6.8 1979 -0.5 7.2 -1.0 2.2 3.2 1980 -6.5 2.9 -3.4 -2.1 1.3 1981 0.8 -0.7 -0.4 -5.7 -5.3 1983 -29.7 -3.8 -9.0 -8.8 0.2 1987 -1.7 -1.0 -5.0 -5.1 -0.1 1990 -10.5 -5.9 -3.6 -10.9 -7.3 1992 -10.5 -2.3 -4.0 -7.3 -3.3 1993 -24.4 -1.7 -6.0 -6.7 -0.7
Source: Gomes and Vergolino (1995).
Despite the decrease of the weight of agriculture in the regional GDP (from 23.5% in 1970 to 11.3% in 1993), droughts resulted in the decrease of the region’s GDP by 4 to 9 percentage points. Over the whole period, the main determinant of the fluctuations of GDP of the Northeast region was still the national GDP. For instance, in years of rapid growth in Brazil, such as 1976, the region’s GDP grew even if there was a drought because of a growth rate of fixed capital of almost 30%. Nevertheless, it appears that, during years of severe drought (such as 1970, 1983 and 1993), when the agricultural GDP decreased between 17.5 and 29.7%, the behavior of the region’s GDP can be almost entirely explained by the occurrence of drought (as shown by column D-G).
The aggregate impact of droughts on Brazil’s GDP is limited, as the GDP of the Northeast only represents 14.4% of the country’s GDP. Nevertheless, the repeated occurrence of droughts, with their recessionary effects, might contribute to worsened, regional inequalities. In fact, the estimated GDP per capita in the Northeast was $1,494 in 1993, compared with $3,010 in the rest of the country.
The poor and near poor can be expected to suffer greatly from the impact of a disaster because of their high degree of vulnerability and limited coping abilities (see box in previous section). This is not to say that higher-income groups are immune to disasters. Past examples of
28
Benson and Clay (1998, p. 15).
29
disasters do not necessarily show that higher-income groups with access to information are less vulnerable and therefore less likely to suffer. In the 1985 Mexico City earthquake, the lower-middle class was the most affected group as their high-rise housing was more vulnerable to the earthquake’s ground motion than the low adobe and brick-built houses in low-income neighborhoods.30
A study by Vos et al. (1999) on the impact of El Niño in Ecuador estimates that the poverty incidence in affected municipalities in the coastal province, which already reached 73% before El Niño, rose by 10 percentage points in 1998 due to loss of harvests of poor farmers and rising unemployment among agricultural workers. Using panel data, Scott and Litchfield (1994) provide empirical evidence that the occurrence of localized floods and droughts had regressive distributional effects both across communities and across households within communities in the rural region of Coquimbo in Chile between 1968 and 1986. The main agricultural activities of the region consist of extensive grazing of ruminants and rain-fed agriculture. Because of recurrent droughts, non-irrigated land could not be cultivated and livestock mortality rose because of a shortage of fodder and drought-induced diseases. Poor households were the most affected because they could not afford to buy fodder or relocate animals to summer pastures. As a result, inequality and poverty at the community level increased significantly in Las Tazas due to the cumulative effects of very low rainfall over the years.31
In the aftermath of Hurricane Mitch, the Social Investment Fund of Honduras conducted research to update the poverty map according to the effects on the hurricane by using data on destroyed social infrastructure according to geographical area. The result indicated that the poverty rate increased by an estimated 4% on average, with the exception of the 10 municipalities that did not suffer damage from Mitch.32 On the contrary, results from surveys
done in June 1999 in Nicaragua show that the national poverty rate slightly decreased between 1998 and 1999 in spite of Hurricane Mitch. Nevertheless, rural poverty increased by 2.6% in the Central Region due to the impact of the hurricane on agriculture and the region’s difficult access, while the Pacific Region benefited from international assistance and the reconstruction process.33
These ambiguous results show that more research needs to be done to analyze the short-term effects of the hurricane on income as well as longer-term consequences due to the loss of assets.
Many studies34
emphasize that the role of women in society as caregivers for other family members and their lack of mobility increase their vulnerability to disasters.35
Research on disaster-related fatalities provides mixed results, as more women than men tend to die in earthquakes, whereas the contrary holds for weather-related events. A potential explanation is that women tend to stay at home (a riskier location in times of earthquakes), whereas men work outside (a riskier location in the event of hurricanes and tornadoes). An empirical study after Hurricane Mitch provides similar conclusions about women’s physical vulnerability to disasters. Gomariz (1999) finds that more men than women died in Nicaragua (46/54% as share of total
30
Main and Williams (1994, p. 38).
31
Scott and Litchfield (1994).
32
According to internal documents of the Government of Honduras.
33
Government of Nicaragua (2000, p.11)
34
This section draws extensively on Fothergill (1998, pp. 11-21) in Enarson and Morrow (1998).
35
Unfortunately, most of these studies are on Asia, Africa or developed countries. Given the importance of cultural factors in gender issues, conclusions might not be applicable to Latin America and the Caribbean.
fatalities) and El Salvador (43/57%) because of Mitch (there is no data available for Honduras and Guatemala).36 The explanation for this disparity seems to be that men were more likely to
underestimate risks. Research about risk perception by gender shows that women are more concerned with danger, human suffering and loss of life than men. In the case of natural hazards, studies concluded that women were more fearful of earthquakes than men, while less knowledgeable about the hazard itself.37 In addition to these behavioral differences, several
disaster cases, such as the 1985 Armero mudslide in Colombia, show that relief tasks are usually divided along gender lines, with men in charge of rescue operations or property protection against looting while women shelter children and prepare communal food.38
In the recovery and reconstruction phases, women (especially when head of household) are more likely to suffer long-term consequences on their welfare than men, according to several studies in developing and developed countries. In India, when households have to reduce consumption after an adverse shock, girls are more likely to suffer from malnutrition than boys because of biases in the allocation of food among household members.39 Moreover, women have
less access than men to reconstruction jobs and credit. Two years after the occurrence of Hurricane Andrew in the United States, families still needing permanent housing were the very poor— primarily minority women-headed households.40 In the case of Hurricane Mitch in Central
America, the percentage of women living in shelters in the immediate aftermath of the disaster was equal to their proportion in the total population. But this percentage significantly increased as the weeks passed, especially in the case of female-headed households, possibly showing their difficulties in finding permanent housing solutions. According to 1999 estimates from Gomariz, open unemployment for women in Honduras was expected to double in 1999 (to above 9%) while underemployment would reach 60%.41
Part of this increase in unemployment is due to the fact that many women were employed in activities particularly vulnerable to disasters, such as packaging fruits for exports. They also had less access to food-for-work programs and were relegated to volunteer work despite the fact that many of the affected households are single female-headed. All these facts seem to corroborate the belief that women encounter more difficulties in recovering financially from disasters. At the same time, disasters can also constitute opportunities for female leadership and empowerment, as shown by the fact that more than 30% of the shelters in Honduras were managed by women.42
1.2 Risk Trends: Disaster Occurrence and Impact over Time
The previous section has established that the cumulative impact of disaster has been substantial in the region. This section analyzes trends in disaster occurrence and impact, which provides some clues about future risk in the region.
Over the last hundred years, the Latin American and Caribbean region has been affected by an estimated total of 1,309 natural disasters. During the last 30 years alone, the region was
36 Gomariz (1999, pp. 97 and 161). 37 Fothergill (1998, p. 14). 38
Clarke (1992, p. 97) in Kreimer and Munasinghe (1992).
39
Rose (1999, pp. 41-49).
40
Fothergill (1998, p. 21).
41
Inter-American Development Bank (1999a, p. 5).
42
affected by 972 disasters, i.e., 32.4 disasters annually on average. The distribution along this average frequency is quite wide. Peak years (1988 and 1999) witnessed 60 or more disasters, while low years (1972 and 1975) included only 10. The rate of occurrence of major natural disasters— defined here as 1,000 fatalities or 10 million people affected or $1 billion in damages— is much lower than for all disasters. In the last 30 years, 44 major disasters occurred, i.e., an average of 1.5 per year (see Table 1.7 for a list).
Over the century, there has been a noticeable trend of increase in the frequency of disasters, but much of this increase can probably be attributed to the poor quality of data in the first half of the century (see Chart 1.3).
Chart 1.3. Occurrence of Natural Disaster Events in Latin America and the Caribbean by Decade (1900-99) 0 100 200 300 400 500 1900s 1910s 1920s 1930s 1940s 1950s 1960s 1970s 1980s 1990s
Table 1.7
Source: CRED (2000).
Note: Affected people are defined as those requiring immediate assistance during a period of emergency, i.e. requiring basic survival needs such as food, water, shelter, sanitation and immediate medical assistance; individuals are also considered affected when there is the appearance of a significant number of cases of an infectious disease introduced in a region or a population that is usually free from that disease.
Year Country Disaster type Killed Affected Damage US$ 1998 (m)
1970 Brazil Drought n/a 10,000,000 0.4
1970 Peru Earthquake 66,794 3,216,240 2,225.0
1972 Nicaragua Earthquake 10,000 720,000 3,293.7
1973 Honduras Landslide 2,800 0 n/a
1974 Honduras Hurricane Fifi 8,000 730,000 1,784.6
1975 Brazil Cold wave 70 600 1,817.0
1976 Guatemala Earthquake 23,000 4,993,000 2,864.0
1978 Brazil Drought n/a n/a 5,746.5
1979 Dominican Rep Hurricanes David and Frederick 1,400 1,554,000 336.8
1983 Argentina Flood 0 5,830,000 1,636.6
1983 Argentina Flood 0 250,000 1,309.3
1983 Brazil Drought 20 20,000,000 n/a
1983 Peru Flood 364 700,000 1,618.3
1984 Brazil Flood 17 159,600 1,568.9
1984 Brazil Flood 10 120,400 1,568.9
1985 Argentina Flood 12 206,000 1,969.4
1985 Chile Earthquake 180 1,482,275 2,272.4
1985 Colombia Volcano Nevado del Ruiz 21,800 12,700 1,515.0
1985 Mexico Earthquake 8,776 130,204 6,059.8
1986 El Salvador Earthquake 1,000 770,000 2,231.0
1987 Colombia Earthquake 1,000 n/a 7,168.4
1987 Ecuador Earthquake 4,000 227,000 1,003.6
1987 Ecuador Tsunami 1,000 6,000 n/a
1987 Ecuador Earthquake 4,000 227,000 1,003.6
1988 Brazil Flood 289 3,020,734 1,378.4
1988 Jamaica Hurricane Gilbert 49 810,000 1,378.4
1988 Mexico Hurricane Gilbert 240 100,000 1,860.9
1988 St Lucia Hurricane Gilbert 45 n/a 1,378.4
1989 NA-Caribbean Hurricane Hugo 42 33,790 4,706.2
1991 El Salvador Earthquake 1,000 n/a n/a
1993 Mexico Tropical storms Arlene&Beatriz 7 10,000 1,884.5 1994 Haiti Tropical storm Gordon 1,122 1,587,000 n/a 1995 Virgin Is (US) Hurricane Marilyn 8 10,000 1,604.6
1996 Mexico Drought 0 n/a 1,247.1
1998 Argentina El Niño, flood 19 360,000 2,500.0
1998 Brazil Drought 0 10,000,000 97.8
1998 Dominican Rep Hurricane Georges 288 4,515,238 2,193.4
1998 Ecuador El Niño, flood 322 88,753 2,869.3
1998 Honduras Hurricane Mitch 5,657 2,112,000 2,000.0
1998 Mexico Flood 1,256 506,744 n/a
1998 Nicaragua Hurricane Mitch 2,447 868,228 1,000.0
1998 Peru Flood 340 580,750 1,200.0
1999 Colombia Earthquake 1,186 1,205,933 2,837.9
1999 Venezuela Flood/debris flows 30,000 483,635 1,957.2
More interesting is the fact that disaster frequency has increased over the last 30 years, as shown in Chart 1.4. The occurrence of disasters by decade has been increasing by 100% between the 1970s and 1980s and 19% between the 1980s and 1990s. During the last ten years, the frequency rate of disaster occurrence reached a record 42.9 per year.
Chart 1.4
Despite the fact the record year for major disasters was 1998, with 8 occurrences, there is no noticeable increase in the number of such disasters between 1970 and 1999 (Chart 1.5). While the number of major disasters in the 1970s was the lowest, the 1980s witnessed on average more major natural disasters than the 1990s.
Chart 1.5
Annual Occurrence of Major Disaster Events
in Latin America and the Caribbean (1970-99)
8 4 4 4 0 1 2 3 4 5 6 7 8 9 trendline
Annual Occurrence of Natural Disaster Events in
Latin America and the Caribbean (1970-99
)
0 10 20 30 40 50 60 70
Moreover, it is worthwhile observing that there is no noticeable increase in the number of fatalities associated with disasters and no obvious correlation between disaster occurrence and fatalities at region level (see Chart 1.6).
Chart 1.6
The number of fatalities per year does not seem to follow a general pattern, but appears, on the contrary, to be driven by the nature of single disaster episodes, in terms of hazard type, magnitude, and degree of vulnerability of the affected environment. The four peak years are linked with particularly lethal events: the 1970 earthquake in Chimbote, Peru (66,800 deaths), the 1976 earthquake in Guatemala (23,000 deaths) the 1985 volcano eruption in Nevado del Ruiz, Colombia (21,800 deaths) and the 1999 flood and landslides in Venezuela (30,000 deaths). The absence of correlation can also be observed in terms of affected population (Chart 1.7).43
There were three marked peak years in terms of affected population, each caused by the occurrence of severe drought in several states in Brazil— the most populous country in the region— affecting 10 million people in 1970 and 1998, and a record 20 million in 1983.
43
Note: Affected people are defined as those requiring immediate assistance during a period of emergency, i.e. requiring basic survival needs such as food, water, shelter, sanitation and immediate medical assistance; individuals are also considered affected when there is the appearance of a significant number of cases of an infectious disease introduced in a region or a population that is usually free from that disease.
Annual Occurrence of Natural Disaster Events and Disaster-Related Fatalities, Latin America and the Caribbean
(1970-99) 32,098 23,943 68,385 32,242 0 10 20 30 40 50 60 70 1970 1971 1972 1973 1974 1975 1976 1977 1978 1979 1980 1981 1982 1983 1984 1985 1986 1987 1988 1989 1990 1991 1992 1993 1994 1995 1996 1997 1998 1999 Number of Events 0 10,000 20,000 30,000 40,000 50,000 60,000 70,000 80,000 Fatalities occurrence fatalities
Chart 1.7.
Annual Population Affected by Natural Disasters in Latin America and the Caribbean
(millions, 1970-99) 0.0 5.0 10.0 15.0 20.0 25.0 30.0 35.0 19 70 19 71 19 72 19 73 19 74 19 75 19 76 19 77 19 78 19 79 19 80 19 81 19 82 19 83 19 84 19 85 19 86 19 87 19 88 19 89 19 90 19 91 19 92 19 93 19 94 19 95 19 96 19 97 19 98 19 99
In terms of damages, the CRED data does not show a clear pattern of increase between 1970 and 1999. The two most expensive years during the period 1970-1999 were 1985 and 1998 because of several major disasters. The estimated cost of the 1985 Mexico City earthquake reached a record $6.1 billion in 1998 dollars. That same year, four other major disasters took place whose cost ranged between $1 and $2 billion (the Nevado del Ruiz Volcano eruption, floods in the Buenos Aires province, drought in Northeast Brazil and an earthquake near Concepción in Chile). In 1998, El Niño-related weather phenomena caused $6.6 billion of damages in Argentina, Peru and Ecuador, while Hurricane Georges caused $2.1 billion in damages in the Dominican Republic and Hurricane Mitch produced damages of $2.4 billion in Honduras and Nicaragua.
Given these results, it is quite difficult to pinpoint the cause of this increase in the frequency of disasters. This trend could result from the combination of a heightened vulnerability of assets and a possible increase in hazard frequency and intensity. But it could also stem from better reporting due to the improvement in communications and information capacities in the region, as well as the presence of incentives to report disasters (such as federal or international assistance).
The occurrence trend disaggregated by type of disaster shows that weather-related disasters have increased at a much faster pace than earthquakes (see Chart 1.8). The fact that the occurrence of meteorological disasters increased at a much faster pace than earthquakes could be explained by the fact that earthquake reporting has probably been of a comparatively better quality in the first part of the century than other hazards. It could also be due to a possible increase in vulnerability to meteorological phenomena due to migratory movements towards the coast. But a change in rainfall and hurricane patterns, indicative of a long-term climate change cannot be excluded (see Section 2 for a more extensive discussion of climate change).
Occurrence of Natural Disaster Events in Latin America and the Caribbean : Trends by Disaster
Type (1900-99) 0 20 40 60 80 100 120 140 160 1900s 1910s 1920s 1930s 1940s 1950s 1960s 1970s 1980s 1990s Nu mb er of Ev ent s
windstorm earthquake flood
Chart 1.8.
In any case, it does not seem that this increase in frequency is solely a Latin American and Caribbean phenomenon. In fact, the region seems to be following worldwide trends (Chart 1.9). Over the past hundred years, the rate of occurrence of disasters worldwide has been rapidly increasing. The increase has been relatively steady until the last twenty years, when there has been a wider instability. Between 1980 and 1999, peak years (1983, 1987, 1990 and 1998) have almost reached or superseded 300 disasters per year, while lows were close to or under the 200 mark (in 1986, 1989, 1994 and 1996).
Annual Occurrence of Natural Disaster Events in Latin America and Caribbean and the World (1900-99)
0 10 20 30 40 50 60 70 1900 1904 1908 1912 1916 1920 1924 1928 1932 1936 1940 1944 1948 1952 1956 1960 1964 1968 1972 1976 1980 1984 1988 1992 1996 LAC 0 50 100 150 200 250 300 350 World lac world Chart 1.9.
According to the Munich Re group, the number of major natural disasters between the 1960s and 1990s has risen by a factor of three, with economic losses adjusted for inflation
multiplied by nine.44 Of course, part of the trend towards increasing damages can be explained by
the improvement of damage assessments. But it also results from the accumulation of assets with economic development and the rise of economic interdependence and globalization, which inflates the costs of disaster-related business interruption.
1.3. The Geographical Distribution of Risk
This section analyzes how risk is distributed inside the region and also compares Latin America to the rest of the world. Such comparisons show that the level, type and frequency of natural disaster risk varies widely across countries, regions and continents, providing a further evidence of the complexity of disaster risk. Exposure to various natural phenomena and degree of vulnerability might vary widely even within a single country. These comparisons also show that disaster occureence and impact is related to the level of socio-economic development. Poorer regions and countries tend to have a higher percentage of fatalities as a share of the total population and higher levels of damages compared with their GDP.
1.3.1 Within Latin America and the Caribbean
The distribution of risk is far from even. Sub-regions and countries in Latin America and Caribbean have different records in terms of disaster occurrence, fatalities, affected populations and damages.
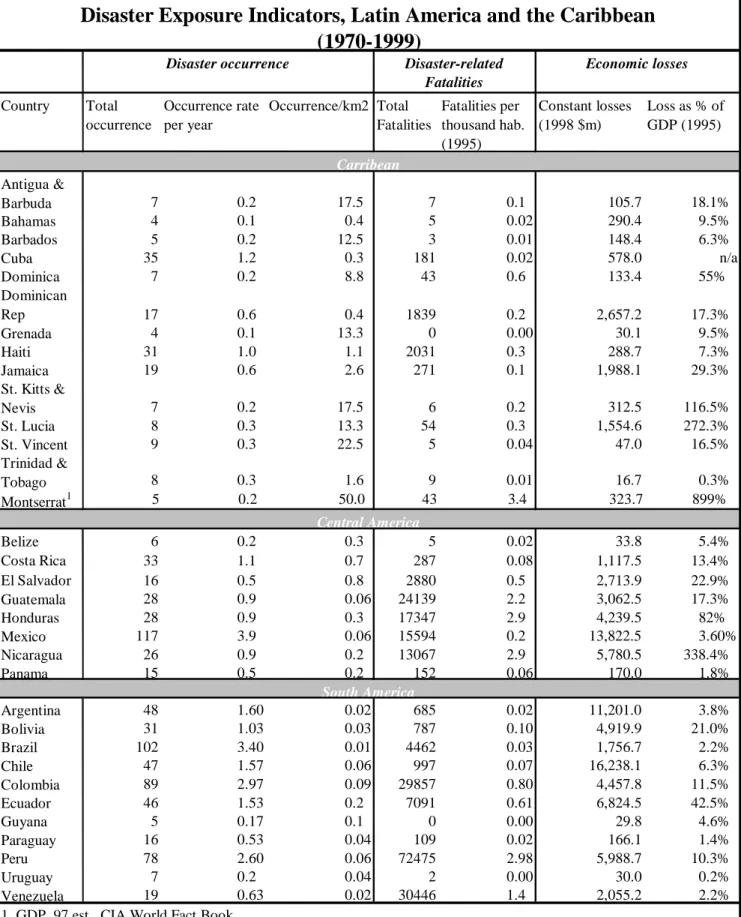
As shown by Table 1.8, 50% of the disasters in the region occur in South America as well as 65% of the fatalities, 75% of the population affected and 53% of total damages. Nevertheless, as shown in Table 1.9, South America’s effective exposure to risk might not be as high as in Central America or the Caribbean. Occurrence per thousand km2 is only 0.3, compared with 10.1
for the Caribbean; Central America has a greater proportion of population killed than South America does (especially if Mexico is not counted) and the Caribbean has a greater proportion of affected population than South America. In terms of damages, cumulative losses for 1970-99 represent only 3.9% of the combined GDP of South American countries, whereas they amount to 43.3% for the Caribbean.
Table 1.8.
Distribution of Natural Disasters in Latin America and the Caribbean by Sub-region (1970-99)
Subregion Occurrence (%) Fatalities (%) Affected (%) Damages, $1998 (%)
South America 50 65 75 53 Central America 28 33 13 31 Carribean 22 2 12 16 Total 100 100 100 100 44