Copyright 2011 by Kleinhanss, Werner. All rights reserved. Readers may make verbatim copies
METHODOLOGICAL AND EMPIRICAL CHALLENGES OF POLICY EVALUATION"
Ancona, February 17-18, 2011
Impacts of SPS options on the distribution of support
Kleinhanss W.1
1
Johann Heinrich von Thünen-Institut, Federal Research Institute for Rural Areas, Forestry and Fisheries, Braunschweig, Germany
Impacts of SPS options on the distribution of support
Kleinhanss W.Abstract
The Mid-Term Review and the Health Check reforms of the EU’s Common Agricultural Policy include numerous options for national implementation of the Single Payment Scheme. After the far-reaching decoupling of Direct Payments, further reforms and changes of support measures are necessary with respect to the financial guidelines to be established for the period after 2013. Referring to Germany, the principles of the hybrid and regional models and their effects on the distribution of direct payments are shown. With regard to CAP after 2013, the impacts of alternative payment options are analysed based on farm individual FADN data of EU-27. Options of digressive premium schemes, including capping wrt labour input, regionalised or EU-wide flat rates, lowering the premium level and the partial transfer of Pillar-I in favour of Pillar-II is analysed.
Keywords: CAP, Direct Payments, Decoupling, Modulation, FADN
1. INTRODUCTION
Direct payments (DP) were introduced by the McSharry reform of the Common Agricultural Policy (CAP) in 1992. At first they were targeted to compensate for income losses due to reduced price support. Since then they have been extended towards other sectors and decoupled in the Mid-term review (Single Payment Scheme: SPS). The last reform step, the Health Check, included the phasing-out of milk quotas, a further reduction of partial decoupling and manifold national options for redistribution of Direct Payments. Capping measures were proposed several times by the EU Commission (Kleinhanss and Manegold, 1998) but were never established due to strong opposition by the Member States’ (MS) governments. However, such measures still exist in the US Farm Bill (Thompson, 2010).
The DP budget is determined in the financial guidelines until 2013. Discussions aiming at the preparation of CAP for the next financial period (after 2013) are in progress. A communication of the EU Commission (2010) on the future CAP was submitted in November 2010. National positions are quite different and range from the maintaining or slight modification of existing schemes, simplification, further harmonisation of DP levels between MS and partial or full transformation in favour of Pillar-II (Dutch Ministry of Agriculture, 2008; Bureau and Mahé, 2008; Heißenhuber et al., 2008; Zahrnt, 2008, 2009). A far reaching proposal has been worked out by an expert group involved in a study for the European Parliament, with a transitory payment scheme until 2020 and a general reorientation towards public goods afterwards (Bureau et al., 2010). Within this study, alternative options for DP schemes were analysed by the author based on EU-FADN data. Although FADN is representative wrt to standard gross margins, representation is less wrt to land use, DP and other subsidies. However, it’s the best available data base for an analysis of distribution effects of DP schemes including (static) income effects.
The paper covers the following DP options: flat rates per ha of UAA, differentiated by MS or unified at EU-27 level. Premiums are reduced depending on the premium level of farms equal to the
already established Modulation scheme, combined by capping of DP referring to labour input. In other
scenarios we assume doubling1 parameters of the Modulation scheme and a reduction of global budget
by 20 %. The partial transformation of 50 % of DP (Pillar-I: P-I) in favour of Pillar-II (P-II) gives some indication of income effects of such far-reaching reforms, but does not provide answers regarding the specification, uptake of voluntary measures of P-II and their overall effects.
2. MODELLING APPROACH AND SCENARIOS
The analysis of alternative DP options is inspired by a study for the European Parliament (Bureau et al., 2010) proposing a two-step procedure: a) progressive reduction of P-I until 2020, b) increasing budget for P-II, i.e., public money for the provision of public goods. Based on this experience the modelling approach has been extended to deal with options included in communication for a further reform of CAP after 2013 of the Commission. Option 2 of this proposal – referring to Direct Payments - includes the following measures under the objective of ‘a fairer distribution between the Member States’:
• a base payment serving as income support
• a compulsory complementary aid wrt environmental measures partly compensating for
additional costs
• complementary payments to balance more specially natural restrictions
• an optional coupled support component for special sectors and regions
• introduction of a new regulation for small farms
• capping wrt large-scale enterprises and employment in the rural area.
Some of these options can be interpreted as digressive payments referring to the premium volume of farms. In the analysis we define premium digression equal to the existing Modulation scheme and a further limitation wrt labour input.
The harmonisation of DP between regions and Member States could be realised via regionalised entitlement levels as in Germany and England. In the analysis we assume unified flat
rates at the Member State or whole EU level2. A transformation of Pillar-I funding to the Pillar-II
budget is considered as follows: DP reduced by 50 % and the remaining 50 % transferred to Pillar-II, were the former is affected by the digressive measures. A last option, not considered in the Commission proposal, is a general reduction of the budget. We assume a 20 % cut of the global budget. Such a budget cut seems to be reasonable wrt budget requirements for future global policy targets (i.e., environment, biodiversity, etc). It is also proven by the fact that the DP budget has been determined by CAP reforms since 1991 and it is hard to imagine that the budget level of 2013 can be maintained forever.
Based on 2007 FADN data, simulations3 were realised referring to 2013 assuming a full
national implementation of decoupling and a complete upgrading of DP levels in the new Member states (nMS). A comparative static simulation model is developed to assess impacts of different direct
1
With the exception of the franchise of 5 T€ (T: thousand). 2
payment schemes on the premium level and income. In a first step, gross premium levels (excluding compulsory and voluntary Modulation) are calculated for 2007. Then, a projection of premiums for 2013 is made, including the regional implementation of decoupling in Germany and England, as well as the upgrading of premium levels in the new Member States. Target year for the analysis is 2013, assuming a full upgrading of direct payments also in Bulgaria and Romania. Premium totals per MS
derived from EU-FADN are calibrated to national premium budget4 and UAA represented by FADN.
Projected direct payments or incomes referring to national implementation in 2013 are taken as reference for the comparison of alternative DP options. The following options were considered:
• DP transformed into uniform flat rates per ha of UAA at Member State or EU-27 level,
combined with premium digression per farm depending on premium level and labour input
(10 % > 5 T€ + 4 % > 300 T€ and capping (<= 15 T€ per worker (AWU) for DP > 50 T€)5.
• Reduction of P-I payments by half and transformation of the remaining DP into P-II payments6.
For the P-I part, the above mentioned digressive elements are applied, which is not the case for P-II volume. Concerning income effects we assume 100 % transfer efficiency for P-I payments, while only 40 % for P-II payments (Goemann et al., 2009). Co-financing of P-II payments is not considered.
Based on these criteria the following scenarios are defined, each differentiated by flat rates per MS/EU and +/- capping wrt labour input:
Scenario Digression Global budget level EU7
Sc_1: equal to Modulation + capping constant
Sc_2: doubling Modulation + capping constant
Sc_3: equal to Modulation + capping -20 %
Sc_4: doubling Modulation + capping -20 %
Partial impacts of above-mentioned scenarios are derived referring to national implementation of decoupling (excluding Modulation). Further, income effects are assessed using farm net income
plus wage expenditures as income indicator8. The results are weighted with aggregation factors and
aggregated to sector accounts.
The premium budget of EU-27 for P-I in 20139 amounts to 46 billion €. Flat rates per ha of
UAA derived from statistical data vary between 83 €/ha in Latvia and 575 €/ha in Greece. An EU-wide uniform flat rate would amount to 266.3 €/ha.
3
The data base includes roughly 81 T farms, representing roughly 5.4 million farms in EU-27. 4
Ongoing implementation of the Health Check decisions and remaining steps of the reforms of the Common market regimes for sugar, tobacco, olive oil, cotton, fruit and vegetables are implicitly considered by calibration.
5
Parameters are determined by the author; variations can easily be introduced in the simulation model. 6
Analysis of P-II options is rather difficult, as P-II payments are not at all representative in EU-FADN. Further, there is not enough information required for the specification of P-II measures or the potential application of voluntary measures.
7
Reduction of net payments by Modulation / capping are considered as net savings of EU budget. 8
This indicator is necessary for income comparisons between private and legal farms. 9
3. EFFECTS OF THE REGIONAL IMPLEMENTATION OF THE SPS IN GERMANY
To get an idea of the distribution effects of regional flat rates, changes of premiums are shown for the implementation of the regional model in Germany in comparison to a projection of the hybrid model based on 2007 data.
3.1. The national implementation
In Germany, the SPS was implemented in 2005 with an almost full decoupling of direct payments. In a first step a regional equilibration of premium volume is being carried out between the Laender, changing the former Laender budget by -5 to +14 %. The gradual transformation over time is being realised by a hybrid model. Regionalised area-related payment claims are combined with farm individual top-ups being based on the main part of the livestock premia and on the total of milk and sugar premia. In 2005, the level of payment claims for arable land (including land set-aside) was about EUR 300/ha, while for grassland it was about EUR 80/ha. Provided that a farm raised eligible animals or produced milk or sugar beets in the reference period, the remaining premiums derived are added as so-called top-ups on the entitlements for arable and grassland (with the exception of set-aside). The level of the payment claims remains constant until 2009 (except the dynamic adaptation from the upgrading of milk and sugar premia --> static hybrid model). From 2010, a progressive adaptation of the levels of the payment claims (dynamic hybrid model) occurs up to the full harmonisation in 2013.
Referring to a hypothetical static hybrid model in 2013, the premium level would be less than 200 €/ha for 5 % of UAA (Salhofer et al, 2009). For about 75 % of UAA it varies between 200 and 400 €/ha and for about 5 % of UAA it is more than 500 €/ha (Figure 1). The latter applies in particular for farms with intensive bull fattening and milk production. After full conversion to regional flat rates, the payment levels vary in the scope of administratively settled levels of 280 and 380 €/ha. About one quarter of farms can expect considerably higher premiums, while in one fifth of farms with intensive cattle and milk production, considerable premium losses are to be expected.
Figure 1. Distribution of entitlement levels related to UAA – hybrid versus regional flat rates (2013) Germany
0 20 40 60 80 100
Cumulated share of UAA % 0 100 200 300 400 500 600 700 D P /h a E u ro DP regional DP Hybrid
Source: EU-FADN-DG AGRI L-3; own calculation.
3.2. Analysis of the effects of the SPS
The evaluations and model calculations were carried out for balanced samples of farms for the period 2004 (financial year 2003/4) to 2009 (2008/9) drawn from the national FADN. In the first two financial years, exclusively coupled direct payments were granted. The decoupled payments within the scope of the hybrid model are reflected first in 2006 (financial year 2005/6). Starting from 2010, a projection of premiums of the dynamic hybrid model as well as for the regional model in 2013 is
made. The farms are selected by orientation of production and grouped by size classes10.
The development of direct payments between 2004 and 2009, as well as the changes to be expected by 2013 compared to 2009, are shown in Figure 2. In the first phase, the development is gradually influenced by adjustments of milk and sugar premia:
• As a result of the introduction and the upgrading of the milk premiums, a near doubling of DPs
arises for dairy farms with up to 100 dairy cows. For the bigger farms, the increase is only half, because of larger arable areas and diversification. The milk market reform is also reflected in
10
Classification of farm size
Size Class 1 2 3 4 5 < 100 > 100 1 < 25 < 50 < 75 > 100 Legal Ent. 8 < 16 < 40 < 100 Arable farm s ESU Livestock farms Heads
the premium increase of farms with up to 50 bulls that often pursue bull fattening combined with milk production.
• The introduction and the upgrading of the sugar beet premiums is reflected in an increase of
direct payments for arable farms of size class 2 to 4.
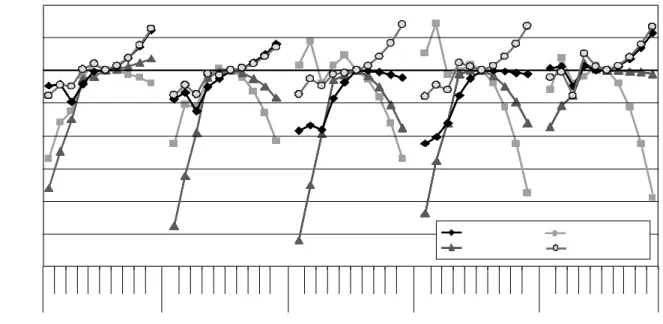
Figure 2. Development of DP by type and size of farms (% of 2009)
The adjustment of payment claims by 2013 differs by farm types:
• For arable farms with up to 40 ESU (European Size Unit) as well as for legal entities located in
the east, the premium level rises by up to 10 %, while it decreases for the remaining size classes.
• Small dairy farms will get slightly higher premia, mainly due to the upgrading of grassland
entitlements. This is also valid for size class 5 which lies above all in the eastern region, with larger and more diversified UAA. However, farms dominant in West Germany with 25 to 100 cows have to expect premium losses of about 10 to 20 %.
• Farms specialised in bull fattening will have premium losses of 20 to 40 % by 2013. Including
the premium adaptation that had already occurred in 2009, the premium volume decreases to about half compared to the previous system with coupled premiums.
• Farms with suckler cows have to expect premium increases of up to 12 % by 2013; they profit
above all from the introduction and upgrading of the payment claims for grassland.
It can be seen that the regional implementation of the SPS leads to considerable redistributions of DPs to the disadvantage of intensive beef fattening and dairy farms. Also, a moderate regional redistribution occurs in favour of extensive and grassland-based cattle farms, as well as less favoured regions.
4. IMPACTS OF DP OPTIONS WRT CAP AFTER 2013
To indicate the combined effects of premium rearrangements, digression and capping with reference to manpower, the premium changes are shown in the following graphs as a function of premium volumes per farm (referring to national implementation).
4.1. Impacts in Germany
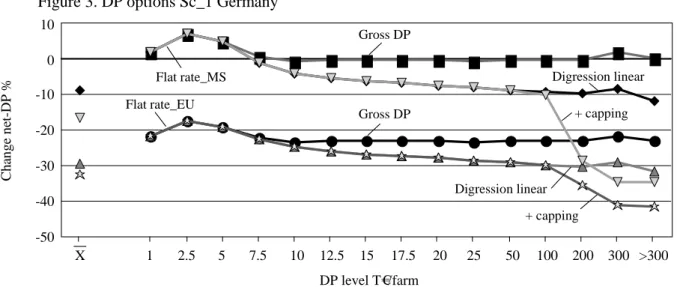
In Germany, redistributions were mainly be realised during national implementation of the regional model mentioned before. Distributions induced by a country wide flat rate are rather low, shown in the top line of Figure 3. Farms with premium levels up to 5 T€ will have a slight increase of DP, because of their location in regions with weak natural conditions being favoured by an upgrading of entitlements. On the other hand, they are exempted from digression due to the franchise. Premium digression would impose a slightly progressive reduction of DP up to 12 %. Parameters of the digression scheme in Scenario_1 are equal to existing Modulation and therefore representing the present situation (with the exception of DP transfers towards P-II and national co-financing of P-II programmes). Capping of DP wrt labour use would impose premium reductions up to 35 % in farms with DP levels beyond 200 T€. Although defined for DP > 50 T€, farms with less than 100 T€ are less affected due to their average labour input of 2 AWU. Larger farmers in Germany are more specialised in arable cropping with low labour input. Therefore DP are much higher than the underlying ceiling of 15 T€/AWU. Due to expected large reductions of DP there is strong opposition against this measure, especially by representatives of the new Laender. Nevertheless, such a measure seems to be reasonable, because almost all measures related to labour use have been abandoned by decoupling, meaning that especially livestock production in the new Laender is further reduced, inducing negative employment effects.
By an EU-wide flat rate the DP level would be reduced by 23 % on average. Including Modulation (Sc_1) it will decrease up to 31 % without and up to 42 % with capping.
Figure 3. DP options Sc_1 Germany
1 2.5 5 7.5 10 12.5 15 17.5 20 25 50 100 200 300 >300 DP level T€/farm -50 -40 -30 -20 -10 0 10 C h an g e n et -D P % Flat rate_MS Digression linear + capping Flat rate_EU Gross DP Gross DP Digression linear + capping
Source: EU-FADN-DG AGRI L-3; own calculation. X
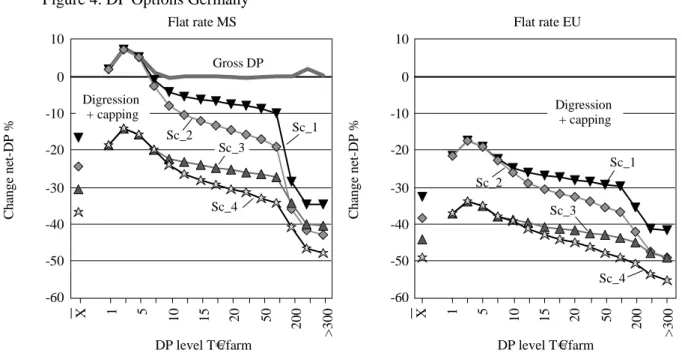
The doubling of parameters of Modulation (Sc_2) would increase the digression by DP level with reductions up to 20 % by the linear element and up to 42 % including capping wrt labour input (Figure 4). A reduction of global the budget by 20 % (Sc_3) would induce even higher premium reductions especially for small and medium sized farms. The capping effect wrt labour becomes lower, such that the maximum reduction will be 47% for the largest farms.
Figure 4. DP Options Germany
Source: EU-FADN-DG AGRI L-3; own calculation. DP level T€/farm -60 -50 -40 -30 -20 -10 0 10 C h an g e n et -D P %
Flat rate MS Flat rate EU
-60 -50 -40 -30 -20 -10 0 10 C h an g e n et -D P % 1 5 10 15 20 50 2 0 0 > 3 0 0 X DP level T€/farm Gross DP Digression + capping Digression + capping Sc_1 Sc_2 Sc_3 Sc_4 Sc_1 Sc_2 Sc_3 Sc_4 1 5 10 15 20 50 2 0 0 > 3 0 0 X
As the average DP level in Germany, with 345 €/ha, is significantly above the EU average, an
EU-wide flat rate of 266 €/ha would induce considerable DP losses. The DP level would be reduced
by 23 % on average. Including Modulation and capping (Sc_1) it will decrease up to 30 % without, and to 42 % with, capping. Doubling modulation (Sc_2) would enforce the digression and DP reductions up to 40 % without, and up to 48 % with, capping. A further 20 % budget cut would induce DP reductions of 35 to 40 % in medium sized farms and up to 55 % in largest farms (Sc_4). It has to be mentioned, that the partial capping impact is much lower under this lower DP level.
4.2. EU wide effects of DP options
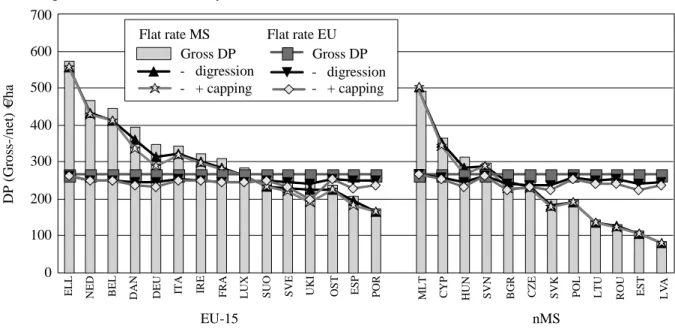
Effects of DP options on net-DP at MS levels are shown in Figure 5 referring to average payment levels; for simplification we take only Sc_1 into account. MS are sorted by gross DP levels in the base situation and aggregated into EU-15 and nMS. DP levels show a broad variation between 570 (Greece) and 170 €/ha (Portugal) in EU-15 and 490 (Malta) and 83 €/ha (Latvia) in the nMS. Depending on farm size DP are reduced up to 10 % by digression. Partial impacts are less in nMS due to lower DP levels and sometimes high shares of small farms. A further capping referring to labour input would especially affect Germany, Denmark and the United Kingdom.
EU-wide flat rates would induce considerable redistribution effects between MS. In the EU-15, two-thirds of MS could expect considerable DP losses, while in the nMS two-thirds would gain.
Partial effects of Modulation and capping on net-payments are about 10 to 30 €/ha11.
Figure 5. DP at MS level by MS (Sc-1) EU-15 0 100 200 300 400 500 600 700 D P ( G ro ss -/ n et ) € /h a nMS E L L N E D B E L D A N D E U IT A IR E F R A L U X S U O S V E U K I O S T E S P P O R M L T C Y P H U N S V N B G R C Z E S V K P O L L T U R O U E S T L V A Gross DP Flat rate MS - digression - + capping Flat rate EU Gross DP - digression - + capping
Source: EU-FADN-DG AGRI L-3; own calculation.
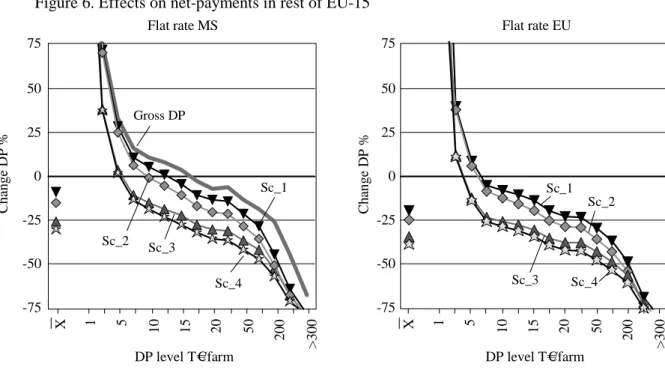
Aggregated effects for MS of EU-15 mainly applying historic or hybrid schemes12 in the
reference as well as the nMS mainly applying SAPS are shown in Figures 6 and 7. As premium reductions/capping are progressive with DP levels of farms, results are aggregated for farms by different payment classes.
Impacts of flat rates in EU-15 Member States (excl. Germany and the United Kingdom) applying historical references are very important; distribution effects are similar as in Germany due to the implementation of the regional model (see Chapter 3). Farms with low premium levels will gain a lot. Net payments of farms with 20 to 200 T€ premiums will progressively decrease up to 25 %, while larger farms will lose up to two-thirds.
Modulation and capping (Sc_1) would include a further reduction of net-payments by 10 and 20 %, respectively. The partial effect of doubling modulation parameters is about -10 %-points. DP will be reduced further by a 20 % budget cut; while small farms will gain, large farms will have drastic DP losses.
EU wide flat rates will have a further negative levelling effect because two-thirds of EU-15
MS have DP levels above EU-27 average; the gross DP level will be reduced by 11 %. Only farms with less than 5 T€ will be on the winner side, while even farms with 10 to 50 T€ of DP will have premium losses up to 25 %. Losses will progressively increase to more than 75 % in the largest farms.
11
The partial effects of a partial harmonisation of flat rates within the EU would lay between the boundaries set by flat rates at MS and EU levels.
12
Figure 6. Effects on net-payments in rest of EU-15 -75 -50 -25 0 25 50 75
Source: EU-FADN-DG AGRI L-3; own calculation. DP level T€/farm C h an g e D P %
Flat rate MS Flat rate EU
C h an g e D P % DP level T€/farm Gross DP Sc_1 Sc_2 Sc_3 Sc_4 -75 -50 -25 0 25 50 75 Sc_1 Sc_2 Sc_3 Sc_4 1 5 10 15 20 50 2 0 0 > 3 0 0 X 1 5 10 15 20 50 2 0 0 > 3 0 0 X
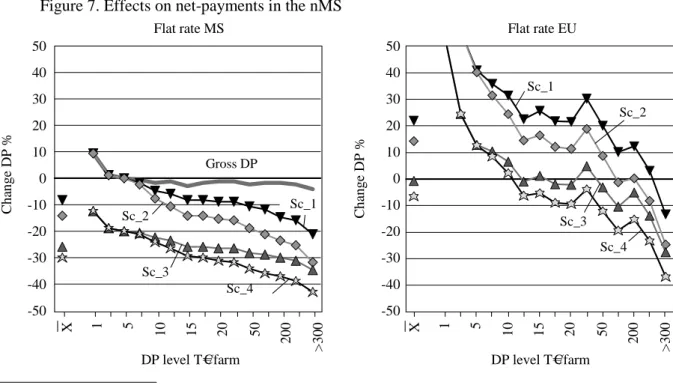
In the nMS, effects of national flat rates are rather insignificant as most of them apply the Single Area Payment Scheme (SAPS) (Figure 7). Modulation under Sc_1 would induce effective premium losses, as Modulation was not used before 2013. Net-payments will be progressively reduced up to 12 % or up to 20 % including capping. It has to be mentioned, that the partial effects of capping are rather low, which is due to the higher labour input and of labour cost considerably below assumed upper limits of 15 T€/ AWU. Doubling Modulation parameters would enforce the digression effect with DP reductions up to 25 %. Budget cuts of 20 % would induce further DP losses but reduce the effect of digression.
The total harmonisation of DP-levels between MS via EU-wide flat rates would be in favour of most nMS; the gross DP-level would increase by one-third on average. Small farms will gain a lot. Farms with DP of 10 to 20 T€ would get 25 to 15 % higher net-premiums under Sc_1 and Sc_2. Due to digression and capping large farms would have up to 12 and 25 % lower premiums under conditions of underlying scenarios. With a 20 % reduction of the global budget, small farms will still be on the winner side; net-payments in medium sized farms would be slightly negative, while largest farms will have losses up to one-third.
Figure 7. Effects on net-payments in the nMS -50 -40 -30 -20 -10 0 10 20 30 40 50
Source: EU-FADN-DG AGRI L-3; own calculation. DP level T€/farm C h an g e D P %
Flat rate MS Flat rate EU
C h an g e D P % DP level T€/farm Gross DP Sc_1 Sc_2 Sc_3 Sc_4 -50 -40 -30 -20 -10 0 10 20 30 40 50 Sc_1 Sc_2 Sc_3 Sc_4 1 5 10 15 20 50 2 0 0 > 3 0 0 X 1 5 10 15 20 50 2 0 0 > 3 0 0 X
4.3. Income effects of digression and budget transfers of P-I towards P-II
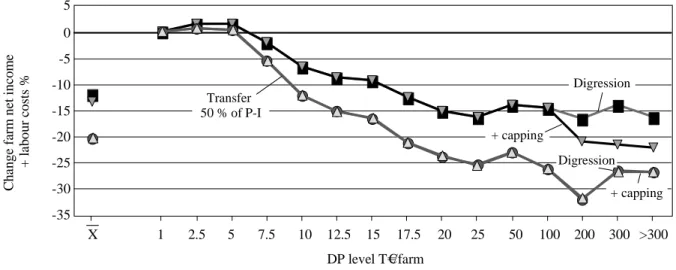
The effect of this measure can only be shown wrt income effects, because transfer efficiency of P-II is assumed to be only 40 % against 100 % for P-I. Income effects are expressed referring to farm net income plus expenditures for hired workers. It is also assumed that premium changes of P-I as well as Modulation and capping directly affect income. The income indicator used, with approximately 125 billion €, is about three times the level of direct payments, therefore the relative changes are lower in comparison to premium changes shown before. The analysis will focus on the option ‘transferring 50 % of DP in favour of P-II’ referring to an EU-wide flat rate.
Aggregated income effects are explained for Germany, first referring to 2007 income, where other parameters except DP remain unchanged (Figure 8; Sc_1). For completion of above mentioned effects it also shows income effects of the digression schemes. Although EU flat rates are applied, income in small farms increases slightly. Reasons are the exemption from Modulation and a low share of DP on income. Incomes will progressively be reduced up to 15 % without and up to 22 % with capping referring to labour input.
Due to lower transfer efficiency the partial transfer of P-I towards P-II would induce higher income losses from 2 to 25 % in medium sized farms (DP levels of 7 and 25 T€) and of one-third at maximum. It has to mentioned that the partial effect of capping is rather insignificant even for farms with more than 300 T€ of DP. Due to halving P-I payments capping effects can be almost outbalanced with the assumed ceiling of 15 T€/AWU.
Figure 8. Combined income effects of an EU-wide flat rate, shifting toward Pillar-II and Modulation and capping (Germany)
-35 -30 -25 -20 -15 -10 -5 0 5
Source: EU-FADN-DG AGRI L-3; own calculation.
1 2.5 5 7.5 10 12.5 15 17.5 20 25 50 100 200 300 >300 DP level T€/farm C h an g e fa rm n et i n co m e + l ab o u r co st s % + capping Digression X Transfer 50 % of P-I Digression + capping
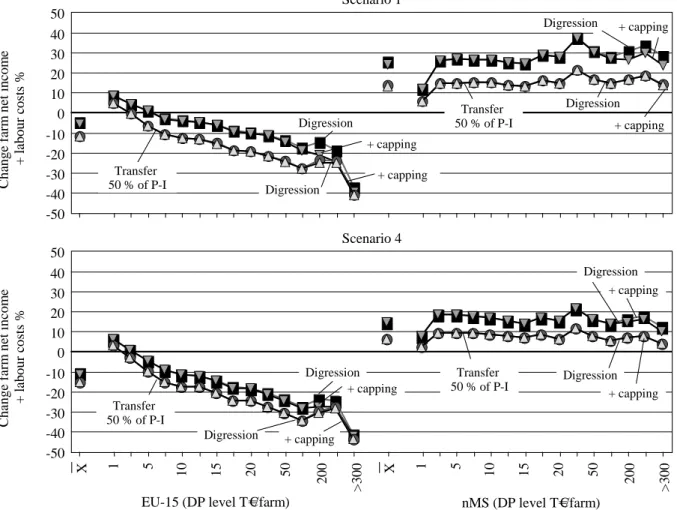
Income effects EU-15 (excluding Germany) as well for nMS are shown in Figure 9. Regarding digression of P-I (Sc_1) small farms in EU-15 will get up to 10 % higher incomes. Income will progressively be reduced up to 20 % in farms with up to 300 T€ and up to one-third including capping. The partial transfer of P-I via P-II will induce 5 % higher income losses in small and largest farms and of -10 to -15 in farms with 10 to 100 T€. Budget cuts of 20 % induce further income losses as shown in the bottom of Figure 9.
Income effects in the nMS are generally positive, due to the combined effects of upgrading DP since 2007 and due to EU-wide flat rates. Further, they are less affected by digression and capping. Under Sc_1 income increases by 25 % under the digression scheme and by 12 % with the partial transfer of P-I budget. Under conditions of Sc_4, relative income effects are about half. Income changes are almost similar between farms with DP of 2 to 300 T€. Only farms with <1 T€ and > 300 T€ would have rather insignificant increases of income.
Figure 9. Income effects of an EU-wide flat rate, shifting towards Pillar-II and Modulation and capping depending on DP level of farms
Source: EU-FADN-DG AGRI L-3; own calculation. EU-15 (DP level T€/farm)
C h an g e fa rm n et i n co m e + l ab o u r co st s % Digression -50 -40 -30 -20 -10 0 10 20 30 40 50 1 5 10 15 20 50 2 0 0 > 3 0 0 X nMS (DP level T€/farm) Scenario 1 C h an g e fa rm n et i n co m e + l ab o u r co st s % -50 -40 -30 -20 -10 0 10 20 30 40 50 Scenario 4 + capping Digression + capping Transfer 50 % of P-I Digression + capping Digression Transfer 50 % of P-I + capping Digression + capping Digression + capping Digression + capping Transfer 50 % of P-I Digression + capping Transfer 50 % of P-I 1 5 10 15 20 50 2 0 0 > 3 0 0 X
4.4. Impacts on the distribution of DP by farms and labour units
Finally the questions arises in which degree the distribution of direct payments changes and if a fairer distribution – as mentioned in the Commissions’ communication – can be reached. This will be discussed in comparing distributions of the base situation (national implementations of SPS) and EU-wide flat rates under conditions of Sc_4 (20 % budget cut, doubling Modulation including capping) over the whole EU-27 (see Figure 10). The distribution in the base situation (left side) shows 3 pikes: one in farms with less than 5 T€ of DB and low rates referring to labour use. Another pike with around 10 to 15 T€ of DP/AWU is for farms with DP levels of 20 to 100 T€ and a further one with 30 and more T€/AWU for DP levels of > 200 T€/farm.
Under condition of Sc_4 with an EU-wide flat rate the distribution seems to be more balanced, but the 3 pikes are still there. The share of farms with 5 to 10 T€/AWU increases significantly in the group with than 5 T€ of DP. On the other side the shares of farms with high DP/AWU decrease in
large farms. Therefore, distribution of DP is still unbalanced, because it is mainly determined by the variation of farms size, especially land use.
Figure 10. Distribution of direct payments by farms and labour units
0 1 2 3 4 5 6 % o f to ta l g ro ss D P 1 5 10 15 20 50 200 399 1 7,5 20 35 DP farm T€ 0 1 2 3 4 5 6 % o f to ta l g ro ss D P 1 5 10 15 20 50 200 399 1 15 >35 DP farm T€ 5-6 4-5 3-4 2-3 1-2 0-1 7.5 1 2035 DP AWU T€ 7.5 1 2035 DP AWU T€ 7.5 1 2035 7.5 1 2035 DP AWU T€ Share of
Reference Scenario 4 (Flat rate EU)
Source: EU-FADN-DG AGRI L-3; own calculation.
5. CONCLUSIONS
The simulation based on FADN data allows conclusions on the effects of alternative options of decoupled payment schemes. Regional flat rates by MS lead to premium rearrangements within the MS, especially of EU-15, mainly in favour of farms with a low premium volume in the base situation. Redistribution effects are close to the German regional model, which is to the disadvantage of intensive beef fattening and dairy farms and a moderate regional redistribution in favour of extensive and grassland-based cattle farms, as well as less favoured regions.
Uniform EU-wide flat rates induce clear re-distributions to the disadvantage of the main part of EU-15 countries and in favour of most new Member States. Premium ceilings with respect to labour would lead to significant premium reductions for farms with more than 100 T€ of direct payments, above all in Germany and the United Kingdom. In the new Member States only relatively low reductions arise from this alternative, due to the higher labour input of those farms.
Providing public money for public goods is a general guideline recommended by policy makers, interest groups and scientists. Model calculations based on the transformation of half of Pillar I premiums in favour of Pillar-II (without considering co-financing) show above all strong income losses in the bigger farms, because the transfer efficiency of Pillar-II payments with respect to income is possibly less than half compared to Pillar-I payments.
REFERENCES
BMELV (2006). Die EU-Agrarreform – Umsetzung in Deutschland.
http://www.bmelv.de/cae/servlet/contentblob/378542/publicationFile/26474/eu-agrarreform2006.pdf
Bureau, J.C., Mahé L. P. (2008). CAP reform beyond 2013: An idea for a longer view. Notre Europe. Studies & Research 64, April 2008 (http://www.notre-europe.eu).
Bureau, Witzke et al. (2010). The single payment scheme after 2010: New approach new targets.. Study for European Parliament's Committee on Agriculture and Rural Development.
http://www.europarl.europa.eu/activities/committees/studies/download.do?language=en&file=31208 Goemann, H. et al (2009). vTIBaseline 2008.
http://www.vti.bund.de/de/institute/lr/publikationen/lbf/Gi_vTI-baseline_farbig_gesamt_mSH-Deckblatt.pdf
Dutch Ministry of Agriculture, Nature and Food Quality (2008), European Agricultural Policy 2020: The Dutch outlook, 26 September 2008.
http://www.minlnv.nl/portal/page?_pageid=116,1640360&_dad=portal&_schema=PORTAL&p_file_id=30905
EU Commission (2010). Communication from the Commission to the European Parliament, the council the European Economic and Social Committee and the Committee of the Regions
The CAP towards 2020. Meeting the food, natural resources and territorial challenges of the future. http://eur-lex.europa.eu/LexUriServ/LexUriServ.do?uri=COM:2010:0672:FIN:en:PDF
Heißenhuber, A., Hebauer, C. Hülsbergen, K.J. (2008). Wanted: A new agricultural policy! Technical University of Munich, Agrifuture, Summer.
Kleinhanss, W. (2007). Avenir des soutiens et reforme de la PAC 2013. Découplage en Allemagne, SAF-Agriculteurs de France, Cycle de Prospective de la PAC, París, 10.5.2007.
Kleinhanß, W., Manegold, D. (1998). Begrenzung der Transferzahlungen im Rahmen der Agenda 2000 : Ausgestaltungsmöglichkeiten und Wirkungen. Landbauforschung Völkenrode, Vol 48, 4, 23-233
Salhofer, K., Röder, N., Kilian, D., Henter, S., Zirnbauer, M. (2009). Märkte für Zahlungsansprüche. BMELV research contract 05HS041, http://www.leaderplus.de/download/pdf/05HS041.pdf
Thompson, R. (2010). Developments in US agricultural policies. ABARE Outlook Conference 2010 http://www.abare.gov.au/outlook/_download/trade_thompson.ppt
Zahrnt, V. (2008). Reforming the EU’s Common Agricultural Policy: Health Check, Budget Review, Doha Round. ECIPE Policy Briefs 06/2008.
http://www.ecipe.org/reforming-the-eu2019s-common-agricultural-policy-health-check-budget-review-doha-round/PDF Zahrnt, V. (2009). Public Money for Public Goods: Winners and Losers from CAP Reform, ECIPE Working Paper, N° 08/2009 (www.ecipe.org).