Full Terms & Conditions of access and use can be found at
http://www.tandfonline.com/action/journalInformation?journalCode=rbec20
Baltic Journal of Economics
ISSN: 1406-099X (Print) 2334-4385 (Online) Journal homepage: http://www.tandfonline.com/loi/rbec20
Detection of implicit fluctuation bands and their
credibility in EU candidate countries
Simón Sosvilla-Rivero & María del Carmen Ramos-Herrera
To cite this article: Simón Sosvilla-Rivero & María del Carmen Ramos-Herrera (2015) Detection of implicit fluctuation bands and their credibility in EU candidate countries, Baltic Journal of Economics, 15:1, 18-37, DOI: 10.1080/1406099X.2015.1066952
To link to this article: https://doi.org/10.1080/1406099X.2015.1066952
© 2015 The author(s). Published by Routledge
Published online: 28 Jul 2015.
Submit your article to this journal
Article views: 470
View related articles
Detection of implicit
fluctuation bands and their credibility in EU candidate
countries
Simón Sosvilla-Riveroa and María del Carmen Ramos-Herrerab*
a
Complutense Institute for International Studies, Universidad Complutense de Madrid, Madrid, Spain;
b
Departamento de Economía Cuantitativa, Facultad de Ciencias Económicas y Empresariales, Universidad Complutense de Madrid, Madrid, Spain
(Received 18 December 2014; accepted 5 June 2015)
This paper attempts to identify implicit exchange-rate regimes for currencies of candidate countries vis-à-vis the euro. To that end, we apply three sequential procedures that consider the dynamics of exchange rates to data covering the period from 1999:01 to 2012:12. Our results would suggest that implicit bands have existed in many sub-periods for almost all currencies under study. Once we detect de facto discrepancies between de facto and de iure exchange-rate regimes, we make use of different methods to study the credibility of the detectedfluctuation bands. The detected lack of credibility in a high percentage of the sample is robust to the use of several credibility tests, suggesting that economic agents do not behave as if these bands actually were in force at time of making their financial plans. These countries do not improve the confidence on thefluctuation bands as time evolves.
Keywords:credibility; exchange rates; exchange-rate regimes; implicitfluctuation bands
JEL Classification:F31; F33
1. Introduction
The Treaty on the European Union (EU) states that any European country may apply for member-ship if it respects the democratic values of the EU and is committed to promoting them.
Thefirst step is for the country to meet the key criterion for accession (the so-called‘ Copen-hagen criteria’), being one of them is the ability to take on and implement effectively the obli-gations of membership, including adherence to the aims of political, Economic and Monetary Union (EMU). Indeed, one of the economic priorities of the 1999 and 2000 Accession Partner-ships was the establishment of an annual surveillance for the candidate countries, aimed at pre-paring countries for the participation in the multilateral surveillance and economic policy co-ordination procedures currently in place in the EU as part of the EMU. The Pre-Accession Econ-omic Programmes are part of this procedure, outlining the medium-term policy framework, including publicfinance objectives and structural reform priorities needed for EU accession, as
© 2015 The author(s). Published by Routledge
*Corresponding author. María del Carmen Ramos-Herrera, Departamento de Economía Cuantitativa, Facul-tad de Ciencias Económicas y Empresariales, Universidad Complutense de Madrid, Campus de Somosa-guas, Madrid 28223, Spain. Email:[email protected]
This is an open-access article distributed under the terms of the Creative Commons Attribution Licensehttp://creativecommons.org/ licenses/by/4.0/, which permits unrestricted use, distribution, and reproduction in any medium, provided the original work is properly cited. Vol. 15, No. 1, 18–37, http://dx.doi.org/10.1080/1406099X.2015.1066952
well as offering an opportunity to develop the institutional and analytical capacity necessary to participate in EMU, particularly in the areas of multilateral surveillance and co-ordination of economic policies.
The current candidate countries (CCC) are Albania, Iceland, the former Yugoslav Republic of Macedonia, Montenegro, Serbia, and Turkey. All candidate countries except Albania and Mace-donia have started accession negotiations, but the negotiations with Iceland were put on hold by the Icelandic government in May 2013.
Unlike Denmark, Sweden, or the UK, the adoption of the euro is not an option for the CCC of the EU, but an obligation. However, the CCC and the New Member States (NMS) can make decisions regarding the timing of this process. Joining EMU involves the loss of control over the nominal interest rate and the nominal exchange rate. At the same time, these countries will have to abide by the discipline imposed by the Maastricht convergence criteria (price stability, the duration of convergence, obtaining sound, and sustainable public finances and exchange-rate stability) and the Stability and Growth Pact.
The choice of exchange-rate policy becomes one of the most fundamental instruments for achieving macroeconomic stability, offering competitiveness and affecting the overall develop-ment of the economy. Prior to EU membership, CCC are free to adopt the exchange-rate regime of their choice and they can enter the EU with their prevailing exchange-rate regime. Since the assessment of exchange-rate stability includes as mandatory the participation for at least 2 years in the Exchange Rate Mechanism II (ERM II) linking the currencies of non-euro area, most of the CCC are expected to join it at some point after their accession to the EU.
Participation in ERM II could help CCC in stabilizing the exchange rate by anchoring the expectations and encouraging low and less volatile inflation, leading to lower risk premium and interest rates, as well as lower transaction costs. Additionally, participation in ERM II would invoke effective pressure for responsible macroeconomic policies and for consolidation and reforming of publicfinance above all, giving that any form offixed exchange-rate regimes strictly requires consistent and sound macroeconomic policies. However, there are some potential problems associated with CCC participation in ERM-II. With limited exchange-rateflexibility and an environment of increasing capital mobility, the large capital inflows that will be directed towards these economies (mainly in the form of foreign direct investment) are expected to exert appreciating pressures on domestic currencies. Moreover, theirfinancial systems are not fully developed posing problems in the transmission of the monetary policy. Finally, some credibility problems may arise from the fact that central parities are subject to realignment: in the case of CCC involved in a catching-up process the credibility of the central rate may be eroded over time. These and other potential gains and shortcomings could have not gone unnoticed for some of the CCC and could have significantly affected their decision to participate de facto,but not de iure in the ERM II, establishing implicit bands and maintaining the exchange rate around a central parity while permitting enoughflexibility to adjust to fundamental disequilibrium and allowing some degree of monetary policy discretion.1Indeed, the de facto exchange-rate policy adopted by mon-etary authorities has tended to differ from the announced de iure exchange-rate regime, which is why International Monetary Fund (IMF) classifications are not always a good guide to the true exchange-rate intentions of said authorities (see, for example, Bubula & Ötker-Robe, 2002; Levy-Yeyati & Sturzenegger,2005; Reinhart & Rogoff,2004; Shambaugh,2004among others). This paper contributes to the existing economic literature by investigating the existence of implicitfluctuation bands infive of CCC (Iceland, the former Yugoslav Republic of Macedonia, Croatia, Serbia, and Turkey)2and by assessing their credibility. To that end, wefirst make use of three sequential procedures based on the exchange-rate behaviour during the period 1999–2012 to detect implicit bands, and we then apply several credibility measures to evaluate the perception of economic agents with respect to the commitment to maintain such implicit bands.
Most studies in the literature investigate exchange-rate regimes in emerging countries (Ferrari-Filho & De Paula, 2008; Piragic & Jameson,2005 to name a few), very few explore them in NMS (see, e. g., Åslund,2011; Bauer & Herz,2005; Darvas, 2001; Josifidis, Allegret, & Pucar,2013), but to the best of our knowledge, there is no previous research that empirically evaluate this issue for CCC.
The rest of the paper is organized as follows. In Section 2, we present the statistical procedures based on the evolution of the exchange rates vis-à-vis the euro used to detect implicitfluctuation bands and we examine in detail three instruments as different measures of robustness to determine the credibility of the identifiedfluctuation bands. In Section 3, we offer the empirical results identifying the de factofluctuation bands and the sub-periods characterized by the absence of credibility in the exchange-rate system country by country for thefive countries mentioned above, covering the period 1999–2012. Finally, in Section 4 some concluding remarks are provided.
2. Methodology
2.1. Implicitfluctuation bands
The ERM II was established in 1999 as a framework to manage the exchange rates between EU currencies and ensure stability. It is a regime offixed exchange rates in which participating cur-rencies can onlyfluctuate by a maximum of ±15% around the central euro rate, although tighter fluctuation bands can also be agreed. Indeed, the currencies participating in ERM II have remained broadly stable against the euro, trading at, or close to, their respective central rates, suggesting that narrower bands have been effectively implemented. As surveyed in Stockman (1999), proponents of narrow band target zones suggest them as substitutes of a monetary com-mitment. Giavazzi and Pagano (1988) argued that exchange arrangements like the predecessor of ERM II contributed to import credibility for domestic monetary policies, because differential inflation translates into real exchange-rate appreciation, reducing the policy-maker’s incentive to inflate. Therefore, we explore the possibility of the existence of implicitfluctuations bands of ±1 or ±2.
Moreover, we also allow the occurrence of crawling bands, where the currency is maintained within certainfluctuation margins around a central rate and the central rate or margins are adjusted periodically at a fixed rate or in response to changes in selective quantitative indicators. This regime allows the monetary authorities to achieve a balance between the disinflation policy pro-vided by a peg and the preservation of competitiveness. The desired balance between these two targets is obtained by adjusting the size of the preannounced devaluation of the reference rate. Both Hungary and Poland adopted this regime during most of the 1990s: Hungary followed a narrow band crawling peg and Poland adopted a wide band crawling peg (see, e.g. Coudert & Couharde, 2012; Szapáry, 2001). Campos and Torres (2007) and Rodríguez and Rodríguez (2003) contend that an exchange-rate crawling-band system can borrow a portion of those aspects of a target zone that lead to its stabilizing effects on the exchange rate. The main advan-tages are to avoid economic instability as a result of infrequent and discrete adjustments and to minimize the rate of uncertainty and volatility since thefluctuation in the exchange rate is kept minimal (Kane,1988).3
In this section we will explain in detail the three procedures based on the dynamics of the exchange rate for the detection of implicit fluctuation bands. First, the descriptive procedure used by Reinhart and Rogoff (2004) is based on the monthly percentage variation of the absolute value of exchange rate. This method is based on the probabilities that this variation is maintained within a certain band, it can be ±1%, ±2%, or ±5%, for two orfive rolling years. According to this
criterion, if the probability exceeds or equals 80%, we will conclude the existence of a de facto fixed monetary system during the time in which that percentage stays.
Nevertheless, one of the main limitations of this method, according to Ledesma-Rodríguez, Navarro-Ibáñez, Pérez-Rodríguez, and Sosvilla-Rivero (2005a), is the absence of a statistical sig-nificance contrast to corroborate the achieved results. To rectify this weakness, they propose a contrast in which the null hypothesis (H0) says that the probability that the monthly exchange-rate percentage variation is maintained a band of ±1% or ±2% for 24 consecutive months (includ-ing the current one) is less or equal than the same threshold established by the above procedure (0.8).
One of the necessary requirements to apply this procedure is to ensurefirst normality and the absence of serial correlation of the series to analyse. For this reason, we take advantage of the Jarque–Bera, Kolmogorov–Smirnov test, and the test of von-Neumann. Having confirmed these two properties we are able to continue with the statistical test, which formally can be expressed in the following way:
H0:p≤ p0, H1: p.p0,
where p represents the proportion of the population and p0 is the established probability or threshold. Therefore, this contrast serves to determine if the population proportion is less or equal than a frequency p0, accepting the absence of bands. According to these authors, the region’s acceptance of the null hypothesis happens when pˆ≤1,pˆ being the estimated sample proportion and 1= p0+z1−a√p0q0/√n, wherez1−a is the critical value of standard normal
distribution at confidence level of 1−α. On the other hand, √p0q0/√nindicates the population deviation,q0=1− p0, andnis the sample size.
Another variant that also allows us to filter results by their statistical significance for the identification of the implicit fluctuation bands is proposed by Ledesma-Rodríguez, Navarro-Ibáñez, Pérez-Rodríguez, and Sosvilla-Rivero (2005b). Unlike the previous method, this approach does not offer a contrast on the probabilities, but directly on the monthly exchange-rate percentage variations. Based on the normality and independence assumptions, to test if the average of such variations is significantly less or equal than ±1% or ±2% over a period of 24 con-secutive months:
H0 : m≤m0, H1: m.m0,
where mrepresents the population mean of these variations and m0is the given mean (±1% or ±2%). In this contrast, the acceptance region happens whenx≤1, xbeing the sample mean and 1=m0+t1−aS/√n where t1−a is the critical value of thet-Student distribution at a confidence
level of 1−a,Sis the quasi-variance andnis the sample size.
2.2. Credibility test offluctuation bands
The entrance to the ERM II for many countries means an increase in the level of credibility about the monetary and exchange commitments made by monetary authorities, especially for those who have experienced inflationary periods, since it allows them to act as a real anchor on exchange-rate policy. Credibility becomes a key issue in examining the behaviour of a target zone agreement
such as the ERM II, since the possibility that the official authorities change the central parity could be anticipated by the economic agents, triggering expectations of future changes in the exchange rate that could act as a destabilizing element of the system. In this context, credibility refers to the perception of economic agents with respect to the commitment to maintain the exchange rate around a central parity. For this reason, in this section we present three alternative indicators as measures of credibility that have been widely used in the empirical literature.
2.2.1. Svensson simple test
The simple and robust Svensson (1991)’s method is an indicator that is commonly used to verify the credibility of the exchange-rate regime of a target zone exchange-rate regime withfluctuation bands. A target zone delimits explicitly what are the bands of appreciation and depreciation of the exchange rate.
Under the assumption of perfect capital mobility (which is the lack of opportunities for arbit-rage between different currencies), the annualized rate of return in terms of the domestic currency, ex post, associated with the purchase of afinancial asset at timetin foreign currency with a matur-ity periodτcan be obtained from the following expression:
Rtt = (1+i∗tt) St+t St
12/t
−1,
where the maturity period of the asset (τ) is measured in months. According to Svensson (1991), if an investor invests a national currency unit that is equivalent to say investing 1/St units of foreign currency, which means that, after the maturity period, the investor acquires a yield of
(1+i∗t
t )t/12/St units of foreign currency. Once again, to express this performance in units of national currency it must be multiplied by the exchange rate (St+t) which is being equal to
(1+Rt
t)t/12.
By definition in a context of a target zone is expected that the exchange rate is between minimum (S) and maximum (S) limits. As theτ-month ahead exchange rate is uncertain at time t, the previous limits in the national currency appreciation and depreciation involve a delimitation of the rate of return, which is to be found between the lower limit (Rt
t) and the upper limit (R
t t): Rtt = (1+i∗tt) S St 12/t −1; Rtt = (1+i∗tt) S St 12/t −1.
It is necessary to clarify that even if the national interest rate is within these bands it cannot be guaranteed withfirmness that the target zone is credible. On the other hand, if the domestic inter-est rate falls significantly outside of the return bands, we are able to confirm that this exchange-rate system during the period under study is not credible.
2.2.2. Drift adjustment test
Svensson (1991)’s test has been criticized because it cares only about the possibility of a realign-ment (change in the established central parity level) when the exchange rate is close to thefl uc-tuation band limits. For this reason, we have selected another alternative procedure, known as the method ofDrift adjustment(DA). This method, originally proposed by Bertola and Svensson (1993), consists of estimating, through a linear regression model, the realignment expectations of economic agents conditioned to have experienced one of these events before. This indicator,
reverse of the measure of credibility, is obtained by taking the uncovered interest parity hypoth-esis, decomposing the exchange rate into two components (central parity and exchange rate within the band) and taking into account that
Et[Dxt+t] = (1−ptt)Et D xt+t nr + ptt Et D xt+t r ,
whereptt is the probability determined at timetof experiencing a realignment during the period betweentandt +τ. The right side of the expression indicates if the expectation is conditioned to having submitted a realignment (r) or not having it experienced (nr). Moreover, taking into account the definition of devaluation, the following expression contains in itsfirst term on the right side the expected realignment and in the second one its own expected depreciation within the band: gtt= Et[Dct+t] t + pt t t Et xt+t r − Et xt+t nr .
Finally, we obtain that
gtt =it − i∗t − Et[Dxt+t/nr]
t .
To obtain the expected devaluation we proceed in the following way:first, we estimate the expected depreciation within the band conditioned on not having suffered any realignment (last term in the right side of this equation) and subsequently applying the interest rate differential we achievegtt. Instead of working with the point estimation, we calculate confidence intervals with a 0.10 significance level for our interest variable.
In order to estimate the expected depreciation within the band according to the DA method, we use the linear regression model proposed by Svensson (1993) in which the explanatory vari-ables to consider are the logarithm of the distance of the exchange rate with respect to the central parity (xt ) and 3 months interbank interest rates, both national and Euro Zone (itandi∗t, respect-ively): xt+t−xt t = j ajdj+b1xt+ b2it+b3i∗t +et+t.
The dummy variablesdjtake value one during the sub-period between realignments andfl uc-tuation bands enlargement.4
Since the expected depreciation with the band needs to be predicted taking into account that it is conditioned on not having experienced any episode of realignment, Svensson (1993) removes the observations associated with the 3 months preceding the realignments occurred. However, to avoid reducing the number of observations significantly, we follow the Ledesma-Rodríguez, Navarro-Ibáñez, Pérez-Rodríguez, and Sosvilla-Rivero (2000) and Ledesma-Rodríguez et al. (2005a)’s procedure, the estimation is based on the whole sample. This means that, instead of obtaining the expected devaluation gtt, we get the expected realignment.
2.2.3. Discrete choice models
Since our interest is to be able to calculate the probability of realignment for thesefive countries, we consider non-linear probabilistic models that allow reliable estimates for the dichotomous variables. The most common models focus on the function of logistic and standard normal distri-bution, known as Logit and Probit models, respectively. This paper presents the results related to the Logit model, since the Logit and Probit estimated coefficients are very similar5(see, e.g. Ameniya,1981, in which it is stated that: bLOGITˆ =1.6∗bPROBITˆ ).
Our dependent variable will be built based on the results obtained by the DA method in order to get estimated probabilities’time series. In particular, when both confidence interval limits of the expected depreciation within the band are greater or less than zero, we say that there is no credibility, assigning value 0 to the interest variable (yt=0 ) and when this condition is not ful-filled the dependent variable takes value 1 (yt=1 ), indicating credibility in the exchange system. The probability that agents assign the value 1 in a given moment can be calculated from the fol-lowing expression:
P(yt =1) = L(zˆ′tb) = ezˆ′tb
1+ezˆ′tb ,
wherezˆ′tb = b1 + b2z1t,L(.) is the cumulative logistic distribution function,z1t is the expla-natory variable (this model considers the exchange rate, the distance from the central parity, the distance from the upper limit of the band, and the interest rates differential) andP(yt=0)is the probability of realignment.
3. Empirical results
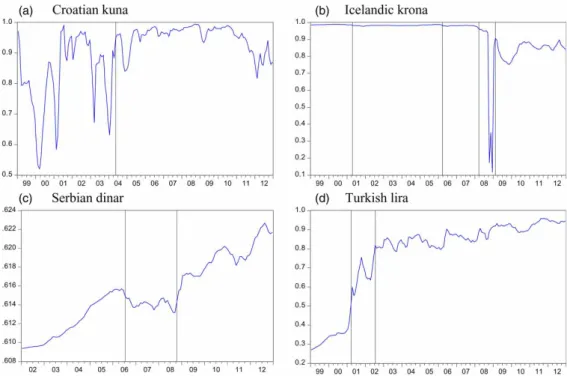
In this section we proceed with the detection of de factofluctuation bands of the exchange rates for thefive countries during the period 1999:01–2012:12 using the three sequential procedures. In addition, we analyse, country by country, the results of the three credibility indicators as a measure of robustness, making a comparison between them, trying tofigure out which one is the most accurate in identifying stages of credibility crisis. The monthly exchange rates are spot rates expressed as domestic monetary units per euro and have been downloaded from the European Central Bank (ECB) and the Eurostat websites.Figure 1(Panels A–E) reflects the evol-ution of thefive countries exchange rates vis-à-vis the euro, besides their central parities and their fluctuation bands. We exhibit the main conclusions about the implicitfluctuation bands, country-by-country, relying onTable 1.6
Croatia: The behaviour of the Croatian kuna/euro exchange rate (HRK/EUR) shows patterns consistent with a de factofixed exchange-rate regime that is endorsed by our detection criteria, although in a different degree. The contrast directly on average variations proposed by Ledesma-Rodríguez et al. (2005b) concluded the presence of ±2% and ±1%fluctuation bands in 100% of the sample, selecting the latter for being the narrowest. In the same line Reinhart and Rogoff (2004)’s method is positioned, who also identified that bands of ±2% throughout the period reduced this percentage to 74.85% of the sample after proceeding to its relevant stat-istical contrast (1999:01–2001:07 and 2003:04–2012:12). Analysing potential ±1% bands, the percentage is still quite significant, we are talking that the first procedure detects a 61.40% (1999:01–2001:07 and 2005:03–2012:12), keeping a 37.43% (2001:2001–01:03, 2006:04– 2008:11, 2010:11–2012:12) in the second.
FromFigure 1(Panel A) can be seen two sharp declines in the exchange-rate HRK/EUR; the first, in July 2001 and the second episode is associated with the global financial crisis, which
eventually lead to the appreciation of the local currency in September and November 2008. Based on the Svensson (1991)’s test, both events have coincided with a lack of credibility in the fluctuation band by economic agents (Figure A1, Panel A in the Appendix). This figure shows high volatility in the credibility throughout the whole period identifying stages in which the evolution of the interest rate is above the return band and stages in which the opposite happens.
Figure 1. Evolution of the exchange rates vis-à-vis the euro, their central parities and theirfluctuation bands. Panel A: Croatian kuna; Panel B: Icelandic krona; Panel C: Denar (of the former Yugoslav Republic of Macedonia); Panel D: Serbian dinar; and Panel E: Turkish lira.
In addition to the phase associated with not much credibility after the realignment occurred in 2004:05, that the DA method detects from 2004:10 to 2005:02, other previous stages are ident-ified (1999:12–2000:04, 2001: 07, and 2004:01) and subsequent phases coinciding with thefi nan-cial crisis (2009:02–2009:03). The last criterion using all the explanatory variables reinforces the previously identified stages: 1999–2001, along with the stage at the end of 2008 and at the begin-ning of 2009.
Iceland: Beginning our analysis for the checking of the existence of ±2%fluctuation band in the exchange-rate Icelandic krona/euro (ISK/EUR), the last procedure is capable of specifying the following sub-periods 1999:01–2008:03, 2008:05, 2008:07–2008:08, 2008:10–2008:12, and 2010:10–2012:12 as those in which the exchange rate does not experiment deviations with respect to the above-mentioned bands. This 72.51% that it represents on the whole sample period moves away enough of the contributed ones for the remaining methods. The first one just determines a 14.04% (1999:01, 2003:12–2005:05, 2011:05–2011:08, and 2012:01), whereas the second one accepts the hypothesis of the absence of bands during the whole period. We do not alsofind any evidence of which the probability of these percentage absolute monthly variations of the exchange-rate ISK/EUR is under ±1%fluctuation bands in any sub-period, result that it reiterated after having been filtered through its statistical significance. Table 1. Detection of ±1% or ±2% implicitfluctuation bands country-by-country using Reinhart and Rogoff (2004), Ledesma-Rodríguez et al. (2005a), and Ledesma-Rodríguez et al. (2005b)’s procedures.
Reinhart and Rogoff (2004)
Ledesma-Rodríguez et al. (2005a) Ledesma-Rodríguez et al. (2005b) ±1% ±2% ±1% ±2% ±1% ±2% Croatia 1999:01– 2001:08 1999:01– 2012:12 1999:01– 2001:03 1999:01– 2001:07 1999:01– 2012:12 1999:01– 2012:12 2005:03– 2012:12 2006:04– 2008:11 2003:04– 2012:12 2010:11– 2012:12 Iceland – 1999:01– 2000:12 – – 2003:10– 2005:09 1999:01– 2008:12 2003:12– 2005:05 2010:10– 2012:12 2011:05– 2011:08 2012:01 Macedonia 1999:01– 2012:12 1999:01– 2012:12 1999:01– 2012:12 1999:01– 2012:12 1999:01– 2012:12 1999:01– 2012:12 Serbia – 1999:01– 2007:12 – 1999:01– 2006:06 1999:01– 2008:10 1999:01– 2012:12 2010:07– 2011:12 2010:12– 2011:04 2010:04– 2012:02 Turkey – – – – – 2004:06– 2008:10 2010:02– 2012:12
On the other hand, and taking into account that the critical region is above the average of percen-tage variations, this means the acceptance of the presence of minor or equal to ±1% bands for the following sub-periods: 2000:12, 2001:02–2001:03, 2003:10–2005:09, 2008:10–2008:11, 2012:01–2012:02, and 2012:04–2012:07 which represent a 20.47% of the sample.
The sharp depreciation of the exchange rate at the end of 2008 which can be perceived as quite remarkable fromFigure 1(Panel B) is due to thefinancial crisis that took place in this economy. Even though the interest rate is within the return bands during only 3 months, this fact does not guarantee, according to Svensson (1991) a period of credibility on the fluctuation bands. However, we can affirm that from October 2008 onwards there is evidence of a lack of credibility by the economic agents. In addition, the exchange-rate ISK/EUR also shows evidence of devi-ations from the minimum limit, both 2000:03–2000:05, 2005:10–2006:03, and 2010:08– 2010:12, this situation is a consequence of the high lack of credibility associated with thefl uctu-ation bands (see Figure A1, Panel B in Appendix). This argument is also applicable to stages in which the exchange rate has experienced deviations from the upper limits of thefluctuation bands (2009:08–2010:01).
The absence of credibility detected in 2001:03 by the DA mechanism (Figure A2, Panel B in Appendix) confirms the ability by the economic agents to anticipate correctly that the later (in 2001:04) would lead to a realignment of the exchange rate. This situation is reiterated in the third and fourth realignment, which takes place as a result of the economic crisis and the diffi cul-ties to refinance its short-term debt, leading to the collapse of three major commercial banks in its country.
Unlike prior procedures, in which a larger number of confidence crisis are detected, the binary choice method only identifies, by unanimity, the stage at the end of 2008, and at the beginning of 2009 (see Panel B in Figures A3 and A4 in Appendix).
The former Yugoslav Republic of Macedonia: In spite of the fact that Macedonia is a candidate country to became part of EU, the exchange-rate Denar (of the former Yugoslav Republic of Macedonia)/euro (MKD/EUR) presents a standard behaviour typical enough of an exchange system distinguished by the stability, which would suppose an impulse on trade and investment.7 This statement has its base in the achieved results across the three sequential procedures that con-sider the exchange rate’s dynamic. All of them support the existence of ±1%fluctuation bands and of ±2% throughout the whole period.
Although the exchange rate remains stable without deviating at any time from itsfluctuation bands (Figure 1, Panel C), both the Svensson test and DA method confirm the lack of confidence in the exchange rate during this period. In Figure A1 (Panel C) the profitability associated with borrowing in foreign market to finally lend on the national one stays significantly away from the return bands. On the other hand, the expectation of depreciation within the band for this can-didate country holds throughout the whole period, since both confidence interval limits are greater than zero (see Figure A2, Panel C in Appendix).
Serbia: The disparity between previous methods becomes evident for the Serbian dinar/euro exchange rate (RSD/EUR). If we focus on the potential band of ±1%, Reinhart and Rogoff (2004) and Ledesma-Rodríguez et al. (2005a)’s methods suggest the lack of ±1% bands. In con-trast, the last criterion proposes the following sub-periods: 2010:04–2012:02 and 2012:05 as those in those where the average of percentage variations does not deviate from a ±1% band or from a narrower band (representing 60.74% of the sample). Major conformity seems to exist when ±2% fluctuation band is considered, though not so much in magnitude. The first mechanism is capable of detecting a 49.63% (1999:01–2007:12 and 2010:07–2011:12), the second one diminishes its percentage up to 26.67% (1999:01–2006:06 and 2010:12– 2011:04), whereas the last one recognizes the totality of sample (in this case given the available information: 2002:01–2012:12).
Examining the behaviour of the Serbian dinar vis-à-vis the EUR, it can confirm how barely trading around the central parity in fact is often close to the upper and lowerfluctuation bands (Figure 1, Panel D).
At the beginning of the period, the lack of credibility was clearly significant, but in spite of this scenario, a gradually reduction to its minimum in 2007:08 is achieved (Figure A1, Panel D in Appendix). From this date, since the return bands delimit the evolution of the exchange rate, the absence of credibility disappears, increasing again in 2009:01, a time when the interest rate stands at 18.61%. Given the availability of data from the interbank rate for this economy, we are unable to confirm whether the positive deviation from the upper limit of thefluctuation band has been due to the lack of credibility of the agents to these bands.
According to the DA procedure (Figure A2, Panel D in Appendix), the expected depreciation within the band becomes more important in 2004:02–2005:11, just at the moment in which rea-lignments occur (2006:07 and 2008:10) and, like the Svensson test, from January to May 2009 and again in July 2010.
Figure A3 (Panel C) in Appendix shows a clear trend of increase in the probability of realign-ment as time evolves, presenting values around 0.61 in the two realignrealign-ments upcoming dates. Around more than 50% is the probability for thefirst realignment when we analyse the distance from the central parity as an explanatory variable, a completely opposite situation for the second realignment, where barely reach 10% (Figure A4, Panel C in Appendix). Considering the distance from the upper limit of thefluctuation band,8we also identify a high volatility in the estimated probability of the exchange system collapse since at least this probability is around 30% at any time during the whole period.
Turkey: We do notfind evidence that allows us to confirm the presence of ±1% not of ±2% implicit fluctuation bands for the Turkish lira/euro exchange rate (TRY/EUR) using the first two approaches. On the one hand, if we analyseTable 1, we can verify that the proportion of monthly TRY/EUR exchange-rate variation does not exceed threshold nor the critical region, respectively. On the other hand, the last procedure does not identify the presence of narrow bands of ±1%. Nevertheless, it is capable of detecting the following substages (2004:06– 2008:10 and 2010:02–2012:12), in which the exchange rate does not turn aside ±2% bands repre-senting 52.38% of the sample.
This other candidate country for EU membership does not present a clear trend of currency depreciation or appreciation; nevertheless, it identifies significant fluctuations during the 13 years examined (Figure 1, Panel E). As a consequence of speculative attacks, it has generated an uncertain environment supported by the three methods used as tools for robustness. First, the Svensson test shows no credibility from the beginning to the end of the period analysed, although it shows a downward trend, reducing significantly from mid-2005 (Figure A1, Panel E in Appendix). The DA method also offers a multitude of accurate dates for which the expected depreciation within thefluctuation band acquires more importance; among them, at the end of 1999, during 2001 and 2002 (coinciding with the realignment of 2001:03 and 2002:07) and sub-sequently to the extension of bands in 2004:05–2004:11, 2006:06, and 2011:08.
Finally, the discrete choice method shows an average probability of the expected realignment over than 20%. With the exception of Panel D of Figure A3 in Appendix, where an increase in agents’ confidence is detected as we move away along the time horizon, the Panel D of Figure A4 in Appen-dix shows short periods but high distrust in the exchange rate over the whole sample period.
4. Conclusions
Having applied three sequential procedures based on the evolution of the exchange rate vis-à-vis the euro onfive candidates countries to join the EU, our results suggest the presence of ±2% and
±1% implicitfluctuation band in high percentages of the sample period. These percentages vary depending on the methodology used, even reach 100% in countries such as Croatia, the former Yugoslav Republic of Macedonia and Serbia. Therefore, this paper provides new empirical evi-dence that strengthens the hypothesis that the implemented policies differ from those announced by the monetary authorities, identifying the existence of de factofixed monetary systems along a large number of sub-periods for different currencies. In other words, it has been detected that many of these countries act as if they were already de facto (but not de iure) in the ERM-II, showing an evolution of their currencies consistent with the existence offluctuation bands vis-à-vis the euro.
Nevertheless, the simple Svensson test, the DA method, and discrete choice models indicate lack of credibility for a high percentage of the sample in which the evolution of the exchange rate exceeds the detected minimum and/or maximumfluctuation bands’limits, suggesting that econ-omic agents do not behave as if these bands actually were in force at the time of making their financial plans. Furthermore, these countries do not show signs of improvement in the confidence on thefluctuation bands as time evolves. In fact, in countries such as Croatia, the former Yugoslav Republic of Macedonia, and Turkey an important volatility in the credibility throughout the period analysed can be observed, a conclusion that is reinforced by the implementation of the three different methods. The other candidate countries reveal extended stages of absence of credi-bility accompanied by an upward trend in the probacredi-bility of realignment.
It should be emphasized that the three alternative procedures have been able to capture accu-rately those stages of absence of credibility prior to those realignments that really occurred sub-sequently. In some cases, the three methods coincide identifying the sub-periods of lack of credibility, while in others they complement each other improving the results. On the other hand, thefigures associated with the simple Svensson test reveal us a pattern of behaviour that can be seen in most of the analysed currencies: the domestic interest rate deviates quite often above the upper limit of the return band indicating the ease of borrowing abroad to subsequently lend in the domestic market.
Thus, it seems that the results offer a wide variety of strategies in the countries under study when they link de facto to the ERM-II to try on the one hand to capture the benefits of their participation (helping actively to stabilize their economies–especially on prices and consolidation of public accounts–and the increase in the governments reputation), moderating somewhat the potential pro-blems arising from formal participation (de iure) in the ERM-II (primarily the possibility of currency appreciation episodes due to capital inflows, especially by foreign direct investment).
Acknowledgements
The authors wish to thank an anonymous referee and the editor for their helpful comments and suggestions on a previous draft of this article, which helped to substantially improve the content and quality of the article. Responsibility for any remaining errors rests with the authors.
Disclosure statement
No potential conflict of interest was reported by the authors.
Funding
This paper is based upon work supported by the Spanish Ministry of Economy and Competitiveness (pro-jectECO2011-23189). One of the authors also gratefully acknowledges the grant from the Spanish Ministry of Science and Innovation [FPU AP2008-004015].
Notes
1. For example, the latest Flash Eurobarometer issued by the European Commission (‘Introduction of the euro in the Member States that have not yet adopted the common currency’) indicates that over half of the respondents think that the impact of euro has been positive in the countries that have already adopted it, but a relative majority think that adopting the euro will mean that their country will lose control over its economic policy.
2. We will consider Croatia as a CCC since it becomes the 29th Member State of the EU from 1 July 2013. Regarding Iceland, although on 13 September 2013, the Government of Iceland suspended its application to join the EU, it was also a CCC during the examined sample. Nevertheless, the EU has stated that Iceland had not formally withdrawn the application.
3. This exchange rate system has been adopted by developing countries experiencing high inflation. Examples are Chile, Colombia, Israel, Indonesia, Ecuador, Russia, and Venezuela.
4. As Ledesma et al.(2005a,2005b), we also implemented thefluctuation bands expansion, given the importance within ERM II.
5. The similarity of the coefficients is due to their own distribution functions. To be symmetric around zero it is reasonable that the estimated coefficients are practically equal and differ closed to the tails. Both models are very similar with respect to the predicted probabilities (Cameron & Trivedi, 2010).
6. Due to space limitations, we do not show graphically the detection of implicitfluctuation bands for each currency analysing the three alternative procedures for ±1% and ±2%, but they can be requested from the authors.
7. Given that underfixed exchange rates the monetary authority is committed to defend its exchange rate maintaining its central parity or ensuring that its path is within thefluctuation band provokes a favour-able context for investment and trade as a result of the reduction in the degree of uncertainty and reduced transaction costs.
8. Due to space limitations we do not show graphically the estimated realignment probability of the exchange rates vis-à-vis euro based on the distance from the upperfluctuation band nor based on the interest rate differential with respect to the Euro Zone, nevertheless it is possible to request them from the authors.
9. Both the national and the Euro Zone interest rate corresponds to the 3-month interbank extracted from Eurostat and the ECB.
10. Recall that these estimated coefficients have no interpretation to which we are accustomed to work in traditional econometrics, for this reason the calculation of the marginal effects is necessary, but as an the objective of this paper, we are concerned about their sign to see how these variables influence the probability of realignment.
Notes on contributors
Simon Sosvilla–Rivero has an MSc in Economics (Universidad Autonoma de Barcelona, Spain and London School of Economics, UK) and a Ph.D. in Economics (University of Birmingham, UK). His research inter-ests are in the interdisciplines of international economics and applied econometrics. He has published articles in international journals in hisfield, including International Review of Economics and Finance, Journal of Banking and Finance, Journal of Applied Econometrics and Journal of International Money and Finance. His articles have also appeared in several proceedings of national and international conferences. He is cur-rently Full Professor of Economics at the Universidad Complutense de Madrid (Spain).
María del Carmen Ramos Herrera has recently completed her Ph.D. at the University Complutense of Madrid. She has worked as Teaching Assistant at the University Carlos III of Madrid and University Com-plutense of Madrid for several years. She also has experience working with big data in projects organized by the Spanish Association of Foundations and University of La Laguna. Her works can be found in journals such as Applied Economics Letters and Cuadernos de Economía. Her research interests include applied macroeconomics, econometrics, international economics, panel data analysis and exchange rate regimes.
ORCID
Simón Sosvilla-Rivero http://orcid.org/0000-0003-2084-0640
References
Ameniya, T. (1981). Qualitative response models: A survey.Journal of Economic Literature,19, 1483– 1536.
Åslund, A. (2011). Exchange rate policy and the Central and East European financial crisis. Eurasian Geography and Economics,52, 375–389.
Bauer, C., & Herz, B. (2005). How credible are the exchange rate regimes of the new EU countries?: Empirical evidence from market sentiment.Eastern European Economics,43, 55–77.
Bertola, G., & Svensson, L. E. O. (1993). Stochastic devaluation risk and the empiricalfit of target-zone models.Review of Economic Studies,60, 689–712.
Bubula, A., & Otker-Robe, I. (2002).The evolution of exchange rate regimes since 1990: Evidence from de facto policies(Working Paper No. 02–155). Washington: International Monetary Fund.
Cameron, A. C., & Trivedi, P. K. (2010).Microeconometrics using Stata(revised ed.). College Station, TX: Stata Press Publication.
Campos, M. I., & Torres, J. L. (2007). Exchange rate dynamics in crawling-band systems. Economic Bulletin,6, 1–9.
Coudert, V., & Couharde, C. (2012).Exchange rate regimes and sustainable parities for CEECs in the run-up to EMU membership (Working Paper No. 2002–15). Paris: Centre d’Etudes Prospectives et d’Informations Internationales.
Darvas, Z. (2001). Exchange rate policy and economic growth after thefinancial crisis in Central and Eastern Europe.Eurasian Geography and Economics,52, 390–408.
Ferrari-Filho, F., & De Paula, L. F. (2008). Exchange rate regime proposal for emerging countries: A Keynesian perspective.Journal of Post Keynesian Economics,31, 227–248.
Giavazzi, F., & Pagano, M. (1988). The advantage of tying one’s hands. EMS discipline and central bank credibility.European Economic Review,32, 1055–1082.
Josifidis, K., Allegret, J. P., & Pucar, E. B. (2013). Adjustment mechanisms and exchange rate regimes in 2004 new EU members during thefinancial crisis.Post-Communist Economies,25, 1–17.
Kane, D. R. (1988).Principles of internationalfinance. London: Croom Helm.
Ledesma-Rodríguez, F., Navarro-Ibáñez, M., Pérez-Rodríguez, J., & Sosvilla-Rivero, S. (2000). On the credibility of the Irish pound in the EMS.The Economic and Social Review,31, 151–172.
Ledesma-Rodríguez, F., Navarro-Ibáñez, M., Pérez-Rodríguez, J., & Sosvilla-Rivero, S. (2005a). Assessing the credibility of a target zone: Evidence from the EMS.Applied Economics,37, 2265–2287. Ledesma-Rodríguez, F., Navarro-Ibáñez, M., Pérez-Rodríguez, J., & Sosvilla-Rivero, S. (2005b).
Regímenes cambiarios de facto yde iure. Una aplicación al tipo de cambio yen/dólar. Moneda y Crédito,221, 37–68.
Levy-Yeyati, E., & Sturzenegger, F. (2005). Classifying exchange rate regimes: Deeds vs. words.European Economic Review,49, 1603–1635.
Newey, W. K., & West, K. D. (1987). A simple, positive semi-definite, heteroskedasticity and autocorrelation consistent covariance matrix.Econometrica,55, 703–708.
Piragic, S., & Jameson, K. P. (2005). The determinants of Latin American exchange rate regimes.Applied Economics,37, 1465–1474.
Reinhart, C. M., & Rogoff, K. S. (2004). The modern history of exchange rate arrangements: A reinterpreta-tion.Quarterly Journal of Economics,119, 1–48.
Rodríguez, J., & Rodríguez, H. (2003).How tight should one’s hands be tied? Fear offloating and credibility of exchange rate regimes(Working Paper No. 96). Barcelona: Barcelona Economics.
Rose, A., & Svensson, L. (1994). European exchange rate credibility before the fall.European Economic Review,38, 1185–1216.
Shambaugh, J. C. (2004). The effect offixed exchange rates on monetary policy.The Quarterly Journal of Economics,119, 301–352.
Stockman, A. C. (1999). Choosing and exchange-rate system.Journal of Banking and Finance,23, 1483– 1498.
Svensson, L. E. O. (1991). The simplest test of target zone credibility.IMF Staff Papers,38, 655–665. Svensson, L. E. O. (1993). Assessing target zone credibility: Mean reversion and devaluation expectations in
the ERM, 1979–1992.European Economic Review,37, 763–802.
Szapáry, G. (2001).Maastricht and the choice of exchange rate regime in transition countries during the run-up to EMU(Working Paper No. 6). London: European Network of Economic Policy Research Institutes.
Appendix. Additional results
Figure A1 (Panels A–E) indicates, for each of the investigated countries, at what time the domestic interest rate9is outside the return bands since this is evidence of the lack of credibility in these sub-periods. Each of thesefigures is explained in detail when we focus on a particular interpretation of each country making a comparison between the three considered approaches.
The results on how the explanatory variables of the method DA influence the expected depreciation within the band are provided in Table A1. These coefficients have been estimated by OLS, correcting their standard errors for possible heteroskedasticity or serial correlation using the Newey and West (1987) covariance estimator. Among the main conclusions, note that the coefficient associated with the logarithm of the distance from the central parity (x) is highly significant and inversely affects the expected depreciation within the band, corroborating the average of exchange rate reversion hypothesis for all currencies under study. This negative sign means that if economic agents observe at time ta deviation from its central parity they form stabilizing expectations, that is, expect that the exchange rate is close to the central parity in the following period stabilizing their behaviour towards equilibrium. However, in our study there is no consensus on how it affects the profitability of holdingfinancial assets in domestic currency (i) and foreign currency (i*) on the expected depreciation. Starting with the domestic interest rate, the only currency that matches with the results of Svensson (1993), Rose and Svensson (1994), and Ledesma-Rodríguez et al. (2000, 2005a) is the Icelandic krona reflecting the expected negative sign, being significant at 10%. Other currencies show both positive and negative signs varying with the level of significance.
With respect to the reference interest rate relative to the Euro Area, this variable cannot be considered as explanatory of the expected depreciation behaviour since it does not display significance in any country. Finally, taking into account the highp-values that show the dichotomous variables, the limited relevance of the different exchange rate regimes can be concluded.
Moreover, Table A2 shows the results of estimating the Logit model for the different explanatory vari-ables explained in Section 2, in order to assess the probability of realignment. In this procedure, and given our interest, we focus on the signs interpretation of the estimated coefficients.10As in Ledesma-Rodríguez et al. (2005a), wefind that in most of the sample, there is enough empirical evidence to say that as a result of depreciation of the domestic currency, an increase (decrease) in the probability of realignment (credibility) occurs.
As in Ledesma-Rodríguez et al. (2005a), wefind that in most of the samples, there is enough empirical evidence to confirm that a domestic currency depreciation provokes an increase (decrease) in the probability of realignment (credibility). However and contrary to expectations, for the Turkish lira, it can be seen that a depreciation vis-à-vis the euro would trigger a significant increase in the credibility of the exchange rate system. In general, with the exception of the Serbian dinar, Croatian kuna, and Icelandic krona, it shows, with high significance, how the fact of turning aside the central parity negatively affects the probability of the exchange regime credibility. Another indicator that has been used in this paper as a robustness measure is the distance with respect to the upperfluctuation band.
As expected, the domestic interest rate differential with respect to the Euro Zone triggers a negative and highly significant impact on the probability of credibility, thereby increasing the probability of a realignment in the exchange rate.
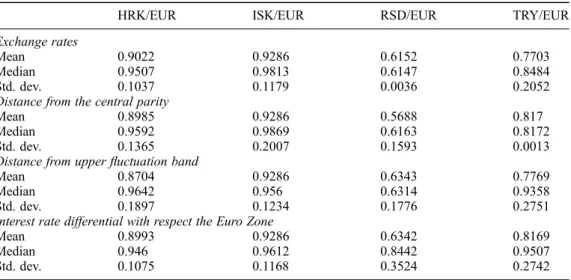
Due to space limitations, Table A3 provides the most important descriptive statistics (mean, median, and standard deviation) of the estimated probability of realignment for all exchange rates analysed in this paper according to the four explanatory variables, however anyone interested in the rest of descriptive statistics can request them from the authors.
9
Both the national and the Euro Zone interest rate corresponds to the 3-month interbank extracted from Euro-stat and the ECB.
10
Recall that these estimated coefficients have no interpretation to which we are accustomed to work in tra-ditional econometrics, for this reason the calculation of the marginal effects is necessary, but as an the objec-tive of this paper, we are concerned about their sign to see how these variables influence the probability of realignment.
Figure A2. Expected realignment rate of the exchange rates vis-à-vis the euro and its confidence interval at 90%. Notes: The vertical lines correspond to realignments and bands extensions.
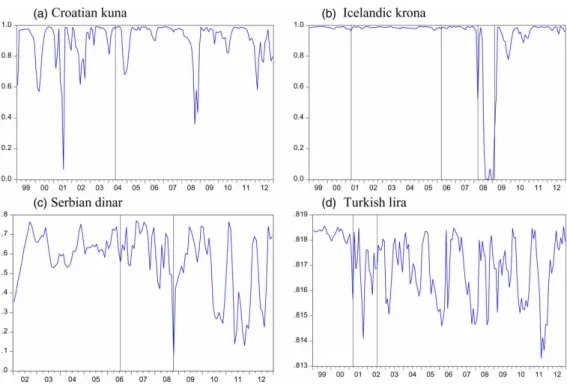
Figure A3. Estimated realignment probability of the exchange rates vis-à-vis the euro based on its exchange rates vis-à-vis the euro.
Notes: The vertical lines correspond to realignments and bands extensions. It is not possible to represent the exchange rates graphically for those cases where the dependent variable always takes the same value (either one or zero) since this procedure cannot be applied.
Figure A4. Estimated realignment probability of the exchange rates vis-à-vis the euro based on the distance from the central parity.
Notes: The vertical lines correspond to realignments and bands extensions. It is not possible to represent the exchange rates graphically for those cases where the dependent variable always takes the same value (either one or zero) since this procedure cannot be applied.
Table A1. Expected depreciation of the exchange rates within the band.
HRK/EUR ISK/EUR MKD/EUR RSD/EUR TRY/EUR
D1 −0.0035 (0.8439) 0.0071 (0.9641) −0.0035 (0.5700) 0.1275 (0.2098) −0.0898 (0.5724) D2 −0.0213 (0.1915) 0.0495 (0.7122) −0.0025 (0.5714) 0.0171 (0.8727) −0.0579 (0.8004) D3 0.1398 (0.4083) 0.0002 (0.9704) 0.1357 (0.0760) −0.0057 (0.9427) D4 −0.2223 (0.3939) D5 0.0867 (0.3249) X −2.7071 (0.0000) −5.2159 (0.0000) −2.3167 (0.0000) −2.3138 (0.0000) −2.8542 (0.0000) i 0.5283 (0.0052) −1.4886 (0.2540) 0.0012 (0.9047) −0.7743 (0.0582) 0.3303 (0.0667) i∗ −0.6588 (0.2462) 2.7714 (0.4985) 0.0679 (0.3009) 0.4702 (0.8338) −2.6932 (0.3155)
Notes: In parentheses are thep-values. The dummy variables D1–D5 take value one between realignments andfluctuation bands enlargement,Xrepresents the logarithm of the distance of the exchange rate with respect to the central parity andi
Table A2. Estimation results of the Logit model.
HRK/EUR ISK/EUR RSD/EUR TRY/EUR
Exchange rates d1 64.6116 (0.0003) 6.5904 (0.0000) 2.0528 (0.3674) −1.7263 (0.0244) d2 −8.3249 (0.0004) −0.0296 (0.0002) −0.0093 (0.7332) 1.9515 (0.0000) Distance from the central parity
d1 4.8031 (0.0000) 5.0495 (0.0000) 1.2222 (0.0258) 1.5066 (0.0000) d2 −21.4428 (0.0001) −0.2322 (0.0001) 0.0377 (0.8979) −0.1153 (0.9699) Distance from upperfluctuation band
d1 −1.2482 (0.0627) 3.5159 (0.0000) −0.5363 (0.3791) −1.4635 (0.0039) d2 19.7021 (0.0000) −0.0697 (0.0005) 0.5669 (0.0031) 22.7604 (0.0000) Interest rate differential with respect the Euro Zone
d1 2.9402 (0.0000) 6.2424 (0.0000) −0.2713 (0.6175) 4.0098 (0.0000) d2 −0.2545 (0.0007) −0.4456 (0.0001) 0.2289 (0.0140) −0.0744 (0.0000)
Notes: In parentheses are thep-values. In each case we show the estimated parameters associated with each explanatory variable (exchange rates, distance from the central parity, distance from upperfluctuation band, and interest rate differential with respect to the Euro Zone) that we consider explains the probability of realignment.
Table A3. Statistical summary of the estimated probability.
HRK/EUR ISK/EUR RSD/EUR TRY/EUR
Exchange rates
Mean 0.9022 0.9286 0.6152 0.7703
Median 0.9507 0.9813 0.6147 0.8484
Std. dev. 0.1037 0.1179 0.0036 0.2052
Distance from the central parity
Mean 0.8985 0.9286 0.5688 0.817
Median 0.9592 0.9869 0.6163 0.8172
Std. dev. 0.1365 0.2007 0.1593 0.0013
Distance from upperfluctuation band
Mean 0.8704 0.9286 0.6343 0.7769
Median 0.9642 0.956 0.6314 0.9358
Std. dev. 0.1897 0.1234 0.1776 0.2751
Interest rate differential with respect the Euro Zone
Mean 0.8993 0.9286 0.6342 0.8169
Median 0.946 0.9612 0.8442 0.9507