econ
stor
Der Open-Access-Publikationsserver der ZBW – Leibniz-Informationszentrum Wirtschaft
The Open Access Publication Server of the ZBW – Leibniz Information Centre for Economics
Nutzungsbedingungen:
Die ZBW räumt Ihnen als Nutzerin/Nutzer das unentgeltliche, räumlich unbeschränkte und zeitlich auf die Dauer des Schutzrechts beschränkte einfache Recht ein, das ausgewählte Werk im Rahmen der unter
→ http://www.econstor.eu/dspace/Nutzungsbedingungen nachzulesenden vollständigen Nutzungsbedingungen zu vervielfältigen, mit denen die Nutzerin/der Nutzer sich durch die erste Nutzung einverstanden erklärt.
Terms of use:
The ZBW grants you, the user, the non-exclusive right to use the selected work free of charge, territorially unrestricted and within the time limit of the term of the property rights according to the terms specified at
→ http://www.econstor.eu/dspace/Nutzungsbedingungen By the first use of the selected work the user agrees and declares to comply with these terms of use.
zbw
Leibniz-Informationszentrum Wirtschaft Leibniz Information Centre for EconomicsSrinivasan, P.; Ibrahim, P.
Article
Price Discovery and Asymmetric Volatility Spillovers
in Indian Spot-Futures Gold Markets
International Journal of Economic Sciences and Applied Research
Provided in Cooperation with:
Eastern Macedonia and Thrace Institute of Technology (EMaTTech), Kavala, Greece
Suggested Citation: Srinivasan, P.; Ibrahim, P. (2012) : Price Discovery and Asymmetric Volatility Spillovers in Indian Spot-Futures Gold Markets, International Journal of Economic Sciences and Applied Research, ISSN 1791-3373, Vol. 5, Iss. 3, pp. 65-80
This Version is available at: http://hdl.handle.net/10419/114575
Price Discovery and Asymmetric Volatility Spillovers in Indian Spot-Futures Gold Markets
P. Srinivasan1 and P. Ibrahim2
Abstract
This study attempts to examine the price discovery process and volatility spillovers in Gold futures and spot markets of National Commodity Derivatives Exchange (NCDEX) by employing Johansen’s Vector Error Correction Model (VECM) and the Bivariate ECM-EGARCH(1,1) model. The empirical result confirms that the spot market of Gold plays a dominant role and serves as effective price discovery vehicle. Besides the study results show that the spillovers of certain information take place from spot market to futures market and the spot market of gold have the capability to expose the all new information through the channel of its new innovation.
Keywords: Price Discovery, Asymmetric Volatility Spillover, Cointegration, VECM, EGARCH Model
JEL Classification: G13, G14, C51
1. Introduction
India is the largest consumer of Gold in the world accounting for nearly 25% of the total gold consumption in the world. Most of India’s gold consumption is in the form of jewellery and as investment demand. Indian gold demand is supported by cultural and religious traditions which are not directly linked to global economic trends as a result of which demand remains steady even during high prices. The steadily rising prices of Gold reinforce the inherent value of gold jewellery, an intrinsic part of its desirability and also as a means of investment. The growth in investment demand has sparked numerous innovations in gold investment.
Gold Futures contract started trading on National Commodity Derivatives Exchange (NCDEX) from 2004 onwards. The introduction of gold futures trading allows integration of demand and supply of market participants, i.e., gold and jewellery manufacturers, exporters and importers, and investors, in organized markets. Using futures contract, the importers
1 Assistant Professor, Department of Economics, Christ University, Hosur Road, Bangalore 560029,
Karnataka, India. Tel: +91-9611273853, E-mail: srinivasan.palamalai@christuniversity.in
2 Professor, Department of Economics, Pondicherry University, Kalapet, Pondicherry, India.
and domestic buyers can minimize their price risk from the adverse price movements of underlying spot markets. Wide range of market participants ensure good price discovery. With ever increasing import demand, importers can insure themselves against price risk. The essence of spot and futures market in price discovery functions hinges on whether new information is first reflected in futures market or in spot markets. It has been argued, that the lead-lag relationship between spot and futures prices series can be attributed to one or more market imperfection like differences in transaction cost, liquidity differences between two market, short selling restriction, non-stochastic interest rate, different taxation regimes and differences in margin requirements.
The purpose of the present study is to examine the price discovery process and volatility spillover between the commodity spot and futures markets of gold in India. The present study possesses significance in the sense that it enables to determine which market is more efficient in processing and reflecting of new information. The study will throw light on the possibility of acting spot or future prices as an efficient price discovery vehicle, and this will be immensely useful for the traders to hedge their market risk. Besides, the study provides useful insights to the arbitrageurs, who are formulating their trading strategies based on market imperfections. Further, the present study is immensely helpful for the investors and portfolio managers to develop effective trading and hedging strategies in the Indian gold market.
2. Review of Literature
Attempts to investigate the futures-spot price relationships and volatility spillover have received considerable attention in the futures market literature. Earlier study by Gardbade and Silber (1983) used daily spot and futures prices for four storable agricultural commodities (wheat, corn, oats and orange juice) to understand the price discovery process in storable agricultural commodities. For wheat, corn and orange juice, they found that the futures markets dominate the spot markets, but for oats the results were not clear enough. Oellermann et al. (1989) and Schroeder and Goodwin (1991) studied the price discovery for livestock contracts and found that the futures markets capture the information first and then transfer it to the spot markets. Brockman and Tse (1995) investigated the price discovery mechanism of four agricultural commodities futures market in Canada using cointegration, vector error correction model and the Hasbrouck (1995) information model. They found that the futures market leads the spot market for all four commodities and hence the price discovery was mainly driven by the futures market. Fortenberry and Zapata (1997) examined the lead-lag relationship between futures and spot markets in the US for cheddar cheese, diammonium phosphate and anhydrous ammonia by using cointegration techniques. They found the evidence that futures and spot prices of diammonium phosphate and anhydrous ammonia markets are cointegrated but not that of cheddar cheese. Koutmos and Tucker (1996) examined the temporal relationships and dynamic interactions between S&P 500 spot index and stock index futures through VECM and ECM-EGARCH(1,1) model. He reported that volatility in both markets is an asymmetric function of past
innovations. Further, empirical analysis revealed that volatility spillover effects between the two markets are bidirectional.
Yang et al. (2001) examined the price discovery performance of the futures markets for storable (corn, oats, soybean, wheat, cotton, and pork bellies) and non-storable (hogs, live cattle, feeder cattle) commodities. They used cointegration procedures and vector error correction models (VECM) and found that futures markets lead the spot markets in the case of both storable and non-storable commodities. Moosa (2002) examined whether the crude oil futures market perform the function of price discovery and risk transfer. The study used the daily data of spot and one-month future prices of WTI crude oil covering from January 1985 to July 1996. He found that sixty percent of the price discovery function is performed in futures market.
Mattos and Garcia (2004) analyzed the lead-lag relationship between spot and futures prices in the Brazilian agricultural markets. They used daily data on Brazilian futures and spot prices of coffee (arabica), corn, cotton, live cattle, soybeans, and sugar and found mixed results. It was found that the futures and the spot prices were cointegrated in the case of live cattle and the coffee markets. Besides, the analysis revealed that there was no cointegrating relationship in the thinly traded markets (i.e., corn, cotton, soybeans). Tse and Xiang (2005) found that NYNEX E-mini futures contracts on gas and crude contribute more than thirty per cent of price discovery even though they account for less than one per cent of the volume of standard contracts.
Zapata et al. (2005) examined the relationship between eleven futures prices traded in New York and the world cash prices for exported sugar by considering the observation from January 1990 to January 1995. They found that the futures market of sugar leads the cash market in price discovery mechanism. Azizan et al. (2007) investigated the return and volatility spillovers in the Malaysian crude palm oil futures market using bivariate ARMA(p,q)-EGARCH(p,q) model specifications. They used daily price data of crude palm oil futures and spot markets and found bidirectional information transmission between futures and spot markets for both returns and volatility. Ge et al. (2008) examined the interactivity of Chinese cotton markets with the US market and found that futures prices of cotton in China and the US are cointegrated. Besides, the empirical analysis revealed that these two markets efficiently share price transmissions.
As regards to the research concerning India, Thomas and Karande (2001) studied the price discovery process in the castor seed futures market traded on Ahmedabad and Mumbai regional exchanges. They found that Ahmedabad and Mumbai markets react differently to information in the price discovery of castor seed. In the Bombay market, futures prices dominated the spot prices. However, no lead-lag between spot and futures prices was found in the Ahmedabad market. Kumar and Sunil (2004) investigated the price discovery of five Indian agricultural commodities futures market by employing the Johansen cointegration technique. They found inability on part of the futures market to fully incorporate information and confirmed inefficiency of Indian agricultural commodities futures markets.
Karande (2006) investigated the linkages between Indian castor seeds futures and spot market employing co-integration test. The study showed that the Indian futures markets
of Mumbai and Ahmedabad are cointegrated, indicating the existence of unidirectional causality from futures to spot market. Praveen and Sudhakar (2006) analyzed price discovery between stock market and the commodity futures market. They considered Nifty futures traded on National Stock Exchange (NSE) and gold futures on Multi Commodity Exchange of India (MCX). The result empirically showed that the Nifty futures had no influence on the spot Nifty. Besides, the casual relationship test in the commodity market showed that gold futures price influenced the spot gold price, but the opposite was not true.
Roy and Kumar (2007) investigated the lead-lag relationship between spot and futures prices of wheat spot markets in India using the Johansen cointegration test. It was found that the cointegration across spot markets had increased after the introduction of the futures market. Roy (2008) examined the price discovery process of thirty-two wheat futures contracts in India. He found that the Indian wheat futures markets are well cointegrated with their spot markets. The bidirectional causality observed in the majority of the wheat futures contracts.
Iyer and Pillai(2010) hadexamined whether futures markets play a dominant role in the price discovery process. They used two-regime threshold vector autoregression (TVAR) and a two-regime threshold autoregression for six commodities. They found that commodity futures market prices play the vital role in the price discovery process. For copper, gold and silver, the rate of convergence is almost instantaneous during the expiration week of the futures contract affirming the utility of futures contracts as an effective hedging tool. In the case of chickpeas, nickel and rubber, the convergence worsens during the expiration week indicating the non-usability of futures contract for hedging. Shihabudheen and Padhi (2010) examined the price discovery mechanism and volatility spillovers effect for six Indian commodity markets, viz., Gold, Silver, Crude oil, Castor seed, Jeera and Sugar. The study result supported that futures price acts as an efficient price discovery vehicle in the case of Gold, Silver, Crude oil, Castor seed, Jeera. They found that the volatility spillover exists from futures to spot market in all cases except sugar.
Pavabutr and Chaihetphon (2010) examined the price discovery process of the nascent gold futures contracts in the Multi Commodity Exchange of India (MCX) over the period 2003 to 2007. The study employed vector error correction model (VECM) to show that futures prices of both standard and mini contracts lead spot price. They found that standard and mini futures contracts exhibit a stronger influence over spot prices both in the short-run and long-run. Moreover, Srinivasan (2012) examined the price discovery process and volatility spillovers in Indian spot-futures commodity markets through Johansen cointegration, Vector Error Correction Model (VECM) and the bivariate EGARCH model. He found that the commodity spot markets of MCXCOMDEX, MCXAGRI, MCXENERGY and MCXMETAL serve as effective price discovery vehicle. Besides the volatility spillovers from spot to the futures market are dominant in case of all MCX commodity markets.
From the existing literature, it appears that even though spot and futures markets react to the same information, the major question is which market reacts first and from which market volatility spillover to other markets. The empirical research on the price
discovery role of Indian commodity futures markets is relatively sparse. Especially, the studies pertaining to price discovery role and volatility spillover in Indian gold futures market was found to be meager. The existing studies such as Praveen and Sudhakar (2006), Iyer and Pillai (2010), Shihabudheen and Padhi (2010) and Pavabutr and Chaihetphon (2010) regarding Indian gold futures market mainly focused on Multi Commodity Exchange of India Ltd (MCX). This is due to the fact that MCX accounts for over half of gold futures trading in India. The activity on MCX revolves around precious metals and crude oil. However, activity on NCDEX is largely driven by regional domestic crops. Since the past few years, the spurt in the gold prices and concerned over the falling volume in agri-commodities exhibited maturity on all parameters of gold in NCDEX viz. traded volumes, open interest and member participation. According to data on NCDEX website, the trading volume of gold has increased from Rs. 202 crore in November 2010 to Rs. 13,971 crore in January 2011. Besides, the entities perceived to be fronting for a rival exchange have drawn the market regulator’s attention to the dramatic surge in trading volumes of gold at NCDEX. With the Indian gold commodity market assuming more and more importance in recent years, the debate on price discovery and volatility spillover becomes important among financial analysts, arbitrageurs, speculators and market regulators. The present paper attempts to examine the price discovery process and volatility spillovers in gold futures and spot markets of National Commodity Derivatives Exchange (NCDEX) by employing Johansen’s Vector Error Correction Model (VECM) and the Bivariate ECM-EGARCH(1,1) model.
The remainder of the article is organised as follows: Section-3 describes the methodology and data used for empirical analysis. Section-4 offers empirical results and discussion of the study. Concluding remarks are presented in section-5.
3. Methodology
Johansen’s (1988) cointegration approach and Vector Error Correction Model (VECM) have been employed to investigate the price discovery process in spot and futures market of gold in India. Before doing cointegration analysis, it is necessary to test the stationary of the series. The Augmented Dickey-Fuller (1979) test was employed to infer the stationary of the series. If the series are non-stationary in levels and stationary in differences, then there is a chance of cointegration relationship between them which reveals the long-run relationship between the series. Johansen’s cointegration test has been employed to investigate the long-run relationship between two variables. Besides, the causal relationship between spot and futures prices investigated by estimating the following Vector Error Correction Model (VECM) (Johansen, 1988):
ΔXt = p 1 i 1
ΓiΔXt-i + ΠXt-1 + εt ; εt | t-1 ~ distr(0, Ht ) (1) where Xt is the 2x1 vector (St, Ft)´ of log-Spot price and log-Futures price, respectively,an as-yet-unspecified conditional distribution with mean zero and time-varying covariance matrix, Ht. The VECM specification contains information on both the short- and long-run adjustment to changes in Xt, via the estimated parameters Γi and Π, respectively.
There are two likelihood ratio tests that can be employed to identify the co-integration between the two series. The variables are cointegrated if and only if a single cointegrating equation exists. The first statistic λtrace tests the number of cointegrating vectors is zero or one, and the other λmax tests whether a single cointegrating equation is sufficient or if two are required. In general, if r cointegrating vector is correct. The following test statistics can be constructed as: λtrace (r) =
11 1 n i i r n T (2) λmax (r, r+1) =T n1 1
r i
(3)where i are the eigen values obtained from the estimate of the Π matrix and T is the number of usable observations. The λtrace tests the null that there are at most r cointegrating vectors, against the alternative that the number of cointegrating vectors is greater than r and the λmax tests the null that the number of cointegrating vectors is r, against the alternative of r + 1. Critical values for the λtrace and λmax statistics are provided by Osterwald-Lenum (1992).
Johansen and Juselius (1990) showed that the coefficient matrix Π contains the essential information about the relationship between St and Ft. Specifically, if rank(Π) = 0, then Π is 2x2 zero matrix implying that there is no cointegration relationship between St and Ft,t-n. In this case the VECM reduces to a VAR model in first differences. If Π has a full rank, that is rank(Π) = 2, then all variables in Xt are I(0) and the appropriate modelling strategy is to estimate a VAR model in levels. If Π has a reduced rank, that is rank(Π) = 1, then there is a single cointegrating relationship between St and Ft, which is given by any row of matrix Π and the expression ΠXt-1 is the error correction term. In this case, Π can be factored into two separate matrices α and β, both of dimensions 2x1, where 1 represents the rank of Π, such as Π = αβ´, where β´represents the vector of cointegrating parameters and α is the vector of error-correction coefficients measuring the speed of convergence to the long-run steady state.
If spot and futures prices are cointegrated then causality must exist in at least one direction (Granger, 1988). Granger causality can identify whether two variables move one after the other or contemporaneously. When they move contemporaneously, one provides no information for characterising the other. If ‘X causes Y’, then changes in X should precede changes in Y. Consider the VECM specification of Equation (1), which can be written as follows: ΔSt =p 1 i 1
aS,iΔSt-i +p 1 i 1
bS,iΔFt-i + aSzt-1 + εS,t (4) εi,t | t-1 ~ distr(0, Ht ) ΔFt =p 1 i 1
aF,iΔSt-i +p 1 i 1
bF,iΔFt-i + aFzt-1 + εF,t (5)where aS,i, bS,i, aF,i, bF,i are the short-run coefficients, zt-1 = β´Xt-1 is the error- correction term which measures how the dependent variable adjusts to the previous period’s deviation from long-run equilibrium from equation (1), and εS,t and εF,t are residuals.
In the above equations of Vector Error Correction Model, the unidirectional causality from Futures-to-Spot price (Ft Granger causes St) requires: (i) that some of the bs,i coeffi cients, i = 1, 2, …, p-1, are non zero and/or (ii) aS, the error-correction coeffi cient in Equation (4), is signifi cant at conventional levels. Similarly, unidirectional causality from Spot-to-Futures price (St Granger causes Ft ) requires: (i) that some of the aF,i coeffi cients, i = 1, 2, …, p-1, are non zero and/or (ii) aF is signifi cant at conventional levels. If both variables Granger cause each other, then it is said that there is a two-way feedback relationship between St and Ft (Granger, 1988). These hypotheses can be tested by applying Wald tests on the joint signifi cance of the lagged estimated coeffi cients of ΔSt-i and ΔFt-i. When the residuals of the error-correction equations exhibit heteroskedasticity, the
t-statistics are adjusted by White (1980) heteroskedasticity correction.
As we are interested in knowing how volatility responds to good and bad news, we apply EGARCH specifi cation popularized by Nelson (1991). Following the methodology of Koutmos and Tucker (1996) and Lin et al. (2002), we use a bivariate ECM-EGARCH(1,1) model in order to examine volatility spillovers. The model is described by the following system of equations:
1 ,, | 00 [ | ] 1 ~ [ , ] es f t t e tt t e t N H (6) tVar (es, t | t 1) Cov (es, t ef , t | t 1) hs, t hsf , t Cov (es, t ef , t | t 1) Var (ef , t | t 1) hsf , t h H f , t
i,t ei, t hi, t î ~ N 0,1 , i s,f lnhs,t = as,0 + bs,s Gs (ξs,t-1) + bs,f Gf (ξf,t-1) + γs ln(hs,t-1) (7) lnhf,t = af,0 + bf,f Gf (ξf,t-1) + bf,s Gs (ξs,t-1) + γf ln(hf,t-1) (8) Gs (ξs,t-1) = (│ξs,t-1│- E│ξs,t-1│) + λsξs,t-1 (9) Gf (ξf,t-1) = (│ξf,t-1│- E│ξf,t-1│) + λfξf,t-1 (10) hsf,t = ρhs,t hf,t (11)where es,t and ef,t are the error terms which are obtained from the VECM; hi,t = σ2
i,t = Var(ei,t| t-1) is the conditional variance and t-1 is the information set available time t-1; ξi,t = ei,t /σi,t
is the standardized innovation; hsf,t is the conditional covariance and ρ represents conditional correlation which is assumed to be constant as this assumption simplifies the estimation.
According to Tse (1999), the estimation of the model can be achieved by a two-step approach. First, we apply the VECM and then we save its residuals for use in the bivariate EGARCH(1,1) model. Because, the least squares estimator used in VECM is still consistent and unbiased even though the errors do not have a constant variance (heteroscedasticity), this approach is asymptotically equivalent to a joint estimation of the VECM and EGARCH models.
The log-likelihood for our model, assuming that the conditional joint distribution of Rs,t and Rf,tis normal, is:
L(θ) = –T log (2П) – 1/2
Tt1(log(│Ht(θ)│) + et(θ)´H-1t (θ) et(θ)) (12)
where T is the number of observations; et = (es,t ef,t ) is the 1x2 vector of innovations at time t, and θis the parameter vector to be estimated. The log-likelihood function is highly nonlinear in θ and the algorithm of Berndt et al. (1974) is used in order to maximize
L(θ). In addition, the test of significance of the parameters is computed with the robust standard errors of Bollerslev and Wooldrigde (1992). The LB test statistics are computed on standardized residuals and standardized squared residuals of every market to check in there is any linear or nonlinear dependence in residuals.
The conditional variance in spot (7) and futures (8) is an exponential function of past own and cross-market standardized innovations. The coefficients bs,f and bf,s indicate the volatility spillover from futures to spot and from spot to futures, respectively. The coefficients bs,s and bf,f represent the volatility clustering or else volatility pooling, which is the tendency for volatility in financial markets to appear in bunches. The coefficients γs
and γf measure the degree of volatility persistence. The Gi(•) is an asymmetric function of past standardized innovations given in (9) and (10), which influence the conditional variances asymmetrically. │ξi,t-1│- E│ξi,t-1│ measures the magnitude effect, and the term
λiξi,t-1 measures the sign effect.
Depending on the sign of coefficients bi,t, λi and in terms of cross-market volatility spillovers, a negative innovation , (ξit < 0) will be followed by higher volatility than a positive innovation, (ξit > 0) if, bi,t > 0 and –1< λi <0. Thus, when λi < –1, a positive surprise will decrease volatility. Obviously, when λi =0 the asymmetry disappears. Lin et al. (2002) state that if, ξit < 0, then the coefficients of ξit in (9) and (10) will be –1+ λi. If ξit > 0, then the coefficients of ξit will be 1+ λi. Therefore, if λi is significant, the asymmetric effect of standardized innovations to the conditional variances is observed.
The data for the study consists of daily closing price of gold futures and its corresponding underlying spot market price. Since the past few years, the spurt in the gold prices and concerned over the falling volume in agri-commodities exhibited maturity on all parameters of gold in NCDEX viz. traded volumes, open interest and member participation. Besides, the entities perceived to be fronting for a rival exchange have drawn the market regulator’s attention to the dramatic surge in trading volumes of gold at NCDEX in recent years. Moreover, the volatility of spot and futures markets is subject towards stochastic or time-varying in nature. Therefore, it has become necessary from time to time to conduct
empirical studies to investigate the price discovery role of spot and futures markets of gold in developing commodity markets like India. For these reasons, the present employed recent past years daily dataset on spot and futures market of gold traded at NCDEX. The data span for the study has been considered from 23, April 2009 to 31, May 2011. All the required data information for the study has been retrieved from the website of National Commodity Derivatives Exchange (NCDEX), Mumbai. Throughout this paper, spot and futures market returns are defined as continuously compounded or log returns (hereafter returns) at time t, Rt, calculated as follows:
Rt = log (Pt / Pt-1) = log Pt – log Pt-1 (13) where Pt and Pt-1 are the daily closing prices of the gold futures contract and its corresponding underlying spot market at days, t and t−1, respectively.
Descriptive statistics are reported in Table 1. The sample means of spot and futures market returns are positive and the standard deviation ranges from 0.0081 (spot) to 0.0085 (futures). The values of skewness and excess kurtosis indicate that the distributions of spot and futures market returns are negatively skewed and leptokurtic relative to the normal distribution. The Jarque-Bera test statistic rejects normality at one per cent level of statistical significance in both cases. The Ljung-Box statistic for 16 lags applied on returns (denoted by LB(16)) and squared returns (denoted by LB2(16)) indicate that significant
linear and nonlinear dependencies exist. Linear dependencies may be due to some form of market inefficiency (Koutmos and Booth, 1995).
Table 1: Descriptive Statistics of Return Series
Statistics Spot Futures
Mean 0.000768 0.000761 Standard Deviation 0.00815 0.00858 Skewness -0.0818 -0.2772 Kurtosis 4.5131 5.5050 LB(16) 17.61* 11.69* LB2(16) 46.96* 22.32* JB 46.13* 131.10* ARCH-LM(12) 11.65* 4.16**
Notes: LB(16) and LB2(16) are the Ljung-Box statistics applied on returns and squared returns,
respectively. JB is the Jarque-Bera statistic to test for normality. ARCH-LM(12) is a Lagrange multiplier test for ARCH effects up to order 12 in the residuals (Engle, 1982). * and ** -denote the significance at the one and five per cent level, respectively.
Furthermore, the Engle (1982) ARCH-LM test statistics was conducted in order to test the null hypothesis of no ARCH effects. The test statistics are statistically significant at one per cent level, implying that there exist significant ARCH effects on the data at
all frequencies. Nonlinear dependencies can satisfactorily be captured by autoregressive conditional heteroscedasticity (ARCH) models.
4. Empirical Results and Discussions 4.1 Price Discovery Process
Augmented Dickey-Fuller test was employed to test the stationarity of the spot and futures price series of gold market and the results are presented in Table 2. The results reveal that both the price series of gold market are found to be stationary at the first order level, and they are integrated in the order of I(1), respectively. This finding is in line with many studies on time series properties of price series.
Table 2: Augmented Dickey-Fuller Test Results
Variables Intercept Intercept & trend I. Levels
S 0.866 -2.983
F -0.802 -2.715
II. First Difference
∆S -10.11* -10.10*
∆F -11.88* -11.86*
Notes: * – indicates significance at one per cent level. Optimal lag length is determined by the Schwarz Information Criterion (SIC), F and S are the Futures and Spot market prices, respectively
Given that spot and futures prices are integrated of the same order, (1), co-integration techniques may be used to determine the existence of a stable long-run relationship between the prices. The results of Johansen’s cointegration test are reported in Table 3.
Table 3: Johansen’s Cointegration Test Results
Null Hypothesis (H0) Alternative Hypothesis (H1)
Eigen Value Likelihood
Ratio Tests Critical 95 % Value 99 % Critical Value Trace test Statistics r = 0 r ≥ 1 0.044991 22.34958* 15.41 20.04 r ≤1 r ≥ 2 0.000918 0.437188 3.76 6.65 Maximal Eigen value r = 0 r = 1 0.044991 21.91239* 14.07 18.63 r = 1 r = 2 0.000918 0.437188 3.76 6.65
Notes: r is the number of cointegrating vectors under the null hypothesis. * - denote the significance at one per cent level.
Maximum Eigen value and Trace test statistics indicate the presence of one cointegrating vector between the spot and futures market prices at the five per cent level. This shows that spot and futures prices of gold market are co-integrated and there exists atmost one co-integrating relationship between spot and futures prices. In other words, spot and futures prices share common long-run information. Overall, Johansen’s test results support that the spot and futures prices of gold market lead in the long run.
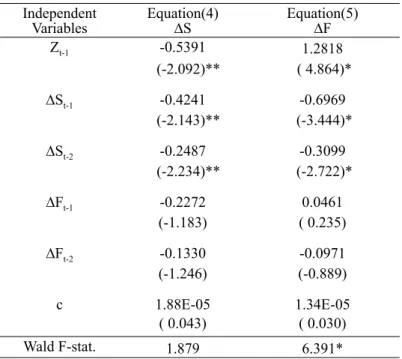
According to Granger representation theorem, if two variables X and Y are co-integrated, then the relationship between the two can be expressed as ECM (Gujarati, 2005). Therefore, the Vector Error Correction Model (VECM) was employed to examine the price discovery process in spot and futures markets of gold. The VECM estimates obtained from equations (4) and (5) are presented in Table 4. The coefficients (as and af) of the error correction term provide some insight into the adjustment process of spot and futures prices towards equilibrium in all types of contracts. That is, the error correction term represents a mean-reverting price process. The table result shows that coefficient of the error correction term (as) in the spot equation (4) is statistically significant and negative, implying that the futures price makes the greater adjustment in order to reestablish the equilibrium. In the futures equation (5), the coefficients of lagged spot prices are statistically significant at one per cent level. Besides, the Wald-F statistics for the futures equation,
ki1bs(Wald-F),Table 4: Result of Vector Error Correction Estimates Independent
Variables Equation(4)∆S Equation(5)∆F
Zt-1 -0.5391 1.2818 (-2.092)** ( 4.864)* ∆St-1 -0.4241 -0.6969 (-2.143)** (-3.444)* ∆St-2 -0.2487 -0.3099 (-2.234)** (-2.722)* ∆Ft-1 -0.2272 0.0461 (-1.183) ( 0.235) ∆Ft-2 -0.1330 -0.0971 (-1.246) (-0.889) c 1.88E-05 1.34E-05 ( 0.043) ( 0.030) Wald F-stat. 1.879 6.391*
Notes: Optimal lag length is determined by the Schwarz Information Criterion (SIC), Ft and St are the Futures and Spot market prices respectively, * and ** denote the significance at the one and five per cent level, respectively. Parenthesis shows t-statistics.
is found to be statistically significant at one per cent level, suggesting that there was a significant causality running from spot to futures prices.
Overall, the VECM result confirms the unidirectional relationship runs from the spot market to futures market of Gold in India. In other words, spot price leads the futures price. This implies that the spot market of Gold plays a dominant role and serves as effective price discovery vehicle. This confirms that the spillovers of certain information take place from spot market to futures market and the spot market of gold have the capability to expose the all new information through the channel of its new innovation.
4.2 Volatility Spillover
Following the methodology of Koutmos and Tucker (1996) and Lin et al. (2002), the Bivariate ECM-EGARCH(1,1) model was employed to investigate, how news from one market affects the volatility behaviour of another market. The results of the Bivariate ECM-EGARCH(1,1) model are presented in Table 5. The coefficients bs,fand bf,s, shows that
Table 5: Result of Bivariate ECM-EGARCH (1,1) model Parameters Spot
Return Futures Return
αi -0.3574 4.0488 (-0.219) (1.212) bi,s 0.5481 0.6127 (3.704)* (2.712)* bi,f 2.4813 0.1961 (6.932)* (3.399)** λi 0.5096 0.7566 (4.151)* (11.52)* γi 0.7391 0.1961 (5.448)* (3.399)** ρ 0.8349*
Diagnostics on standardized and squared standardized residuals LB(16) 9.3384 5.8065 LB2(16) 15.495 7.2816
ARCH-LM(12) 2.0827 1.0415
Notes: * and ** denote the significance at the one and five per cent level, respectively. Parenthesis shows z-statistics. LB(16) and LB2(16) are the Ljung-Box statistics applied on returns and squared
returns, respectively. ARCH-LM(12) is a Lagrange multiplier test for ARCH effects up to order 12 in the residuals (Engle, 1982).
significant spillovers exist across the spot and futures markets. However, the absolute value of bs,f (2.4813) is greater than bf,s (0.6127), implying that the spillovers from spot to futures are more significant than the reverse direction, which means that the information flow from spot to futures is stronger. Furthermore, the coefficients γs (0.7391) and γf (0.1961), which represent the degree of volatility persistence, are both highly significant. This indicates the high persistence of shocks to volatility. The contemporaneous relationship measured by the conditional correlation ρis 0.8349. Lin et al. (2002) point out that, if the capital market is efficient enough or the cost-of-carry model holds the value of the conditional correlation should be close to unity.
Finally, the estimated Ljung-Box statistics for the standardized and squared standardized residuals indicate that the Bivariate ECM-EGARCH(1,1) model is correctly specified. Besides, the ARCH-LM tests indicate that no serial dependence persists left in squared residuals. Hence, the results suggest that the Bivariate ECM-EGARCH(1,1) model was reasonably well specified and most appropriate model to capture the ARCH (time-varying volatility) effects in the time series analysed.
5. Conclusion
The primary objective of Indian commodity market is to build value for the traders by providing a mechanism to protect their business from adverse price change. Traders or exporters can hedge their price risk and improve their competitiveness by making use of futures market through price discovery mechanism. Price discovery is the process by which markets attempt to reach equilibrium price. Price discovery is a major function of commodity futures market. The essence of the price discovery function hinges on whether new information is refl ected fi rst in changes of future prices or changes of spot prices. The present study assumes signifi cance in the sense that it enables to determine which market is more effi cient in processing and refl ecting of new information. Besides, the study of volatility interdependence provides useful insights into how information is transmitted and disseminated between futures and spot market. In arbitrage free economy, volatility of prices is directly related to the fl ow of information. If futures market increase the fl ow of information, volatility in the underlying spot market will rise. This study attempts to examine the price discovery process and volatility spillovers in Gold futures and spot markets of National Commodity Derivatives Exchange (NCDEX) by employing Johansen’s Vector Error Correction Model (VECM) and the Bivariate ECM-EGARCH(1,1) model. The empirical result confi rms that the spot market of Gold plays a dominant role and serves as effective price discovery vehicle. Besides the study results show that the spillovers of certain information take place from spot market to futures market and the spot market of gold have the capability to expose the all new information through the channel of its new innovation. Moreover, the study validates that the gold futures market of NCDEX found very intricate to incorporate the information in its prices. This clearly reveals that the futures market of gold is not yet matured and effi cient when information gets disseminated.
market. The study results have practical implications for investors and market participants who wish to hedge their risk against the adverse price movements. Investors may use the spot market price, which tends to discover new information more rapidly than futures prices, to adopt more effective hedging strategies. Moreover, a better understanding of the interdependence of these markets would be useful for those policy makers who coordinate the stability of financial markets.
Acknowledgement
The authors are thankful to the anonymous referees, who gave valuable comments and suggestions on the earlier draft of the paper. Any remaining errors or omissions are our own.
References
Azizan, N. A., Ahmad N. and Shannon, S., 2007, ‘Is the Volatility Information Transmission Process between the Crude Palm Oil Futures Market and Its Underlying Instrument Asymmetric?’, International Review of Business Research Papers, 3, pp. 54-77.
Bollerslev, T. and Wooldridge, J. M., 1992, ‘Quasi-Maximum Likelihood Estimation and Inference in Dynamic Models with Time Varying Covariances’, Econometric Reviews, 11, pp. 143-172.
Brockman, P. and Tse, Y., 1995, ‘Information shares in Canadian agricultural cash and futures Markets’, Applied Economics Letters, 2, pp. 335-338.
Dickey, D. A. and Fuller, W. A., 1979, ‘Distribution of the Estimations for Autoregressive Time Series with a Unit Root’, Journal of the American Statistical Association, 47, pp. 427-431.
Engle, R. F., 1982, ‘Autoregressive conditional heteroscedasticity with estimates of the variance of United Kingdom inflation’, Econometrica, 50, pp. 987-1008.
Fortenberry, T. R. and Zapata, H. O., 1997, ‘An evaluation of price linkages between futures and cash markets for cheddar cheese’, The Journal of Futures Markets, 17, pp. 279-301. Gardbade, K. D. and Silber, W. L., 1983, ‘Price movements and price discovery in futures
and cash markets’, Review of Economics and Statistics, 65, pp. 289-297.
Ge, Y., Wang, H. H. and Ahn, S. K., 2008, ‘Implication of Cotton Price Behaviour on Market Integration’, Proceedings of the NCCC-134 Conference on Applied Commodity Price Analysis, Forecasting and Market Risk Management, St. Louis.
Granger, C. W. J., 1988, ‘Some Recent Developments in a Concept of Causality’, Journal
of Econometrics, 39, pp. 213-28.
Gujarati, D. N., 2005, ‘Essentials of Econometrics’, Third edition, McGraw-Hill, New York.
Hasbrouck, J., 1995, ‘One security, many markets: determining the contributions to price discovery’, The Journal of Finance, 50, pp. 1175-1199.
Iyer, V. and Pillai, A., 2010, ‘Price discovery and convergence in the Indian commodities market’, Indian Growth and Development Review, 3, pp. 53-61.
Johansen, S., 1988, ‘Statistical Analysis and Cointegrating Vectors’, Journal of Economic
Dynamics and Control, 12, 2-3, pp. 231−254.
Johansen, S. and Juselius, K., 1990, ‘Maximum Likelihood Estimation and Inference on Cointegration with Applications to the Demand for Money’, Oxford Bulletin of
Economics and Statistics, 52, pp. 169-210.
Karande K., 2006, ‘A Study of Castorseed Futures Market in India’, Doctoral Thesis, Indira Gandhi Institute of Development Research Mumbai, India.
Karolyi G. A., 1995, ‘A multivariate GARCH model of international transmissions of stock returns and volatility: The case of United States and Canada’, American Statistical
Association, 13, pp. 11-25.
Koutmos, G. and Booth, G. G., 1995, ‘Asymmetric Volatility Transmission in International Stock Markets’, Journal of International Money and Finance, 14, 5, pp. 747-762. Koutmos, G. and Tucker, M., 1996, ‘Temporal Relationship and Dynamic Interactions
between Spot and Futures Stock Market’, The Journal of Futures Markets, 16, pp. 55-69. Kumar, S. and Sunil, B., 2004, ‘Price discovery and market efficiency: evidence from
agricultural future commodities’, South Asian Journal of Management, 11, pp. 34-49. Lin, C. C., Chen, S. Y., Hwang, D. Y. and Lin, C. F., 2002, ‘Does Index Futures Dominate
Index Spot? Evidence from Taiwan Market’, Review of Pacific Basin Financial Markets
and Policies, 5, pp. 255-275.
Mattos, F. and Garcia, P., 2004, ‘Price Discovery in Thinly Traded Markets: Cash and Futures Relationship in Brazilian Agricultural Futures Market’, Proceedings of the NCR -134 Conference on Applied Commodity Price Analysis, Forecasting and Risk Management, available at http://www.farmdoc.uiuc.edu/nccc134.
Moosa., I. A. 2002, ‘Price Discovery and Risk Transfer in the Crude Oil Futures. Market:
Some Structural Time Series Evidence’, Economic Notes, 31, pp. 155-165.
Nelson, D. B., 1991, ‘Conditional heteroskedasticity in asset returns: A new approach’,
Econometrica, 59, 2, pp. 347-370.
Oellermann, C. M., Brorsen, B. W. and Farris, P. L., 1989, ‘Price discovery for feeder cattle’, The Journal of Futures Markets, 9, pp. 113-121.
Osterwald-Lenum, M., 1992 ‘A Note with the Quantiles of the Asymptotic Distribution of the Maximum Likelihood Cointegration Rank Test Statistics,’ Oxford Bulletin of
Economics and Statistics, 54, pp. 461-472.
Pavabutr, P. and Chaihetphon, P., 2010, ‘Price discovery in the Indian gold futures market’,
Journal of Economics and Finance, 34, pp. 455-467,
Praveen, D. G. and Sudhakar, A., 2006, ‘Price Discovery and Causality in the Indian Derivatives Market’, ICFAI Journal of Derivatives Markets, 3, pp. 22-29.
Roy, A. and Kumar, B., 2007, ‘A Comprehensive Assessment of Wheat Futures Market: Myths and Reality’, Paper presented at International Conference on Agri-business and Food Industry in Developing Countries: Opportunities and Challenges, held at IIM, Lucknow.
Roy, A., 2008, ‘Dynamics of Spot and Future Markets in Indian Wheat Market: Issues and Implications’ Working paper, Indian Institute of Management, Ahmedabad
Schroeder, T. C. and Goodwin, B. K., 1991, ‘Price discovery and cointegration for live hogs’, The Journal of Futures Markets, 11, pp. 685-696.
Shihabudheen, M. T. and Padhi, P., 2010, ‘Price Discovery and Volatility Spillover Effect in Indian Commodity Market’, Indian Journal of Agricultural Economics, 65, 46-59. Srinivasan, P., 2012, ‘Price Discovery and Volatility Spillovers in Indian Spot - Futures
Commodity Market’, The IUP Journal of Behavioral Finance, 9, pp. 70-85.
Theodossiou, P. and Lee, U., 1993, ‘Mean and Volatility Spillovers Across Major National Stock Markets: Further Empirical Evidence’, Journal of Financial Research, 16, pp. 337-350.
Thomas, S. and Karande, K., 2001, ‘Price discovery across multiple markets’, Technical report, IGIDR, Bombay, India.
Tse, Y., 1999, ‘Price Discovery and Volatility Spillovers in the DJIA Index and Futures Markets’, The Journal of Futures Markets, 19, pp. 911-930.
Tse and Xiang J. Y., 2005, ‘Market quality and price discovery: Introduction of the E-mini energy futures’, Global Finance Journal,16, pp. 164-179.
White, H., 1980 ‘A Heteroskedasticity-Consistent Covariance Matrix Estimator and a Direct Test for Heteroskedasticity’, Econometrica, 48, pp. 817-838.
Yang, J., Bessler, D. A. and Leatham, D. J., 2001, ‘Asset storability and price discovery in commodity futures markets: a new look’, The Journal of Futures Markets, 21, pp. 279-300.
Zapata H., Fortenbery T. R. and Armstrong D., 2005, ‘Price Discovery in the World Sugar Futures and Cash Markets: Implications for the Dominican Republic’, Staff Paper No. 469, Department of Agricultural & Applied Economics, University of Wisconsin-Madison.