1
Outlier Detection using Boxplot-Mean Algorithm
Rajesh Boghey Deeksha Agrawal*
Head, Department of CSE, Technocrats Institute of Technology ( TIT Excellence) , Bhopal Research scholar , Department of CSE, Technocrats Institute of Technology ( TIT Excellence) , Bhopal
Abstract
In this paper, we present a novel method for the detection of outlier in intrusion detection system. The proposed detection algorithm, are called hybrid algorithm. It is combination of two algorithm k-mean and boxplot. Experimental results demonstrate to be superior to existing SCF algorithm. One of the most common problems in existing SCF technique detection techniques is that such as ignoring dependency among categorical variables, handling data streams and mixed data sets. Moreover, identifying number of outliers in advance is an impractical issue in the SCF algorithm and other outlier identification techniques. This paper investigates the performances of boxplot-mean method for detecting different types of abnormal data.
Keywords: Outlier detection techniques, clustering, scf, genetic and boxplotmean technique.
1. INTRODUCTION
Generally, Intrusion detection system (IDS) has three component that is detection component, investigating component, and post-mortem component. The detection component identifies security breaches. The investigation component determines exactly what happened based on data from the detection component. This component may also include the gathering of further data in order to identify the security violator. Finally, the post-mortem component analyzes how to prevent similar intrusions in the future. With the emergence and the proven utility of the intrusion detection concept, the detection component is beginning to receive more attention. There are many approaches to find intrusions under detection component. Since volume of data dealing with network is so large, this collection concentrates heavily on the use of data mining in the area of intrusion detection. Boxplot-mean is one of the effective techniques under data mining that can be used for intrusion detection.
The number of hacking and intrusions incidents is increasing year on year as technology rolls out. Maintaining a high level security to ensure safe and trusted communication of information between various organizations becomes a major issue. So Intrusion detection system (IDS) has become a needful component in terms of computer and network security [5]. An Intrusion Detection system (IDS) is a device or a software product that analyzes the coming traffic on network for a malicious activities (or intrusion) and raises an alarm when intrusion detected. The aim of IDS is to detect illegal and improper use of system resources by unauthorized users by monitoring network traffic and audit data. An intrusion can be defined as any set of actions that attempt to compromise the integrity, confidentiality or availability of resources on system [6].
Outlier detection refers to detecting patterns in a given data set that do not conform to an established normal behavior. The patterns thus detected are called anomalies and translate to critical and actionable information in several application domains. Anomalies are also referred to as outlier, surprise deviation etc [4].
Most outlier detection algorithms require a set of purely normal data to train the model and they implicitly assume that anomalies can be treated as patterns not observed before. Since an outlier may be defined as a data point which is very different from the rest of the data, based on some measure, we employ several detection schemes in order to see how efficiently these schemes may deal with the problem of anomaly detection. The statistics community has studied the concept of anomaly quite extensively [3]. In these techniques, the data points are modeled using a stochastic distribution and points are determined to be outliers depending upon their relationship with this model. However with increasing dimensionality, it becomes increasingly difficult and inaccurate to estimate the multidimensional distributions of the data points.
2. RELATED WORK
A. Supervised Approaches
In this approach, a predictive model is developed based on a training dataset (i.e., data instances labeled as normal or attack class). Any unseen data instance is compared against the model to determine which class it belongs to. There are two major issues that arise in supervised outlier detection. First, the anomalous instances are far fewer in number compared to normal instances in the training data. Issues that arise due to imbalanced class distributions have been addressed in the data mining and machine learning literature [8]. Second, obtaining accurate and representative labels, especially for the anomaly class is usually challenging. A number of techniques have been proposed that inject artificial anomalies in a normal dataset to obtain a labeled training dataset [9]. Other than these two issues, the supervised anomaly detection problem is similar to building predictive models. We now discuss some of the most common incremental supervised outlier detection approaches.
2
from program behavior. A new program behavior is inserted into old profiles by density-based incremental clustering when system usage pattern changes. It is much more efficient compared to traditional updating by re-clustering. The authors test their model using the 1998 DARPA BSM audit data, and report that the normal profiles generated by their algorithm are less sensitive to noise data objects than profiles generated by the ADWICE algorithm. The method improves the quality of clusters and lowers the false alarm rate.
B. Semi-supervised Approaches
In semi-supervised approach, the training data instances belong to the normal class only. Data instances are not labeled for the attack class. There are many approaches used to build the model for the class corresponding to normal behavior. Fuzzy rough semi-supervised outlier detection (FRSSOD) approach with the help of some labeled samples and fuzzy rough C-means clustering. This method introduces an objective function, which minimizes the sum squared error of clustering results and the deviation from known labeled examples as well as the number of outliers. Each cluster is represented by a center, a crisp lower approximation and a fuzzy boundary by using fuzzy rough C-means clustering and only those points located in boundary can be further discussed the possibility to be reassigned as outliers. As a result, this method can obtain better clustering results for normal points and better accuracy for outlier detection.
C. Unsupervised Approaches
Unsupervised detection approaches do not require training data, and thus are most widely applicable. These techniques make the implicit assumption that normal instances are far more frequent than anomalies in the test data. If this assumption is not true, such techniques suffer from high false alarm. Most existing unsupervised anomaly detection approaches are clustering based. Clustering is a technique to group similar objects. It deals with finding structure in a collection of unlabeled data. Representing the data by fewer clusters necessarily leads to the loss of certain finer details, but achieves simplification. In anomaly detection, clustering plays a vital role in analyzing the data by identifying various groups as either belonging to normal or to anomalous categories. There are many different clustering based anomaly detection approaches in the literature. A fast outlier identification method for categorical data sets named SCF (Squares of the Complement of the Frequency). The proposed method aims at finding outliers, observations with small marginal frequencies. For each observation, it calculates frequency score named SCF (xi): [1] SCF uses the sum of squares of the complement of the marginal frequency instead sum of the marginal frequency to emphasize the difference between frequent and infrequent categories. In contrast to other outlier identification methods in categorical data sets, it considers number of categories in the categorical variables. Frequent Item set Mining (FIM) has received considerable attention since the seminal paper on the related subject of Association Rule Mining by Agrawal and Srikant [7]. Given a dataset D and a set of r literals, S = {i1,i2,…,ir} that are found in D, we can define an item set I as a non-empty subset of S.
3. PROBLEM FINDING
The current technique with the IDs is either host based or associated with the firewall, they have a low detection rate and accuracy. Also in terms of their parameters such as Recall and precision are not matching with the standard required in order to detection attack as a outlier and perform into the real-time entity. A common challenge in such scenarios is to perform the outlier detection in real time, as new data values are encountered. Many scenarios of change analysis and anomaly detection in temporal data are too tightly integrated to be treated separately. In such cases, solutions for one can be used for the other, and vice-versa. On the other hand, the formulations of anomaly detection in temporal data are very diverse, not all of which are directly related to change detection. Usually online analysis is suited to change detection, whereas offline analysis may explore other unusual aspects of the data. There are some limitations in the proposed method that we are aiming to handle them in the future such as ignoring dependency among categorical variables, handling data streams and mixed data sets. Moreover, identifying number of outliers in advance is an impractical issue in the SCF algorithm and other outlier’s identification techniques.
4. PROPOSED SOLUTION AND ALGORITHM
Boxplot-Mean algorithm is combination of k-mean cluster algorithm and boxplot algorithm. The number of clusters K is specified by user means classifies instances into predefined number of cluster. The first step of boxplot-Means clustering is to choose numbers of instances as a center of clusters. Next assign each instances of dataset to nearest cluster. For instance assignment, measure the distance between centroid and each instances using Euclidean distance and according to minimum distance assign each and every data points into cluster. boxplot – Means algorithm takes less execution time, when it applied on small dataset. When the data point increases to maximum then it takes maximum execution time. It is fast iterative algorithm but it is sensitive to outlier and noise.
Firstly boxplot algorithms chooses the dataset and apply cluster technique to divide the cluster in all instances. Then calculate variance to each cluster through variance formula. Then we get number of score. We
3
calculate interquartile range through IQR formula in these scores. Outlier is those values which are less than lower limit value and greater than in upper limit value in the dataset scores.
Begin;
1. Perform boxplot-mean cluster on dataset D. 2. Sort the cluster base on size.
For cluster define algorithm:
Given a set of input pattern X=x1,x2,…..xn clustering attempt to seek a K –partition of X, C=c1,c2,……….ck (k ( N)
a) Ci ≠ 0, i=1,2,3…..k; a cluster can not be empty.
b) , the clustering process should cluster all the data points.
c) Ci ∩Cj ≠ 0, i,j=1,2,……k and i ≠j, each data object should belong to exclusive one cluster.
d) d(xi,xj) in ci is minimized, distance between points inside a cluster, the intra cluster distance is minimized. e) d(ci,cj)is maximized, distance between clusters, the inter-cluster distance is minimized.
3. For each cluster i=1:n
4. Calculate the variances (Var) of produced clusters. Variance = 1/n ∑ni=1(xi-µ)2
Where, xi is an instances and µ=1/n ∑ni=1 (xi), which is the mean of all instances. Apply box plot algorithm so, firstly, arrange all variance value in ascending order.
5. Calculate inter-quartile range (IQR=Q1-Q3).
6. Calculate Lower limit= Q1-1.5*IQR and Higher limit = Q3+1.5*IQR.
7. Outlier is those values which are less than lower limit value and greater than in upper limit value in the dataset scores.
End
5. RESULT ANALYSIS
All the experiments were performed using an i3-2410M CPU @ 2.30 GHz processor and 4 GB of RAM running windows 7. Discussed boxplot-meanalgorithms were implemented using java language in NETBEANS tool. For generation of bar chart, weka (Waikato Environment for Knowledge Analysis) data mining tool was used. Proposed as well as existing SCF algorithms were applied one by one in both the proposed framework. At last, comparative study was prepared for both frameworks.
5.1 Accuracy
The accuracy is the proportion of true results (both true positive and true negetive) among the total number of cases examined.
= +
+ + +
Where,
TP (True Positive) = Number of anomalous methods
FP (False Positive) = Number of normal methods that are mistaken for the anomalous. 5.2 Detection Rate
Detection rate refers to the percentage of detected attack among all attack data, and is defined as follows: = ∗ 100
+ Where,
TP (True Positive) = Number of anomalous methods
FP (False Positive) = Number of normal methods that are mistaken for the anomalous. 5.3 Precession
Precision can be defined as the exactness of the approach and it can be calculated as:- =
+ Where,
TP (True Positive) = Number of anomalous methods
FP (False Positive) = Number of normal methods that are mistaken for the anomalous. 5.4 Recall
The measure of the completeness of the approach is called Recall. Recall can be calculated using given below formula:-
4 =
+ Where,
TP (True Positive) = Number of anomalous methods
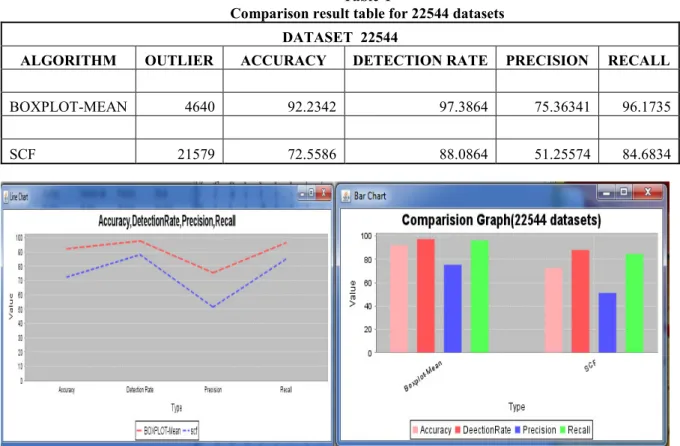
FN (False Negative) = Number of anomalous methods that are mistaken for the normal. Table-1
Comparison result table for 22544 datasets DATASET 22544
ALGORITHM OUTLIER ACCURACY DETECTION RATE PRECISION RECALL
BOXPLOT-MEAN 4640 92.2342 97.3864 75.36341 96.1735
SCF 21579 72.5586 88.0864 51.25574 84.6834
Figure no. 1: LINE CHART and BAR CHART for 22544 datasets Table-2
Comparison result table for 15561 datasets DATASET 15561
ALGORITHM OUTLIER ACCURACY DETECTION RATE PRECISION RECALL
BOXPLOT-MEAN 3762 94.4682 88.1333 69.37863 84.0807
5
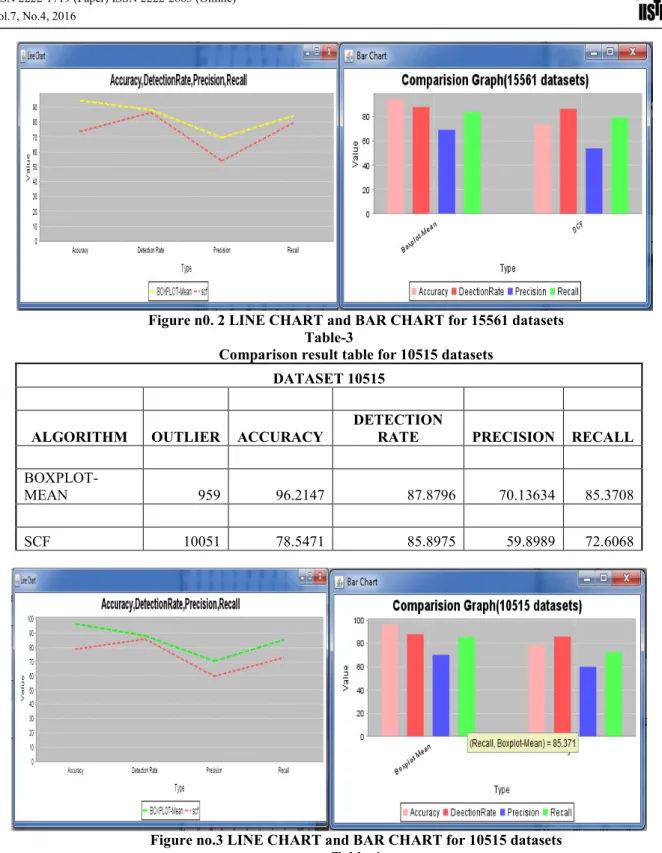
Figure n0. 2 LINE CHART and BAR CHART for 15561 datasets Table-3
Comparison result table for 10515 datasets DATASET 10515
ALGORITHM OUTLIER ACCURACY
DETECTION
RATE PRECISION RECALL
BOXPLOT-MEAN 959 96.2147 87.8796 70.13634 85.3708
SCF 10051 78.5471 85.8975 59.8989 72.6068
Figure no.3 LINE CHART and BAR CHART for 10515 datasets Table-4
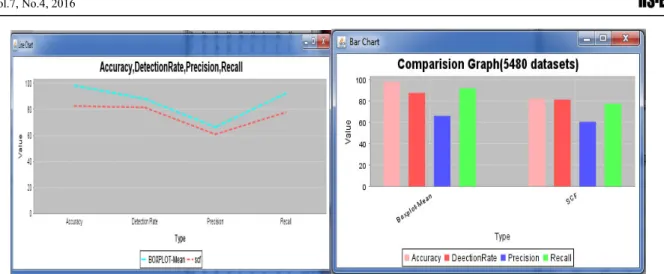
Comparison result table for 5480 datasets DATASET 5480
ALGORITHM OUTLIER ACCURACY DETECTION RATE PRECISION RECALL
BOXPLOT-MEAN 654 98.2834 87.8764 66.3634 92.1408
6
Figure no. 4 LINE CHART and BAR CHART for 5480 datasets
Here, we analyze that our algorithm is better than existing once. Because detection rate, precision and recall result is better than existing algorithm.
6. CONCLUSION
We have detect outlier through box plot mean algorithm and observed results, by considering all features in dataset for outlier detection. We have analyzed the result from box plot-mean algorithms that select relevant features for the proposed frameworks. A subset of KDD Cup’99 dataset was used for evaluating the performance of system. Also based on our observation we can notify that the our approach defined by us is an effective approach in order to retrieve outlier which was performs on the dataset. In future, we can replace decision tree classification model with some other model and compare its classification accuracy with the proposed framework.
REFERENCES
1) Ayman Taha and Osman M. Hegazy, “A Proposed Outliers Identification Algorithm for Categorical Data Sets”, 2014 IEEE.
2) Ayman Taha and Ali S. Hadi, “A General Approach for Automating Outliers, Identification in Categorical Data”, 978-1-4799-0792-2/13/$31.00 ©2013 IEEE.
3) He, Z., Deng, S., Xu, X., “An Optimization Model for Outlier Detection in Categorical Data”, Proc. of 2005 International Conference on Intelligent Computing (ICIC’05), pp.400-409, 2005.
4) Deepthy K Denatious & Anita John, “Survey on Data Mining Techniques to Enhance Intrusion Detection”, International Conference on Computer Communication and Informatics (ICCCI -2012), Jan. 10 – 12, 2012, Coimbatore, INDIA.
5) D. Hawkins (1980). Identification of Outliers. London: Chapmann and Hall.
6) V. Barnett and T. Lewis (1994). Outliers in Statistical Data. New York: John Wiley Sons.
7) P. L. Brockett, X. Xia, and R. A. Derrig (1998). Using Kohonen’s self-organizing feature map to uncover automobile bodily injury claims fraud. Journal of Risk and Insurance, vol. 65, no. 2 (June), pp. 245–274. 8) M. V. Joshi, I. T. J. Watson, and R. C. Agarwal, “Mining needles in a haystack: Classifying rare classes via two-phase rule induction,” SIGMOD Record (ACM Special Interest Group on Management of Data), Vol. 30, No. 2, pp. 91-102, 2001.
9) J. Theiler and D. M. Cai, “Resampling approach for anomaly detection in multispectral images,” in Proc. SPIE, pp. 230–240, 2003.