Patent
Analytics
Erostrud dionsed mincil
iriuscilit aliquisl.
Showing you which
patents really matter
Network Patent Analytics
Network Patent Analytics is a
unique and powerful method
for showing technology and
IP ownership landscapes
in an industry using patent
data. Griffith Hack is the
exclusive Australian licensee
of Network Patent Analytics
method developed by
Optimice. We believe this
is the world’s most
advanced method for Patent
Analytics. This brochure
will explain how Network
Patent Analytics works,
and how it can be applied
to your business, research
organisation or investment
decision.
Why Patent Analytics?
Patent Analytics is the art and process of using the world’s patent literature to inform and guide business and innovation decisions at strategic level. The world’s patent literature contains over 72 million published patents, and 1.7 million new patents are published every year. Patent data is one of the most valuable and reliable sources of information on innovation and technology. Patents are filed by a wide range of parties ranging from large companies to research organizations, small companies and individuals. Public domain and commercial databases are available to aggregate and search this data, and many databases provide English language summaries of non-English patent applications.
Over six million patents are in force and can affect freedom to operate for many innovators, especially for products or services sold in major overseas markets.
Patent literature can provide legally robust information on the ownership of key technology areas, and associated data can be used to determine how important individual patents are within these areas. This information is of value to the owners of these patents, their competitors, and for parties wishing to operate in a given technology area.
What data is available in
patent publications and patent
databases?
A patent publication is a description of a claimed invention. In addition, patent applications contain other useful information such as the patent owner, the inventors, the type of technology, and the date of invention.
Many granted patents and some patent applications also contain information on ‘patent citations’, which are previously published patents that are thought by either the patent applicant or patent examiners to disclose relevant aspects of the claimed invention. A subject patent will reference previously published patents, known as ‘reverse’ or ‘backward citations’. In addition, subject patents will be referenced by subsequently published patents, known as ‘forward citations’, Figure 1. Many patent databases contain information on patent families, which are groups of related patent applications for the same or a similar invention.
Figure 1. Forward and reverse citations
Reverse or backward citations
Subject patent
Forward citations
Patents considered important or relevant by subject patent
Patents which consider the subject patent to be important or relevant
The value of forward patent
citation data
Subjective valuation through human analysis is considered to be an effective means of assessing the value of a patent. However subjective evaluation is impractical for more than a handful of patents. Instead it can be efficient to rely on other people’s views of patents to avoid having to make your own assessment of large numbers of patents.
Forward citation data is an excellent source of information about other people’s views of a given patent. If a patent applicant or patent examiner has cited an earlier patent, this reflects that they thought that the earlier patent disclosed something of relevance. For this reason, the number of forward citations is often used as an indicator of patent quality, either by itself or combined with other data such as the number of patent family members, the number of reverse citations, the number of authors, and other patent data.
However there are a couple of limitations of using forward citation data by itself:
• Some forward citations are worth more than others. For example, a forward citation might come from a patent that has been
commercialized and created billions of dollars in wealth. However relying on a simple count of forward citations will not show this.
• The end result from a forward citation count is merely a simple number. This number does not provide information on how the different patents relate to each other.
Introducing Network Patent
Analytics
Network Patent Analytics is the process of using patent citation data to build an interconnected network. Patents in the centre of this network are thought to have more influence and hence be more important than patents at the edge of this network. Patent Network
Analytics is a development of network analysis, which has been used to map relationships between politicians to find the most influential politicians, or to determine influential websites by considering its linkages.
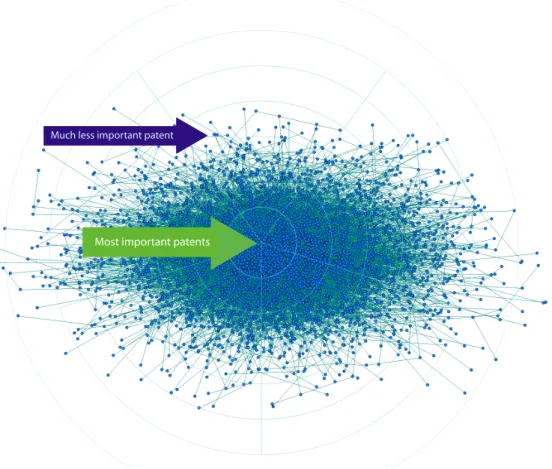
The structure of the resulting patent network can be used to show closely related groups of patents, their common areas of technologies, and who owns these patents. Statistical methods can be applied to rank the centrality, and hence the importance, of individual patents within this network. Other statistical methods can be used to rank the importance of patent owners, inventors, technology classes and so on within this network. Figure 2 shows a schematic of a network of 5000 patents.
Much less important patent
Most important patents
Figure 2. Network of 5000 patents. The most influential patents sit in the centre of this network, and the least influential patents at the edge
Network Patent Analytics was developed by Optimice, a commercial partner of Griffith Hack. Griffith Hack is the exclusive Australian licensee of the Optimice Network Patent Analysis, and is applying its knowledge of patent searching and patent analysis to introduce this advanced technique into Australia and other regions.
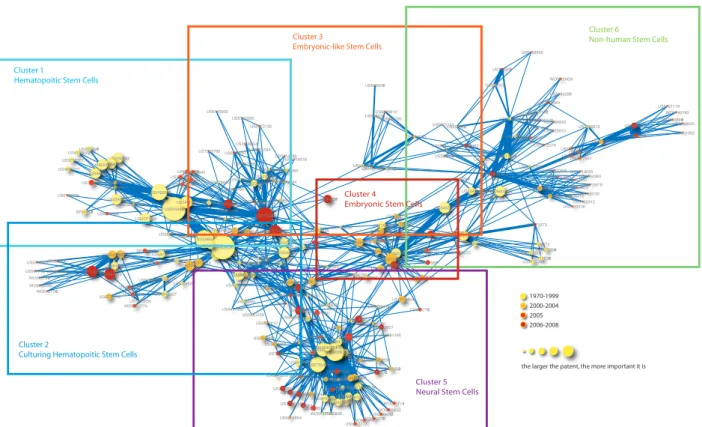
Network Patent Analytics has been previously applied to stem cell patents, where it was able to show technology structures in key stem cell patents, Figure 3. These results were recently published by Nature Biotechnology. More recently Network Patent Analytics has been used by Griffith Hack in conjunction with
Optimice to show technology structures and key patents and patent owners in the hybrid car area. Among other findings, Network Patent Analytics was able to successfully predict a patent infringement issue. EP169672 EP233838 EP241578 EP341966 EP358506 GB2213831 US3344617 US3753357 US3758382 US4004975 US4059967 US4199022 US4224404 US4396601 US4411990 US4560655 US4714680 US4721096 US4753635 US4965204 US4980174 US4980277 US4994384 US5004681 US5021349 US5035994 US5057420 US5061620 US5082670 US5087570 US5096822 US5160312 US5162215 US5166065 US5175383 US5175384 US5175385 US5192553 US5197985 US5199942 US5213979 US5226914 US5282861 US5288625 US5340740 US5397706 US5399493 US5409825 US5411883 US5434340 US5436151 US5437994 US5443950 US5449620 US5453357 US5460964 US5464764 US5472867 US5486359 US5487992 US5496720 US5501662 US5510262 US5523226 US5545806 US5569825 US5580777 US5580781 US5589376 US5591625 US5591669 US5599703 US5605822 US5612205 US5612211 US5625126 US5627059 US5631153 US5633076 US5635386 US5635387 US5639618 US5646043 US5650317 US5654183 US5654186 US5656479 US5661016 US5670351 US5670372 US5672499 US5677139 US5681559 US5688692 US5693482 US5700289 US5712134 US5716616 US5721118 US5728581 US5733541 US5733542 US5744361 US5750376 US5753506 US5763197 US5766951 US5770429 US5789650 US5811094 US5814318 US5814511 US5824489 US5827735 US5827740 US5830510 US5843780 US5849553 US5851832 US5879940 US5891691 US5905041 US5906934 US5908784 US5914108 US5914268 US5919176 US5925567 US5942225 US5942435 US5945337 US5958767 US5968829 US5980885 US5981165 US5993429 US6001654 US6010696 US6023010 US6025155 US6040180 US6059968 US6077697 US6080576 US6090622 US6091001 US6093531 US6103530 US6103694 US6149902 US6171610 US6190368 US6190655 US6200806 US6204061 US6224860 US6238922 US6245566 US6258998 US6271436 US6280718 US6294346 US6300129 US6300314 US6322784 US6331406 US6333192 US6338942 US6368854 US6372210 US6440734 US6458592 US6461645 US6468794 US6497872 US6528306 US6548299 US6569427 US6605275 US6607720 US6638501 US6645489 US6743967 US6777231 US6777233 US6833269 US6875607 US6887706 US6936469 US6962698 WO0027999 WO0121766 WO8802774 WO8903872 WO9003432 WO9003439 WO9006757 WO9015877 WO9102003 WO9109936 WO9117141 WO9117242 WO9222646 WO9301275 WO9309802 WO9403199 WO9409119 WO9416718 WO9500632 WO9528412 WO9609543 WO9615226 WO9633265 WO9707668 WO9707669WO9712035 WO9733978 WO9740183 WO9808964 US7312078 US6068836 US7249569 US7253334 US7312025 US6699834 US7071373 US7101709 US7067316 US7192769 US6700037 US6972130 US7145056 US7202080 US6828145 US7129034 US7297539 US7294511 US6027937 US6576464 US6863885 US7255879 US7015037 US7311904 US7311905 US7074983 US7312374 US7048921 US7045148 US6897061 US7303912 US6984522 US7115360 US7049141 US7204979 US6498018 US6835566 US7169547 US7145057 US7153684 US6384298 US6936281 US7303769 US6759244 US7186883 US6733746 US6667034 US6689610 US6562619 US7005252 US6800480 US6642048 US6667176 US6686188US6656700 US6541255 US6680198 US6897060 US6534052 US7285415 US7037719US7153686 US7217565 US7105150 US6749850 US7037493 US6878543 US6602711 Cluster 1
Hematopoitic Stem Cells
Cluster 3
Embryonic-like Stem Cells
Cluster 6 Non-human Stem Cells
Cluster 5 Neural Stem Cells
Cluster 2
Culturing Hematopoitic Stem Cells
Cluster 4 Embryonic Stem Cells
1970-1999 2000-2004 2005 2006-2008
the larger the patent, the more important it is
Figure 3. Technology structures in Stem Cell patents:
Objectively ranking patents, patent owners, inventors or any other subset
Network Patent Analytics can rank and place a relative value on either individual patents, or groups of patents such as by patent owner, inventor, technology etc.
Ability to identify and include ‘missed’ patents
Network Patent Analytics can identify important patents that were missed in the original patent search, but have been cited by patents in this search. These cited patents are treated the same as other patents in the subsequent analysis. This is helpful as patent searching can be imperfect due to patent searching being limited by errors in patent classification and keywords used in patent abstracts and titles. Including patents cited by patents in the initial search improves the final analysis.
Patent and technology clustering Network Patent Analytics can separate the result of patent searches into different technology clusters, where there is a very strong relationship between patents within a cluster, and very little or no relationship between patents across clusters. These clusters can show different approaches used to solve a particular problem.
Ability to handle large numbers of patents
Network Patent Analytics can handle very large patent data sets, of up to 100,000 patents or more. Rather than being confused by large patent data sets, Network Patent Analytics uses the complexity of these large datasets to come up with more robust results.
Flexibility Network Patent Analytics can be extended using other network information such as: common patent families, inventors, patent owners, keywords, or other linkages. Benefits of Network Patent Analytics over alternative patent analysis methods include:
Commercial applications of
Network Patent Analytics
Commercial applications of Network Patent Analytics include:
• Objectively determining which patents, companies, technology types and inventors are most important in a particular area of technology
• Assessing the technology and ownership structure of a given technology area
• Determining unexpected infringement risks
• Assessing the overall quality of patent portfolios as an aid to acquisition, fund raising and disposal of patents and patent owning businesses
• Determining the highly and lowly rated patents in individual patent portfolios, assisting patent management decisions
• Identifying “orphaned”
technologies, these are patents that are considered “non-strategic” by their owners, but which are rated and may be valuable to other parties • Assessing the quality of your
competitor’s patents and patent portfolios
• IP due diligence prior to new investment or research in technology areas
Commercial process for
application of Network Patent
Analytics
The following process is a sample template for the commercial application of Network Patent Analytics:
1. The client and Griffith Hack will carefully define the problem to be solved by Network Patent Analytics 2. Griffith Hack will:
a) develop a patent search query to collect the patent data likely to be important to solve the defined problem;
b) run the patent search query to collect patent data from relevant databases, including patent numbers, owners, titles, abstracts and relevant patent citation data; c) group patents into families,
including combining patent citation data;
d) work with Optimice to apply Network Patent Analytics to look for dominant technology clusters, patents, technologies and applicants in the patent data;
e) prepare spreadsheets of patent families in ranked order, including ancillary information such as patent numbers, owners, titles, abstracts and relevant patent citation data; f) prepare draft report that applies the
result of Network Patent Analytics to the problem to be solved. 3. Griffith Hack will meet with the
client to ensure that the draft report has met the client’s needs.
4. Griffith Hack will prepare the final report, along with spreadsheet of ranked patents, and then meet with client to determine if any follow-up is required, such as detailed infringement analysis for identified infringement risks.
The exact process to be used would depend on the specific requirements of each client engagement, and will be agreed with each client in advance of each engagement.
Contact
Melbourne Mike Lloyd [email protected] (03) 9243 8315 Sydney George Mokdsi [email protected] (02) 9925 5975 BrisbaneBrendan Nugent, Principal
[email protected] (07) 3232 1718
Perth
Tony Mizzi, Principal
[email protected] (08) 9213 8309