2013, 12(8): 1402-1408 August 2013 REVIEW
Impacts of Climate Change on Agriculture and Adaptive Strategies in China
LI Rui-li
1and Shu Geng
1, 21 School of Environment and Energy, Shenzhen Graduate School, Peking University, Shenzhen 518055, P.R.China 2 Department of Plant Sciences, University of California, Davis, CA 95616, USA
Abstract
China is the world’s most populous country and a major emitter of greenhouse gases. Consequently, China’s role in climate change has received a great deal of attention, whereas the impact of climate change on China has been largely ignored. Studies on the impacts of climate change on agriculture and adaptation strategies are increasingly becoming major areas of scientific concern. However, the clear warming that has been sounded in China in recent decades has not been matched with a clear assessment of the impact of climate change on China’s water resources and agriculture. In the present study, we review observations on climate change, hydrology, and agriculture in China and relate these observations to likely future changes. We also analyse the adaptive strategies in China’s agriculture.
Key words:agriculture, China, climate change, hydrology, temperature
Received 17 October, 2012 Accepted 10 January 2013
Correspondence Shu Geng, Tel: +86-755-26032802, E-mail: sgeng@ucdavis.edu, gengxu@pkusz.edu.cn
INTRODUCTION
Over the last several decades, climate warming has been observed on local, regional, and global scales (Boyles and Raman 2003; Du et al. 2004; Macdonald et al.
2005; Piao et al. 2010; Wu and Zhao 2010; Qiu et al.
2012). The IPCC (Intergovernmental Panel on Climate Change) (2007a) report presents a detailed evaluation of long-term worldwide observations on climate change and a sound physical analysis of the potential trends of changes in climate. The report concludes that global climate is very likely to get warmer in the near future. As scientific evidence becomes more convincing that increasing concentrations of greenhouse gases will warm the planet (IPCC 2007a), it has become ever more important to understand the impacts of global warming. The impacts on agriculture are among the largest and the best documented.
Agronomic studies indicate that if the same crops
are grown in the same places, crop yields will decline under various climate change scenarios (IPCC 2007b). Even with adaptation measures, studies applying the Ricardian approach in Africa (Kurukulasuriya et al. 2006; Kurukulasuriya and Mendelsohn 2008) and South America (Seo and Mendelsohn 2008) suggest that the warming will lower net revenues from the farm. Furthermore, climate change will have different impacts on different countries. Many agronomic modelling stud-ies have assessed the impacts of climate change on several grain crops in various regions of China. The general findings of these studies are that crop yields will decline in China as in other developing countries (Matthews and Wassmann 2003; Parry et al. 2004; Tao
et al. 2006; Xiong et al. 2007; Yao et al. 2007). Cli-mate change and its impacts on water resources and crop production are a major force that China and the rest of the world will have to reckon with in the 21st century (Lin et al. 2007; Meehl et al. 2007). Despite the growing importance of industry, agriculture has a
central role in ensuring food security and welfare for the 1.3 billion people in China.
Over the past six decades, China has experienced a few devastating climate extremes. For instance, the great drought of 2000 extended over 41 million hectares (Mha) and affected 27 Mha, causing crop losses estimated at 60 million tonnes, which translate to economic losses of over 51 billion RMB. The great flood of 1991 covered 25 Mha and affected 15 Mha, causing economic losses of about 78 billion RMB. In 2003, uncommonly high temperatures prevailed for 12 d in South China, with Zhejiang Province recording the highest temperature, 43.2°C, causing severe drought and river runoff (Chen
et al. 2010). The great flood of 1998 inundated 21 Mha and destroyed five million houses in the Yangtze basin, causing an economic loss of over 130 billion RMB (Zong and Chen 2000). Despite the enormous importance of the subject and the growing number of specific studies, multidisciplinary synthesis of knowledge on the impacts of climate change on China is scarce.
In the present study, the first section deals with re-cent observations and projections on climate change; the second covers data over the past six decades and projected future trends in water resources; and the third section investigates the impacts of climate change on agriculture in China. The last section emphasizes a multi-pronged approach that combines increasing wa-ter-storage capacity (through such structures as dams) and more equitable distribution of water with other strat-egies such as drought-resistant crop varieties, appro-priate cropping patterns, more efficient irrigation, and recycling of wastewater.
PROJECTION OF TRENDS IN CLIMATE
CHANGE
Global warming refers to the rising average tempera-ture of the Earth’s atmosphere and rising sea level that is predicted to continue. Global average temperature is 0.75°C higher than what it was in 1880 (Fig. 1-A). Moreover, the rate of January warming (Fig. 1-B, 0.007°C per year) was nearly twice the rate of June warming (Fig. 1-C, 0.0058°C per year) during the period 1880-2010. However, the average temperature has increased by 0.66°C since 1950 globally (y=0.0111x-7.8433,
R2=0.7381) although the January warming (y=0.0117x
-8.9132, R2=0.5733, 0.011°C per year) continued to be
nearly twice the rate of June warming (y=0.0103x -6.2627, R2=0.6474, 0.0103°C per year) during the
pe-riod 1950-2010.
The strong warming of China over the past six de-cades is firmly supported by ongoing measurements from 156 meteorological stations. The average temperature is 1.23°C higher than that in 1950. All the warmest years occurred during the last decade (Fig. 1-D), and the rate of January warming (Fig. 1-E, 0.04°C per year) is nearly twice the rate of summer warming (Fig. 1-F, 0.02°C per year). Although China’s overall mean annual temperature has been rising significantly over the past six decades, there are marked regional contrasts. Northern China is warming faster than southern China: the average tempera-ture has been rising by 0.035°C every year in the north-west (Xu et al. 2011), by 0.03°C in the north-east (Xie
et al. 2009), by 0.018°C in the south-west (Dai et al.
2011), and by 0.02°C in the south (Li et al. 2010). IPCC global climate models are unequivocal that the warming trend will continue, but uncertainties about the extent and the rate of change are large. China’s average temperature is estimated to increase further by 1-5°C by 2100 (Meehl et al. 2007). This 4°C range reflects not only the uncertainty in IPCC’s greenhouse gas emission economic scenarios (a range of 2°C) (Nakiæenoviæ and Swart 2000) but also the spread among climate models when forced by the same sce-nario (a range of 3°C). Moreover, a much stronger future warming rate in summer was found than what is currently observed (Meehl et al. 2007). Such pro-nounced summer warming would inevitably enhance evapo-transpiration, increasing the risk of water short-age for agriculture in China.
IMPACT OF CLIMATE CHANGE ON WATER
RESOURCES
It is well known that water resources are crucial to human prosperity and crop productivity. The world’s agriculture, hydroelectric power, and water supplies depend on different components of the hydrological cycle, including the natural replenishment of surface and groundwater resources (ACE, Atmosphere, Climate and
Environment 2002). Climate change is one of the great-est pressures on the hydrological cycle along with popu-lation growth, pollution, changes in land use, and other factors (Aerts and Droogers 2004). Availability of water is threatened by the changing climate because of pos-sible decrease in precipitation in some regions of the world. In China, average precipitation decreased by 1 mm every year from 1950 to 2010 (Fig. 2), as reflected in ongoing measurements from 156 meteorological stations. Meanwhile, there are significant regional dif-ferences in the trends of precipitation: Summer and au-tumn precipitation has been falling in the drier regions of North China and Northeast China, whereas summer and winter precipitation in the wetter region of southern China has been increasing (Piao et al. 2010).
There have been a remarkable number of droughts and floods in China during the period 1950-2010 (Fig. 3). Meanwhile, trends in heavy rainfall events leading to floods show high spatial heterogeneity. These extreme events seem to have become more frequent over North-west China and the middle to lower reaches of the Yangtze River, but less frequent in Northeast China and the Northwest Yangtze River (Zhai et al. 2005). Ac-cording to regional climate models, the frequency of heat waves and rainfall extremes in the future may in-crease over most of China (Zhang et al. 2006). Moreover, drought is one of the most severe manifes-tations of climate variability in China and a cause for concern for agriculture and human life given that the country is already quite dry (3.32×10⁶ km2 of dry lands)
Fig. 1 Global average temperature change, 1880-2010 (A-C) and China’s average temperature change, 1950-2010 (D-F). Source for global data: http://data.giss.nasa.gov/gistemp/tabledata_v3/GLB.Ts+dSST.txt. Source for China data: China Meteorological Stations.
(Ci and Wu 1997). Over the past six decades, severe droughts hit China in the 1960s, in the late 1970s, early 1980s, and in the late 1990s (Fig. 3). Yet, climate im-pacts on water resources have varied in different river basins. The frequency of droughts and floods is ex-pected to increase in the future. Besides, runoff and stream flow are known to be more sensitive to rainfall
than to evapo-transpiration (Kang et al. 2009).
Impact of climate change on agriculture
China’s food security is threatened by climate change. One of the most serious challenges for the country in the 21st century is to supply sufficient food for China’s in-creasing population while sustaining the already stressed environment. In recent years, more and more attention has been paid to the risks associated with climate change, which will make food production increasingly uncertain. Water availability will be one of the limiting factors for crop production and food security (Reddy et al. 2000). Many regions lie in transitional zones where water resources, and hence agricultural production, would be affected positively or negatively by climate change. The Palmer drought severity index (PDSI), the gross irrigation quota (GIQ), and the per-hectare grain output (PHGO) were used as specific indices of climate change, agricul-tural water use, and grain production, respectively, to analyse inter-annual variation and the correlation between
PDSI, GIQ, and PHGO in China from 1949 to 2005. Good linear correlation was found between PHGO and
PDSI during 1949-1983 (eq. (1)) and between PDSI and
GIQ during 1949-1990 (eq. (2)), which indicates that cli-mate change affects agricultural water use and grain pro-duction significantly, whereas its impact on human fac-tors (technological progress, policy mechanisms, produc-tion inputs, etc.) is relatively small during the above peri-ods (Wu and Zhao 2010).
PHGO=-1 094.4PDSI+1 668 (R2=0.7611) (1)
GIQ=-942.7PDSI+7 406 (R2=0.7064) (2)
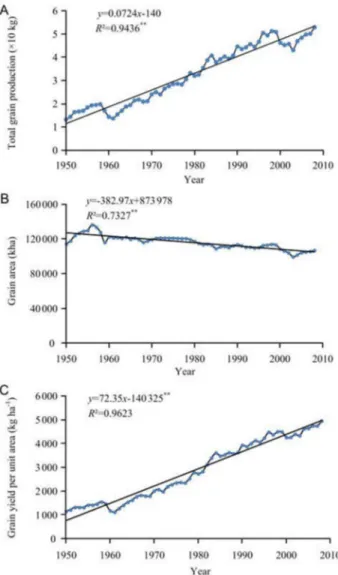
Total grain production and grain yield per unit area in China have been increasing over the last six decades (Fig. 4). Without incorporating the beneficial effects of enhanced levels of CO2 in the crop models, climate change may lead to a 13% reduction in net yield by 2050 (Xiong et al. 2009). More precisely, climate-induced yield reductions are projected to be 4-14% for rice, 2-20% for wheat, and 0-23% for maize by mid-21st century (Xiong et al. 2009). Another study pro-jected that a one degree rise in temperature may de-crease rice yield at a probability of 90% (Tao et al.
2008). Moreover, impacts of climate change on crop yields will vary with the area: depending on the latitude and availability of irrigation, yields will increase in some regions and decrease in others (Kang et al. 2009). In-Fig. 2 Changes in annual precipitation during the period
1950-2010 in China. Data source: China Meteorological Sations.
Fig. 3 Changes in cropland areas affected by natural disaster (A), cropland areas affected by droughts (B), and cropland areas affected by flooding (C) during the period 1950-2010 in China. The data were expressed as a deviation from the 1950-2010 average. Data source: National Bureau of Statistics of China, 2011.
crease in irrigation and precipitation will boost crop yields since they are more sensitive to precipitation than to temperature. The positive effects of climate change on agriculture are attributed to higher CO2 concentrations, a longer period of crop growth at higher latitudes and in mountain ecosystems, lower incidence of pests and diseases, and faster decomposition of soil organic mat-ter at higher temperatures (Lal 2005).
Adaptive strategies in China
Climate change has already had significant impacts on water resources, food security, hydropower, and hu-man health worldwide, especially so in Africa. Studies on the impacts of climate and on adaptation strategies
are increasingly becoming major areas of scientific interest. Over the past several decades, China has been active in mitigating the adverse effects of climate change and in adapting to the impacts of climate change on wa-ter resources and agriculture. The country has promul-gated a series of laws to enhance sustainable use of wa-ter resources, particularly for agricultural development. Agriculture and water resources were two of the four key areas for adaptation to climate change set out in China’s national climate change program (National De-velopment and Reform Commission 2007). China has long emphasized the importance of enlarging regional water storage capacity, strengthening its water resources, and improving the management of infrastructure related to water resources. Further, China is developing stress-resistant cultivars through the Seed Project, which aims at breeding varieties that can cope better with extreme climate events (State Council Information Office 2008). Hydroelectric projects such as the South-to-North Water Diversion Project are planned to help optimize the allocation of water resources, to control floods in major rivers, and to alleviate drought in the north (Ministry of Water Resources 1998; Yang and Pang 2006). An ex-tensive system of canals and pipelines, once it is com-plete in 2050, will carry 45 billion cubic metres of water annually from China’s moist south to its arid north, thus alleviating groundwater depletion. The nation will spend 486 billion CNY (USD 75 billion) in total on the system. However, we must fully consider the cost and such nega-tive effects of the system on ecology as disturbance to the ecological balance of the upper reaches and higher emissions of CO2 due to high energy consumption.
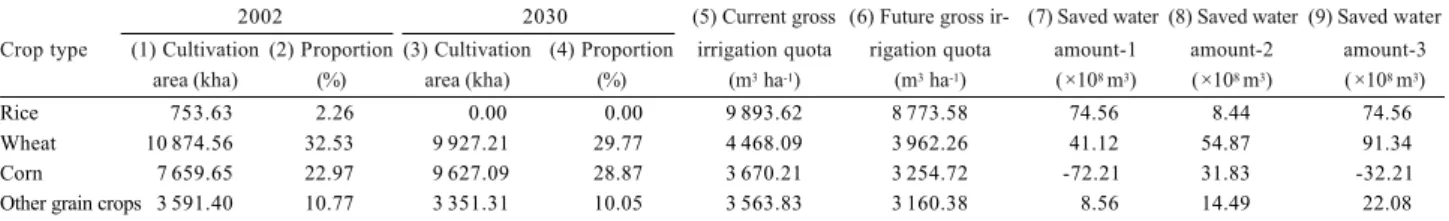
Although many water management approaches have been adapted to mitigate the impacts of climate change, there is still room for improvement. Efficient water use and integrated management will be increasingly impor-tant for reducing the impacts of water scarcity and droughts. Agriculture could save water by using sprin-kler irrigation instead of flooding, which wastes water. Agricultural water structures (AWS) also enhance wa-ter-use efficiency. A case study of Northern China presents an optimized cropping structure for 2010 and 2030 that can lead to substantial water savings. The structure envisages lowering the proportion of crops with high water consumption and increasing that of crops with low water consumption, thereby gradually improving water-use efficiency (Gao and Luo 2008; Table). The Fig. 4 Changes in total grain production (A), grain area (B), and
grain yield per unit area (C) during the period 1950-2010 in China. Data source: National Bureau of Statistics of China, 2011.
case study shows that AWS optimization can save 199.94×10⁸ m3 of water every year. Integrated
water-sav-ing measures along with optimized AWS can save addi-tional 29.97×10⁸ m3 of water every year (Wang et al. 2010).
Lastly, wastewater recycling is also important. There is sufficient wastewater in China to be treated (Fig. 5). It is essential to collect more reliable data on how much water is actually available for recycling and on the
changing patterns of water demand and supply. In China, the problem is particularly acute because funds for monitoring water supplies have never been available. Many approaches need to work in parallel to make fun-damental changes in the situation: sufficient financial backup, policies with clear incentives and sanctions, law enforcement, market mechanisms and public education, international communications, and so on.
Fig. 5 Industrial waste water discharge in China during the period 1980-2010. Data source:Ministry of Water Resources of China, 2011.
Acknowledgements
This work was financially supported by the Special Pro-gram of Postdoctor Science Foundation of China (201104025). We thank Mrs Priscilla Lynne Young (Peking University) for critically reading and revising the manuscript. We thank Master Cheng Li (Peking University) for data collecting and analysis.
References
ACE (Atmospheric, Climate and Environment). 2002. In: Buchdahl J, ed., Climate Change Fact Sheet for Key Stage 4 and A-Level. Manchester Metropolitan University Press, Manchester. pp. 1-171.
Aerts J, Droogers P. 2004. Climate Change in Contrasting River Basins: Adaptation Strategies for Water, Food,
and Environment. CABI Publishing, The Netherlands.
pp. 1-264.
Boyles R P, Raman S. 2003. Analysis of climate trends in North Carolina (1949-1998). Environment International,
29, 263-275.
Chen H L, Zhang H W, Xue C Y. 2010. Extreme climate events and agricultural meteorological services in China.
Meteorological and Environmental Science, 33, 67-77. Ci L J, Wu B. 1997. Climatic type division and the potential extent determination of desertification in China. Journal of Desert Research, 17, 107-111. (in Chinese)
Dai S W, Yang X G, Zhao M, Li Y, Wang W F, Liu Z J. 2011. Changes of China agricultural climate resources under the background of climate change II. Spatiotemporal change characteristics of agricultural climate resources in Southwest China. Chinese Journal of Applied Ecology, 22, 442-452. (in Chinese)
Du M Y, Kawashima S, Yonemura S, Zhang X Z, Chen S B. 2004. Mutual influence between human activities and climate change in the Tibetan Plateau during recent years. Global and Planetary Change, 41, 241-249. Gao M J, Luo Q Y. 2008. Study on cropping structure
optimization in region short of water - A case study of North China. Journal of Natural Resources, 23, 204-210. (in Chinese)
IPCC (Intergovernmental Panel on Climate Change). 2007a.
Contribution of Working Group I to the Fourth Assessment Report. Cambridge University Press, Cambridge, UK.
IPCC (Intergovernmental Panel on Climate Change). 2007b.
Impacts, Adaptation and Vulnerability. Cambridge University Press, Cambridge, UK.
Kang Y H, Khan S, Ma X Y. 2009. Climate change impacts oil crop yield, crop water productivity and food security - A review. Progress in Natural Science, 19, 665-674. Kurukulasuriya P, Mendelsohn R. 2008. A Ricardian analysis
of the impact of climate change on African cropland. Table Saved water quantity by agricultural water structure (AWS) optimization in North China (Gao and Luo 2008)
2002 2030 (5) Current gross (6) Future gross ir- (7) Saved water (8) Saved water (9) Saved water
Crop type (1) Cultivation (2) Proportion (3) Cultivation (4) Proportion irrigation quota rigation quota amount-1 amount-2 amount-3
area (kha) (%) area (kha) (%) (m3ha-1) (m3ha-1) ( ×108 m3) ( ×108 m3) ( ×108 m3)
Rice 753.63 2.26 0.00 0.00 9 893.62 8 773.58 74.56 8.44 74.56 Wheat 10 874.56 32.53 9 927.21 29.77 4 468.09 3 962.26 41.12 54.87 91.34 Corn 7 659.65 22.97 9 627.09 28.87 3 670.21 3 254.72 -72.21 31.83 -32.21 Other grain crops 3 591.40 10.77 3 351.31 10.05 3 563.83 3 160.38 8.56 14.49 22.08 (7)=[(1)×(5)-(3)×(5)]/105; (8)=[(1)×(5)-(1)×(6)]/105; (9)=[(1)×(5)-(3)×(6)]/105
Africa Agriculture Research Economics, 2, 1-23. Kurukulasuriya P, Mendelsohn R, Hassan R, Benhin J, Diop
M, Eid H M, Fosu K Y, Gbetibouo G, Jain S, Mahamadou A, et al. 2006. Will African agriculture survive climate change? World Bank Economics Review, 20, 367-388. Lal R. 2005. Climate change, soil carbon dynamics, and global food security. In: Lal R, Stewart B A, Uphoff N, Hansen D O, eds., Climate Change and Global Food Security. CRC Press, Boca Raton (FL). pp. 113-143. Li Y, Yang X G, Wang W F, Liu Z J. 2010. Changes of China
agricultural climate resources under the background of climate change I. Spatiotemporal change characteristics of agricultural climate resources in South China. Chinese Journal of Applied Ecology, 21, 2605-2614. (in Chinese) Lin E, Xu Y L, Wu S H, Ju H, Ma S M. 2007. China’s national assessment report on climate change (II): climate change impacts and adaptation. Advance in Climate Change Research, 3, 6-11. Lin E, Xu YL, Wu SH, Ju H, Ma SM. 2007. Macdonald R W, Harner T, Fyfe J. 2005. Recent climate change in the Arctic and its impact on contaminant pathways and interpretation of temporal trend data.
Science of the Total Environment, 342, 5-86.
Matthews R B, Wassmann R. 2003. Modeling the impacts of climate change and methane emission reductions on rice production: a review. European Journal of Agronomy, 19, 573-598.
Meehl G A. 2007. Global climate projections. In: Solomon S, Qin D, Manning M, Chen Z, Marquis M, Averyt K B, Tignor M, Miller H, eds., Climate Change 2007: The Physical Science Basis. Cambridge University Press, Cambridge, UK. Ministry of Water Resources. 1998. China’s Water Agenda
21. China Water and Power Press, China. (in Chinese) Ministry of Water Resources of the China. China Water Resources Bulletin. [2012-03-15]. http://www.mwr.gov. cn/zwzc/hygb/szygb/ (in Chinese)
Naki enovi N, Swart R. 2000. Special Report on Emissions Scenarios. A Special Report of Working Group III of the Intergovernmental Panel on Climate Change. Cambridge University Press, Cambridge, UK.
National Bureau of Statistics of China. China’s Agricultural Statistics 2011. [2012-03-05]. http://www.stats.gov.cn/ tjsj/ndsj/2011/indexch.htm (in Chinese)
National Development and Reform Commission. 2007. China’s National Climate Change Program. [2002-02-15]. http://www.ccchina.gov.cn/WebSite/CCChina/ UpFile/File188.pdf (in Chinese)
Parry M L, Rosenzweig C. Iglesias A, Livermore M, Fischer G. 2004. Effects of climate change on global food production under SRES emissions and socio-economic scenarios. Global Environment Change, 14, 53-67. Piao S L, Ciais P, Huang Y, Shen Z H, Peng S S, Li J S, Zhou
L P, Liu H Y, Ma Y C, Ding Y H, et al. 2010. The impacts of climate change on water resources and agriculture in China. Nature, 467, 43-51.
Qiu G Y, Yin J, Geng S. 2012. Impact of climate and land-use changes on water security for agriculture in Northern China. Journal of Integrative Agriculture, 11, 144-150. Reddy V R, Pachepsky Y A. 2000. Predicting crop yields under
climate change conditions from monthly GCM weather projections. Environment Model Software, l5, 79-86. Seo S N, Mendelsohn R. 2008. A Ricardian analysis of the
impact of climate change on South American farms.
Chilean Journal of Agriculture Research, 68, 69-79. State Council Information Office. 2008. China’s policies
and actions on climate change. [2011-12-10]. http:// www.china.org.cn/government/news/200810/29/ content_16681689.htm (in Chinese)
Tao F L, Hayashi Y, Zhang Z, Sakamoto T, Yokozawa M. 2008. Global warming, rice production, and water use in China: developing a probabilistic assessment.
Agricultural and Forest Meteorology, 148, 94-110. Tao F L, Yokozawa F, Xu Y L, Hayashi Y, Zhang Z. 2006.
Climate change and trends in phenology and yields of field crops in China, 1981-2000. Agricultural and Forest Meteorology, 138, 82-92.
Wang Y B, Wu P T, Zhao X N, Li J L. 2010. Development tendency of agricultural water structure in China. Chinese Journal of Eco-Agriculture, 18, 399-404. (in Chinese) Wu P T, Zhao X N. 2010. Impact of climate change on
agricultural water use and grain production in China.
Transactions of the CSAE, 26, 1-6. (in Chinese) Xie L Y, Guo M S, Cao M J, Liu E C, Gao X N. 2009. Strategies
and countermeasures to climate change for agriculture in Northeast China. Advance in Climate Change Research, 5, 174-178. (in Chinese)
Xiong W, Matthews R, Holman I, Lin E, Xu Y. 2007. Modeling China’s potential maize production at regional scale under climate change. Climate Change, 85, 433-445.
Xiong W, Conway D, Lin E, Xu Y L, Ju H, Jiang J H, Holman I, Li Y. 2009. Future cereal production in China: modeling the interaction of climate change, water availability and socio-economic scenarios. Global Environmental Change, 19, 34-44.
Xu C, Yang X G, Li Y, Wang W F. 2011. Changes of China agricultural climate resources under the background of c l i m a t e c h a n g e I I I . S p a t i o t e m p o r a l c h a n g e characteristics of agricultural climate resources in Northwest Arid area. Chinese Journal of Applied Ecology, 22, 763-772. (in Chinese)
Yang X L, Pang J W. 2006. Implementing China’s “Water A g e n d a 2 1 ” . F r o n t i e r s i n E c o l o g y a n d t h e Environment, 4, 362-368.
Yao F, Xu Y, Lin E, Yokozawa M, Zhang J. 2007. Assessing the impacts of climate change on rice yields in the main rice areas of China. Climate Change, 80, 395-409. Zhai P M, Zhang X B, Wan H, Pan X H. 2005. Trends in
total precipitation and frequency of daily precipitation extremes over China. Journal of Climate, 18, 1096-1108. Zhang Y, Xu Y L, Dong W J, Cao L J, Sparrow M. 2006. A future climate scenario of regional changes in extreme climate events over China using the PRECIS climate model. Geophysical Research Letters, 33, 1-6. Zong Y Q, Chen X Q. 2000. The 1998 flood on the Yangtze,
China. Natural Hazards, 22, 165-184.