A Successful
School Integration Program
Gábor Kézdi − Éva Surányi
ROMA EDUCATION FUND W or ki n g p ap er № 2
Gábor Kézdi – Éva Surányi
A Successful
School Integration Program
An Evaluation of the Hungarian
National Government’s School Integration Program
2005-2007
ROMA
EDUCATION FUND
r o m a e d u c a t i o n f u n d 2
Copyright © Roma Education Fund, 2009 All rights reserved
ISBN- 978-963-9832-07-7
a S u c c e s s f u l S c h o o l in t e g r a t io n P r o g r a m 3
C
ontents
Foreword ... 5 1. Introduction ... 92. Background and Methodology ... 15
2.1 The OOIH Program ... 15
2.2 The Control Group ... 16
2.3 Data Collection... 20
2.4 Validity and Standardization of the Tests ... 26
2.5 Disadvantaged and Roma Students ... 27
2.6 Identifying the Impact of the Program ... 30
2.7 Controlling for Social Desirability ... 31
3. Integration of Roma and Disadvantaged Students ... 35
3.1 Integration within Schools ... 35
4. Teaching Methods, Classroom Management and Student Behavior ... 41
4.1 General Physical Conditions ... 42
4.2 Classroom Seating ... 43
4.3 Homework ... 43
4.4 Personality and Motivation ... 44
4.5 Use of Educational Tools ... 45
4.6 Interpersonal Relationships in the Classroom ... 45
4.7 Didactic and Student-centered Elements ... 47
4.8 Classroom Activities ... 49
4.9 Work Form ... 50
4.10 Group Work and Cooperative Learning ... 52
4.11 Individual Work ... 54
4.12 Differentiated Education ... 55
4.13 Summary ... 57
5. Reading Skills and Admission to Secondary School ... 59
5.1 Standardized Tests ... 61
5.2 Admission to Secondary School ... 67
6. Self-Esteem and Other Non-Cognitive Skills ... 73
6.1 Locus of Control ... 74
6.2 Self-Esteem ... 77
r o m a e d u c a t i o n f u n d 4 7. Inter-Ethnic Relations ... 87 7.1 Stereotypes ... 88
7.2 Prejudice and Social Distance ... 91
7.3 Social Dominance Orientation ... 94
7.4 Social Anxiety ... 96
8. What Explains the Impact of the Program? ... 99
8.1 Methodological Issues ... 100 8.2 Student-Centered Education ... 102 8.3 Work Forms ... 106 8.4 Differentiation ... 108 8.5 Student Autonomy ... 110 8.6 Cooperation ... 113
9. Class Composition and Student Outcomes ... 117
9.1 The Fraction of Roma Students ... 119
9.2 The Fraction of Disadvantaged Students ... 124
10. Concluding Remarks ... 129
a S u c c e s s f u l S c h o o l in t e g r a t io n P r o g r a m 5
F
oreword
I
ntegrated education of students of differing family background is a hot policy issue in Central and Eastern Europe in general and in Hungary in particular. The most con-troversial problem is the integrated education of Roma and non-Roma students or, more generally, disadvantaged and non-disadvantaged students. The main questions are whether children of various backgrounds should be educated together or separately; what methods shall be used; and the effects of integrated versus separated education on the development of children of differing backgrounds. The debate is characterized by heated emotions and little evidence. The need for an open discussion is often expressed. Unfortunately, the need for appropriate evidence is less often heard. Our intention is to show evidence, because we believe that they are should form the basis of policy decisions.Integrated education is a topic much broader than integrating Roma and non-Roma students. Nevertheless, the focus on ethnicity in Hungarian debates is inevitable. The labor market situation of the Roma minority is disastrous, with severe negative consequences both for the Roma minority and the entire society. One of the most important causes, albeit not the only one, is the lack of skills demanded in a modern economy. And one of the most important institutions where these skills can be developed is the school. Therefore the conclusion that education may be a key element of the future success of the Roma minority. Education, in Hungary, is also mostly a state-run activity and is thus an evident subject of public policy. Supporters of integrated education believe that integration itself is crucial in the successful education of minorities. This view finds support in human rights arguments and international experience, primarily the example of the African American minority in the United States. Separation is viewed to be discriminatory in itself, regardless its consequences. A more outcome-oriented argument uses the fact that segregated education of disadvantaged minorities almost always results in low-quality education for them, which undermines the common goal of improving the labor market perspectives of the minority. Yet another argument emphasizes inter-group contact: Integrated education creates an opportunity for everyday interactions and can reduce prejudice. This is important because prejudice, often in very subtle forms, may be in part responsible for the lower success of Romanies both in education and the labor market.
Supporters of integrated education see two main tasks, one technical and one political. The technical task is to find appropriate institutional arrangements and educational methods in order to make sure that all students, minority and majority alike, progress better in an integrated environment. The political task is to convince the society of the mutual gains of integrated education.
Skeptics, on the other hand, are not convinced. They reckon that integrated education of Romanies may not bring the benefits projected by its supporters, and it may have negative
r o m a e d u c a t i o n f u n d 6
effects on some of the students. Skeptics with an eye on empirical evidence can point out that the ethnic composition of the student group is correlated with students’ development: student in classes with more Roma and/or disadvantaged students perform worse in Hungary. A seemingly inevitable conclusion is that the higher proportion of Romani and/or disadvantaged students may hold everyone back. They conclude that integrated education may harm all students, especially those belonging to the majority. Some of our results show that such a conclusion is not necessary true.
One version of the skeptical reasoning holds that while integrated education may indeed reduce prejudice it does so at the expense of the skill development of some (the “better”) students. There may therefore be a tradeoff between tolerance and academic success, which implies difficult choices for policy. How much shortfall in cognitive development should we allow for a certain increase in tolerance? What is the tradeoff between skill developments of majority versus minority students? Indeed, if these tradeoffs existed, one would not need to be racist to see more harm in integration than benefit.
Appropriate evidence would help a lot in this debate. The evidence could either support or refute the tradeoff between cognitive development and tolerance, or the tradeoff between the developments of minority students versus majority students. However, there is very little evidence in the context of Roma education in general, and in Hungary in particular. At most we have what some call “anecdotal evidence:” pieces of knowledge based on the selective use of few examples. There is a pressing need for real evidence.
This research report intends to provide such real evidence. We examine the impact of integrated education of Roma and/or disadvantaged students in elementary school, by looking at a program in which integrated education is accompanied with teacher training and other support. We examine the effects on the development of Roma and disadvantaged, as well as of non-Roma and non-disadvantaged students. The basis for the analysis is the complex model program of the National Educational Integration Network (OOIH) that focused initially on 45 schools. The most important goal of the program is providing quality education for all students in an integrated environment. The analysis of the program’s impact, therefore, provides an excellent opportunity to demonstrate the impact of integrated education when it is accompanied by adequate pedagogical support, in Hungary, in the early years of the 21st century.
Skill development, which we interpret in a broad sense, is at the core of our study. The most recent labor market research demonstrates that, besides cognitive skills and competences (e.g. literacy and numeracy), other dimensions are of comparable importance. Positive self-esteem, the sense of controlling one’s own destiny, and the ability to cope with difficult situations are found to be important determinants of labor market success. We therefore examine these skills besides cognitive development. Naturally, we also look at prejudice and social distance between Roma and non-Roma students.
This study presents the most important results of the research. The presentation is kept simple but with the aim of satisfying the appropriate scientific standards. Conclusions are drawn on the basis of appropriate methodology in terms of data collection, processing
a S u c c e s s f u l S c h o o l in t e g r a t io n P r o g r a m 7
and analysis. In order for the readers to be able to check out methods, we included some technical details in this report. Nevertheless, we attempt at making these details as clear as possible. At the end of the day, this study is about numbers. As a result, tables and graphs, not words dominate many pages of the report.
One of our goals is to show that the tools of modern social science can be used to examine the impact of programs financed from public funds in general and within the framework of educational policy in particular. We believe that such studies are necessary for open and rational public discussion. Naturally, the conclusions are subject to debate. Such debates stay within a rational framework if they are centered on methodology and focus on whether the conclusions are supported by the evidence. We would consider it to be a great success if we helped leading the debate on integrated education in this direction.
Throughout the three years of the research, we received valuable help from the program organizers, our colleagues, the teachers, students and parents of the schools in the study, and numerous research assistants and interviewers who took part in the data collection and organization.
Our first thanks go to the program organizers for providing resources and administrative assistance without any interference in the research. Their support was forthcoming regardless of our results, led only by a sincere need to get to know the real impact (and the belief that it would be positive). Among the organizers our special thanks go to Judit Szőke, Mariann Szemenyei, Tamás Varga and Orsolya Szendrey. The research would have been impossible without Gábor Kertesi’s initiative and ongoing support. Our colleagues helped by valuable advice. In addition to Gábor Kertesi, we express our thanks to Gábor Havas, Vera Messing and András Semjén for their helpful comments. Benő Csapó and Mrs. Mária Bogár Németh provided significant assistance by making appropriate tests available to us.
Invaluable help was provided by the management, teachers, students and their parents from the participating schools, the control sample and the national standardization sample. The research is anonymous with respect to schools; therefore, we cannot express our gratitude to each of them. Some of the schools provided valuable help in the questionnaire design in the form of open discussions and pilot interviews. Of them we offer our special thanks to Mrs. Józsefné Zágoni-Szabó and to the teachers and students of the school managed by her. The research would have been impossible without the help of our friends, colleagues and assistants who helped in organizing and implementing the data collection. Therefore our final thanks go to Rami Malik in the first place, as well as Zsófia Szeremi, Imola Kincses, Balázs Tóth, Léna Szilvási and Katalin Medvecki as well as to nearly a hundred interviewers and assistants.
Gábor Kézdi Assistant professor of economics at Central European University (CEU) and research fellow
of the Institute of Economics of the Hungarian Academy of Sciences (MTA) Éva Surányi Research fellow of the Institute of Economics of the Hungarian Academy of Sciences (MTA) and PhD student of economics at Central European University (CEU)
r o m a e d u c a t i o n f u n d 8
a S u c c e s s f u l S c h o o l in t e g r a t io n P r o g r a m 9
I
ntroduCtIon
T
he National Educational Integration Network (Hungarian acronym: OOIH)1 wasestablished in 2002. Its primary goal has been the promotion of quality education of disadvantaged and Roma2 children in elementary schools, in an integrated environment.
The program examined in this study was launched in autumn 2003 with the participation of 45 schools. The program required education in integrated groups and provided complex educational, managerial and financial support.
The substantive elements of the program are summarized in the Integrated Pedagogical System (Hungarian acronym: IPR3). It is based on the idea that school and management
is the key to successful integrated education, and the autonomy of the schools is crucial. The IPR defines several elements, some of which are compulsory, while others are optional. Some elements are specific to integration (compulsory integration within schools,4 emphasizing multicultural content, etc.), but most elements aim at providing
quality education for all children. Among other things, the IPR focuses on modern, competence-oriented and student-centered educational methods, effective classroom management, effective organization of schools, and improving the relationship of the school and its environment.
The subject of the research presented here is the OOIH integration program focusing on 45 featured schools. The scope of activities pursued by OOIH is much wider but we do not look at anything else. Our objective has been to evaluate the impact of the program. Students have been at the core of the impact assessment, that is, the issue was the impact on their development.
The regulatory background and financing of the program have undergone many changes. We have focused on schools that participated in the program from the very beginning, and
1 Országos Oktatási Integrációs Hálózat.
2 There is some controversy about the name of the Romani ethnic group. In Central and Eastern
Europe the name Roma is used, as a noun (Roma plural) and also as an adjective. It is also used by some international organizations and initiatives, such as the Roma Education Fund or the Decade of Roma Inclusion. The United Nations, the U.S. Library of Congress and other international associations use the Romani name for an adjective and a noun as well (Romanies plural). The name Gypsy is used by many non-Roma but not by the Roma: It is a name created by outsiders and is derived from the misconception of Egyptian origin. Similarly to the alternative local names such as Tsigane, Cigany, Gitane or Gitano, the name Gypsy brings negative associations about lifestyle or project images that are inaccurate for many Roma (e.g. the romantic image of travelers). In this study we use Roma and Romani interchangeably.
3 Integrált Pedagógiai Rendszer.
4 About half of Hungarian elementary schools have more than one group within grade. Group
as-signment is usually fixed for the students’ entire career within the school, and the groups are often different in terms of academic performance and social background.
r o m a e d u c a t i o n f u n d 10
we call them program schools. Within the program schools, we concentrate on children in those grades that were in the focus of the program itself.
Some studies discuss problems with the implementation of the program. Frequent changes in the organizational framework resulted in significant confusion from the schools’ viewpoint, and many elements of the program were implemented in ways that are far from the ideal.5
Our question is not relative to some ideal but relative to what would have happened without the program. In other words, we evaluate the effect of the program as it was implemented. The main focus of this study is the students: We would like to know whether the program has a positive impact on the students’ development, and if yes, in what way. We are especially interested in the potentially different impact on Roma and non-Roma students as well as disadvantaged and non-disadvantaged students. (Two thirds of the Roma students in the examined schools are disadvantaged, and two thirds of disadvantaged students were Roma; see later for the definitions.) In addition to cognitive achievement (reading comprehension, direction of further education6), we also examine broader personality traits (self-esteem,
locus of control i.e. the belief of the extent of one’s control of her/his own destiny, the ability to cope with difficult situations) as well as inter-ethnic relationships. Where possible, we concentrate on the students’ development and compare test scores to earlier test scores. Chapter 2 of the research report gives a summary of the program and the evaluation method. Our aim is to make clear what we think can learn about the impact of the program from the data. We discuss the choice of the control group, details of the data collection, measurement of ethnicity and disadvantaged status, as well as our handling of the potential distortion of questionnaire answers by social desirability.
A program’s impact is defined as the results of the participants compared to what they would have achieved had they not taken part in the program (compared to counterfactual results). Our research was carried out in 60 schools. From the 45 program schools we selected 30 and matched each to a control school. The results of the control pairs are supposed to measure the counterfactual results, i.e. the results that the students of the program schools would have achieved in the absence of the program. Of course, one can never be absolutely sure that the program schools would really have achieved similar results to those of the control schools.
5 Szilvia Németh and Attila Papp Z. “És mi adjuk az integráció vezérfonalát…”
Dokumentumelem-zés és a kvalitatív vizsgálat eredményei (And it is us who give the guiding thread to integration…”
Document analysis and the results of a qualitative examination) in Szilvia Németh [edit.]:
Integ-ráció a gyakorlatban. A roma tanulók együttnevelésének iskolai modelljei (Integration in practice.
School models of co-educating Roma children). National Public Education Institute, Budapest,
2006. http://www.oki.hu/oldal.php?tipus=cikk&hod=integracio_gyakorlatban-02_vezerfonal). Other chapters of the same volume describe a far-from-ideal situation of the integrated edu-cation policy and eduedu-cational practice in the program schools. These studies are based on docu-ment analysis and interviews.
6 In Hungary, students of grades 9 to 12 can attend three types of schools:, one being vocational
training schools without the possibility of further studies. The labor market value of the vocational training degree is low (see, for example, G. Kézdi, “Education and Earnings.” in: K. Fazekas and J. Varga (eds.), The Hungarian Labour Market 2005. In Focus: Education and the Labour Market, Institute of Economics HAS, 2005. http://econ.core.hu/doc/mt/2005/en/infocus.pdf).
a S u c c e s s f u l S c h o o l in t e g r a t io n P r o g r a m 11
A randomized experiment could have lead to such conclusions with high certainty. Unfortunately, the design of the OOIH program does not allow for randomized evaluation. However, based on the results of econometrical models, we believe that, by comparing the program schools to the control schools in the data, it is mostly the impact of the program that we capture. Since the student composition in program and control schools is identical, we are convinced that students in program schools achieve better results because of their schools. Additional analysis makes us think that those schools are better at least in part as a result of the program.
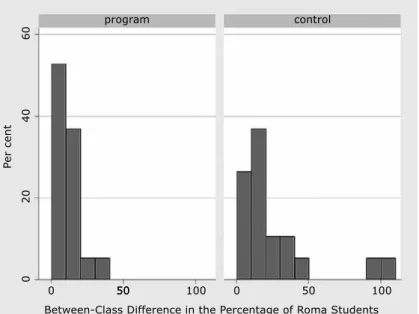
The remainder of this report is organized the following way. In Chapter 3 we show that program schools achieved ethnic integration across parallel classes (permanent student groups within the same grade). Some of the control schools achieved similar degree of integration but many maintained significant differences in the ethnic composition of their groups. The level of integration is lower in some of the other dimensions, but in those dimensions, too, program schools are at least as well-integrated as control schools.
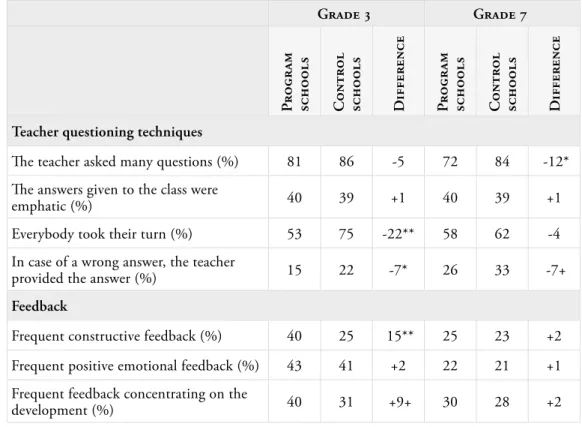
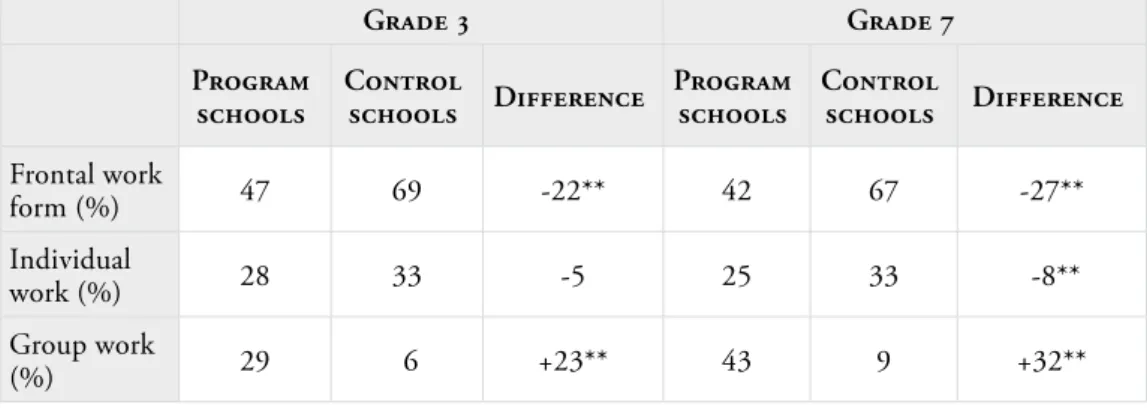
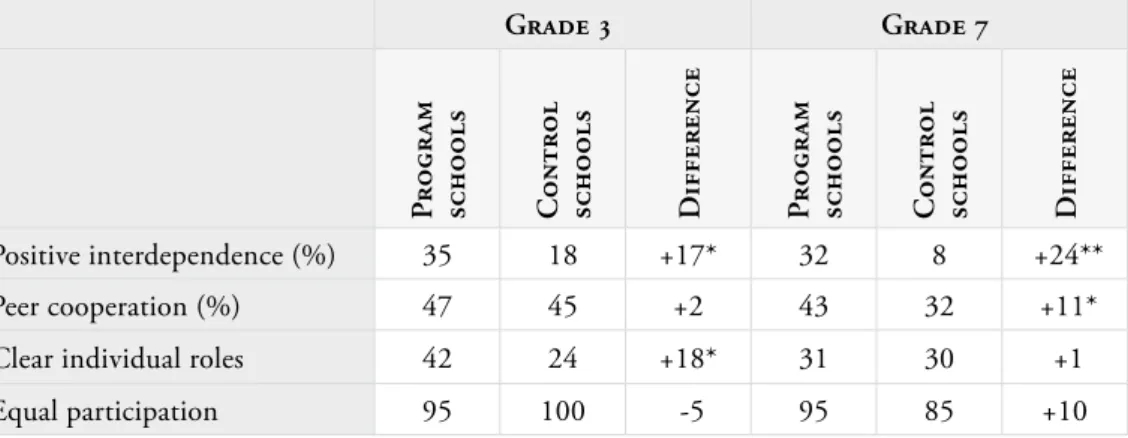
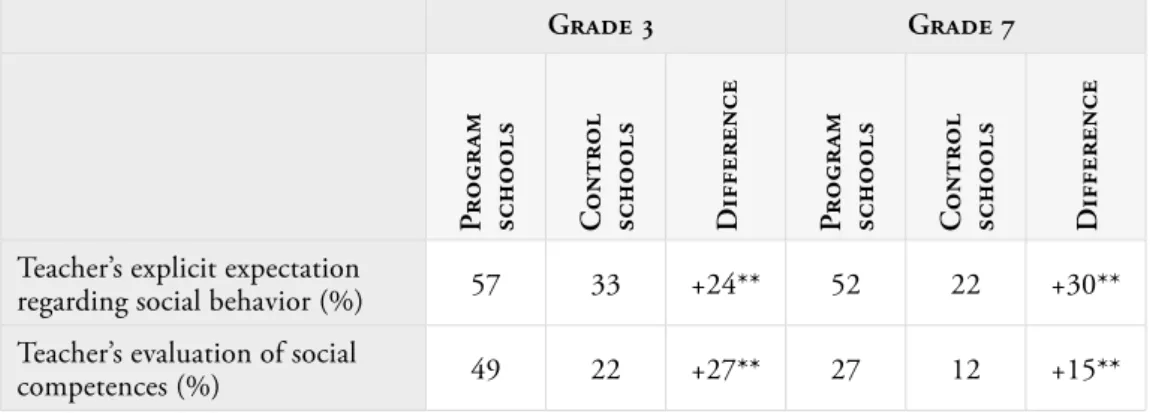
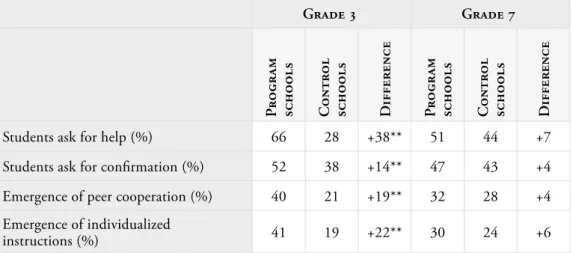
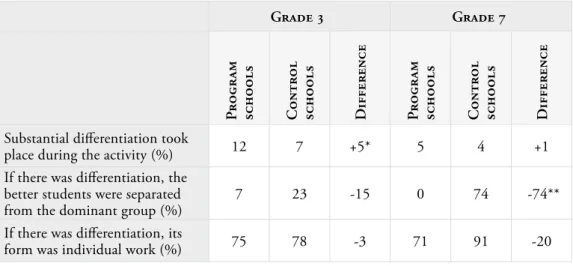
Based on hundreds of classroom observations, Chapter 4 looks at teachers, teaching methods, classroom management and interactions. No significant differences are found with respect to the teachers’ general competence. At the same time, program schools are more likely to engage in student-centered education. Student autonomy was found higher in the program schools, both in the lower and the upper grades. Group work receives significantly more emphasis in the program schools and, when applied, it is used much more in accordance with the principles of cooperative learning. Probably as a result, cooperative and collaborative relationship among students is more widespread in program schools. Differentiated education in the control schools is barely detectable, and, although more frequent, it is rare in the program schools as well.
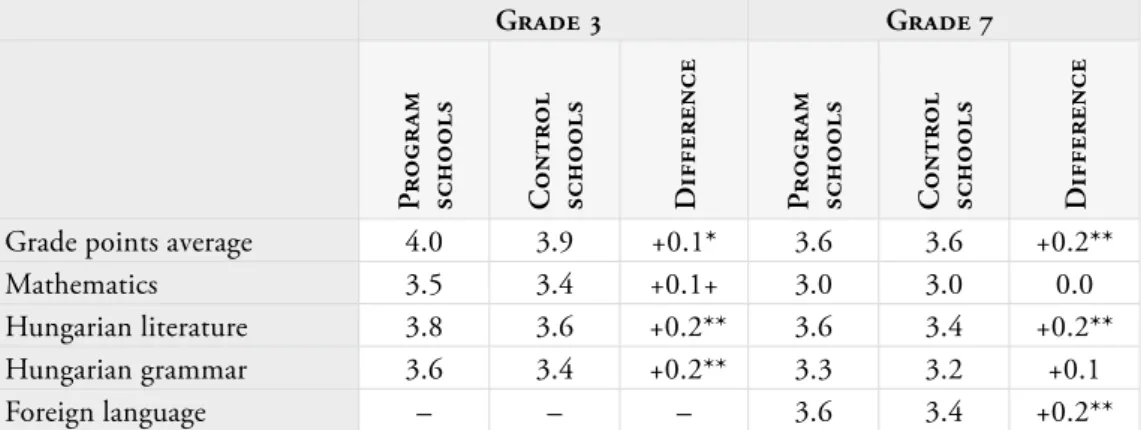
The following three chapters examine the differences in the students’ achievements. Chapter 5 focuses on school grades, cognitive achievements and the admission into secondary schools. We demonstrate that students of the program schools achieve somewhat better grades and better results on standardized reading comprehension test. The advantage of program schools is generally small, which, in light of the children’s skills development, is not surprising. Most importantly, however, we find no group with lower results in program schools. This is a powerful result: Program schools seem to achieve integrated education without hurting non-Roma and non-disadvantaged students’ skills development.
Chapter 6 examines the development of some personality traits that are called often non-cognitive skills in the economics and program evaluation literature. Our estimates show that students in program schools, especially Roma students, have a more interior locus of control, i.e. they are more likely to think that they themselves are responsible for their destiny as opposed to outside forces. Students of the program schools have more positive self-esteem, regardless of their family background. The results are similarly more favorable with respect to the ability to cope with difficult situations. It seems that all these results can be attributed to the program. Perhaps surprisingly, those non-cognitive skills are as important in a successful life as cognitive skills. Their labor market value is comparable, and they are important determinants
r o m a e d u c a t i o n f u n d 12
of success, or of avoiding failure, in many other areas of life. We also know that, to a much stronger extent than cognitive skills, these personality traits are malleable in the elementary school period. Therefore, it is an important result that the OOIH program has a positive impact on the development of non-cognitive skills, both among Roma and non-Roma, disadvantaged and non-disadvantaged.
In Chapter 7, we look at inter-ethnic relations: prejudice, social distance, as well as value judgments and anxiety that may operate in the background. We show that non-Roma students of program schools hold a smaller social distance from the Roma than non-Roma students in control schools. Roma students are much more accepting towards non-Roma both in program and control schools. Roma and non-Roma students show less social anxiety in program schools and are less likely to believe in social dominance.
In Chapter 8 we try to uncover the mechanisms behind the success of the program schools. Not surprisingly, identifying the mechanisms proves even harder than estimating the impact of the program. On the one hand, the complex nature of the program makes it practically impossible to separate the effects of different elements. On the other hand, the freedom of schools in choosing many elements of the program and the teachers’ inevitable freedom in choosing teaching and classroom management methods the possibility that prior student achievements lead teachers to adopt certain teaching methods. This phenomenon is an example of reverse causality, i.e. a relationship that runs the opposite direction than the mechanism we are after.
With all those caveats, our results indicate that cooperative techniques and observed cooperation help Roma and disadvantaged students, and when applied, differentiated education seem to help non-disadvantaged students. The most important result is that, regardless of the students’ family background, student-centered education and strong student autonomy seem to make a significant contribution to better results across all dimensions.
In the last chapter before the conclusions we look at the correlation between student achievements and the composition of the class. For several reasons, we expect that in general, a larger proportion of Roma and disadvantaged children is related to lower results in all dimensions, with the exception of inter-ethnic relations (where more contact is likely to decrease prejudice and social distance). Our question is whether the program broke this correlation when harmful and reinforced when helpful.
The results give clear support to the latter: the social distance kept by non-Roma students from the Roma continuously decreases as the proportion of Roma students increases, and the relationship is stronger in program schools. The picture is less clear in the other dimensions. In some cases the negative correlation between the fraction of Roma and student achievements (by both Roma and non-Roma) decreased, while in other cases, it did not. In those cases where the program did not break this correlation, program schools seem to have achieved significant results only in classes where Roma and disadvantaged students were a minority (below 25 per cent).
a S u c c e s s f u l S c h o o l in t e g r a t io n P r o g r a m 13
What do all these results imply? We believe that, despite its organizational problems, the program is successful. Students of program schools performed better in all dimensions. The improvement is not spectacular – one can say it is rather small in many dimensions – but it is present in all dimensions analyzed here. Even more importantly, we did not find any dimension in which the impact would be negative for any group, Roma or non-Roma, disadvantaged or non-disadvantaged.
The results support the arguments for integrated education. They imply that it is possible to promote the skills development of Roma and non-Roma students and reduce the social distance between them at the same time, in the framework of integrated education. Naturally, all this does not happen on its own. Elimination of majority-Roma classes is probably an important part of the success. But the key is likely to be in improved educational methods and classroom management. In short, they imply that integrated education can be successful if complemented with quality education.
r o m a e d u c a t i o n f u n d 14
a S u c c e s s f u l S c h o o l in t e g r a t io n P r o g r a m 15
B
aCkground
and
M
ethodology
2.1 The OOIH Program
The National Educational Integration Network (Hungarian acronym OOIH for Országos Oktatási Integrációs Hálózat) was founded by the Ministry of Education of Hungary in 2002, with the aim to promote integrated and quality education of disadvantaged and Roma children in elementary schools in Hungary. One of the major activities of OOIH was the design and management of a small and intensive program. This study focuses on that program.
Schools applied by responding to an open call in 2003, and, of the applicants, 45 schools were selected for the program. Application was clearly a result of self-selection. Participants were chosen by the OOIH itself based on potential success (not on a one-dimensional score). The program was launched in the fall of 2003, in the first and the fifth grades, with expansion to all grades one through eight in a grandfathered way. The 45 program schools we supposed to serve as examples for neighboring schools in order to make them join the network. For this reason, the Hungarian label of the program schools is “bazisiskola” (basis school). The program was designed by a small group of experts led by Judit Szőke, the first director of OOIH.
The substantive elements of the program are summarized in the Integrated Educational System (“Integrált Pedagógai Rendszer,” IPR henceforth).7 The design is based on the
premise that integrated education is an issue of school management and is inseparable from quality education for all children. Therefore, IPR goes beyond promoting educational methods; it also contains school management and classroom management elements. For program schools, some elements of the IPR have been compulsory, while other elements have been optional.
The IPR has become important outside the program itself. Starting 2005, each Hungarian elementary school has been eligible for additional support for each disadvantaged student if it adopted the IPR (again with some elements compulsory and others optional). The activities of the OOIH are thus not limited to the management of the examined program. However, the subject of this study is the impact assessment of the narrowly interpreted OOIH integration program covering the 45 program (“basis”) schools. This is what we call “the program” throughout the study.
7 See, e.g. http://www.sulinovadatbank.hu/index.php?akt_menu=1028, in Hungarian.
r o m a e d u c a t i o n f u n d 16
The program underwent major organizational changes. Originally financed by the Hungarian government, the program became part of those supported by the EU Structural Funds (in the Hungarian framework HEFOP 2.1) in its third year. According to anecdotal evidence, the transition was far from being smooth. Among other changes, program application was renewed, open to all elementary schools in Hungary. The set of successful applications in this second round overlapped with the original schools in large part but not entirely. Organization and management of the program also changed a few times. Even after those changes, the program proceeded to function unchanged in terms of its fundamental values, objectives and content-related elements.
For the evaluation study we choose a sample of 30 schools from the 35 (of the original 45) that had continuously participated in the program. This study focuses on children who were in their first and fifth grade in 2003-4. Due to administrative reasons, data collection could not start before the spring of 2005, more than one year after the program started. The first measurement took place when children in the first cohorts were in their second and sixth grade, respectively. Altogether, three waves of data collection took place, in the springs of 2005, 2006 and 2007. Data collection focused on the same students, following them to fourth and eighth grades, respectively. Hungarian elementary schools cover the first eight grades. From ninth grade on, students continue their studies in different types of secondary schools. The direction of further studies is an outcome variable we analyze for graduating eight-graders (see later for more details).
2.2 The Control Group
The primary focus of this evaluation is the effect of the OOIH program as it has been implemented. The effect of a program is captured by the results of its participants, compared to what they would have achieved had they not participated in the program. The results of the participants in the absence of the program are called counterfactual results. The main methodological problem of all evaluation studies lies in the fact that, of course, counterfactual results are not observed. All evaluations have to estimate the counterfactual results from somewhere else.
Evaluation studies measure the counterfactual results by observing the results of a control group. The effects of the program are then measured by some comparison of the results of the participants (also known as the treatment group) and the results of the control group. The assumption of such comparisons is that results of the control group are similar to the counterfactual results of the treatment group, at least on average. Obviously, selection of the control group is of key importance. The classic scientific method for selecting control groups is the randomized experiment. In a randomized experiment, treated and control status of the units (here schools) would be determined by a random rule. (Practically, any rule that is known to be unrelated to program results may qualify.) Unfortunately, randomized experiments are rare among social programs. The OOIH program was no exception: selection of treatment schools was not random at all. Instead, selection into the treatment group was based on self-selection into
a S u c c e s s f u l S c h o o l in t e g r a t io n P r o g r a m 17
applications and qualitative judgments by the administrators. As a result, the control group had to be chosen in some other way.
The treatment group of the evaluation study is a sample of the program schools that participated continuously in the program. The treatment sample consists of 30 schools. To each of these program schools we selected one control school that did not participate in the program but whose characteristics matched those of the program school in question. The entire sample, therefore, consists of 60 schools.
Control schools were selected by propensity score matching. The basic idea of propensity score matching is to find a control pair to each treated unit so that the two are similar in as many dimensions as possible that are relevant to the program under investigation. We used a set of pre-program variables, including information on ethnic composition from survey data,8 official school-level data on size, location, and ethnic minority education,9 and
family background and achievement score results of the spring 2003 national competence measurement covering sixth graders.10
All information used for the pairing reflects the situation and results before the program. The average values of the variables used for the propensity score are shown in table 2.1. Besides the averages for the treatment and the control group, table 2.1 shows national average values as well.11
8 Ilona Liskó–Gábor Havas Segregation in the Elementary School Education of Roma Students
(Szegregáció a roma tanulók általános iskolai oktatásában). Research Institute of Higher Educa-tion, Budapest, 2005. Online: http://www.hier.iif.hu/hu/kutatas_kozben.php.
9 Yearly data from KIR-STAT (http://www.kir.hu) and the number of students eligible for the Roma
minority educational support in year 1999, the only year when it was available.
10 http://www.sulinova.hu/cikk.php?sess=&alsite=27&rovat=31&alrovat=41&cid=103.
11 Besides the variables listed in the table, the geographical location of the schools was also taken
into account. The control schools had to be located in the same region as their base pair, and had to belong to the same type of settlement. From among the possible control schools that could be found in the same regions and of the same settlement type, we selected the most similar schools by the propensity score matching procedure. Following all this, we verified the selection with Gábor Havas, a sociologist with extensive local knowledge of Hungarian elementary schools with disadvantaged students. We asked his opinion about the closest school, and, when he raised seri-ous objections (e.g. by pointing to inflated or suppressed reports on minority students), we opted for the second or third closest control school (again taking Havas’s suggestions into account). It is the noisy and incomplete nature of our most important data sources that made this expert op-pinion valuable. We express our gratitude to Gábor Havas here for his extremely valuable help.
r o m a e d u c a t i o n f u n d 18
2.1 Table ‒ Composition of program and control schools on the basis of the data used for selection (1999, 2003)
Program
schools Control schools National average
Population in town/village of school 87,363 83,399 225,992 School size (number of students) 320 311 286 Fraction eligible for Roma minority support in
1999 (%) 31 26 5
Fraction of students at risk (%) 16 15 9
Fraction of students (%) with
Mother’s education less than 8 grades 9 7 2 Mother’s education exactly 8 grades 35 33 21 Father’s education less than 8 grades 3 5 1 Father’s education exactly 8 grades 26 25 14
No working parent 29 30 20
Number of books at home 0 to 50 29 26 12 Number of books at home approximately 50 16 15 12
Competence scores at school level, 6th grade, spring 2003
Mathematics: school average 456 446 500
Reading: school average 449 436 500
Mathematics: school standard deviation 88 88 87 Reading: school standard deviation 92 95 89
Program and control schools are very similar based on the size of the settlement, the size of the school, and also by the students’ family background. The fraction of Roma students, those with low-educated mothers and with few books at home is slightly higher in program schools than in control schools. At the same time, pre-program competence scores in mathematics and reading comprehension are slightly higher in program schools than in control schools, with very similar within-school inequality. The differences are small and statistically not significant, which validates the selection method (see more validation later).
a S u c c e s s f u l S c h o o l in t e g r a t io n P r o g r a m 19
While the matching is of good quality, the data of table 2.1, even if insignifi cantly in a statistical sense, raise the potential problem that the program schools, on average, may have achieved somewhat better results from their somewhat more disadvantaged students already before the program. If that is true, then, by making a simple comparison of the program schools and control schools, we may attribute to the program’s impact results that are in fact achieved by program schools but are not necessarily due to the program. When comparing students’ achievements, we shall address this potential problem.
Note that our data are not representative from a national point of view. Compared to the national average, the program and control schools in our sample are located in smaller settlements; they scored lower on average on the national competence tests both in mathematics and reading comprehension; and, perhaps most importantly, their students come are signifi cantly more likely to be Roma and come from disadvantaged families. Th is is a natural consequence of the program’s focus. Where possible, we compare all results to national averages.
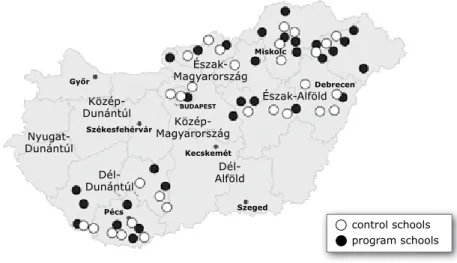
Th e geographic location of the schools is not representative either. Program and control schools are concentrated on the South-West, North-East and Mid-East of Hungary, as demonstrated in fi gure 2.1. Th ese are the Hungarian regions where the Roma are overrepresented.
Figure 2.1 ‒ Geographical location of the program and control schools
Within each school, we followed two cohorts of students: those in their second grade and those in their sixth grade in spring 2005, the time of the fi rst wave of data collection. Half
Nyugat-Dunántúl Közép-Dunántúl Közép-Magyarország Észak-Alföld Dél-Alföld Dél-Dunántúl Győr BudaPESt miskolc Észak-Magyarország Debrecen Szeged Pécs Székesfehérvár control schools program schools Kecskemét
r o m a e d u c a t i o n f u n d 20
of our sample consists of schools with one class per grade (classes are student groups of approximately 20 to 25 students). Students in larger elementary schools in Hungary are organized into rigid and permanent student classes: students assigned to a particular class stay with that class for the entire day, and class affiliation hardly changes through grade eight. In the large schools of our sample, we sampled two classes per grade. In the few schools with more than two classes per grade we selected the best and of the least good classes (on the basis of preliminary consultations with school headmasters). We followed all students within the selected classes.
2.3 Data Collection
The program was launched in the 2003-2004 school year with a focus on the student cohorts then in their first and fifth grades. For administrative reasons, our first data collection took place in the spring of 2005, while the last data collection had to be closed in 2007. We could follow students from second grade and sixth grade to the end of the fourth and eighth grade, respectively. The data collection took place in three waves. The first one in 2005 measured students’ skills and some other characteristics. The third data collection, in spring 2007, measured students’ results again (school achievements, cognitive and non-cognitive skills, inter-ethnic relations; see later for details). The two data points enable us to analyze year 2007 results by controlling for year 2005 results.
In addition to measuring the students’ results and views, we carried out several complementary surveys. We conducted interviews with the school headmasters in 2005 about participation in other programs and, in program schools, whether the school had operated in an integrated way before the program (half did, half did not). In spring 2006, students’ family background was measured by questionnaires to be completed at home. Also in the spring of 2006, we carried out standardized classroom observations in each school in each group in our sample, in two subjects (math and literature). Finally, after the 2007 skills measurement, we registered the students’ ethnic background (in full compliance with Hungarian data protection regulations, see later), and we collected information on the secondary school admissions of graduating eight-graders.
The analysis does not focus on students with special educational needs (SEN), for two practical reasons and a conceptual one. First, the tests we used were not designed for children with special educational needs; therefore, their use may have been problematic for SEN students. Second, there were very few SEN students in our sample (only 167 of the more than 4000, in comparison to more than one thousand Roma students). The conceptual reason is that the issues of integrated education of SEN students do not overlap entirely with the issues of integrated education of non-SEN students of ethnic minorities and disadvantages. The OOIH program did not put an explicit focus on SEN students. The details of the three waves of data collection are outlined next.
a S u c c e s s f u l S c h o o l in t e g r a t io n P r o g r a m 21 2.3.1 First wave
The first wave of data collection took place in the spring of 2005. We may call it input measurement of skills and other characteristics of the students. Ideally, input measurement would take place before or at the very beginning the start of the program. As we noted earlier, for administrative reasons, this particular measurement took place one year and a half into the program (the program started in the fall of 2003). As a result, results measured in 2005 may be in part attributable to the program itself. By looking at changes between 2007 and 2005, we restrict the focus to a two-year development. While many things may change in two years, we cannot expect a significant impact in such a short time period. In the first wave of data collection, each student (then second and sixth graders) had to fill in two questionnaires. One measured cognitive skills. Sixth-graders completed an inductive thinking test, second-graders a mathematical thinking test, both designed by Benő Csapó and his team from Szeged, Hungary.12 The other questionnaire contained
some basic demographic information, self-esteem, coping with difficult situations and some sociometrics. Besides these self-administered tests, schoolteachers (the “master teacher” of each class) filled out a short datasheet for each student.
The composition of the sample in the program and control schools is reported in table 2.2. The data presented here refer to measurements after the sampling procedure and thus provide an ex-post validation of the control group. The table shows variables that the program was unlikely to change. National comparisons are not available for the data presented here.
r o m a e d u c a t i o n f u n d 22
Table 2.2 ‒ Composition of program and control schools based on the data of the first data collection of the evaluation study
2ndgrade 6thgrade Program Control Program Control InformatIononstudents
Number of surveyed students 1032 983 1099 1081
Fraction of girls (%) 47 46 47 50
Fraction of overage students (%) 6 8 8 11 Fraction of disadvantaged students
(assessed by teacher, %) 51 46 44 42 Fraction of students at risk (assessed by teacher, %) 10 13 11 14 Fraction with behavioral problems
(assessed by teacher, %) 18 15 15 16 Fraction with studying problems
(assessed by teacher, %) 21 16 14 17 Fraction of SEN students (%) 7 7 5 4 Fraction of students with diagnosed deficits
(e.g. dyslexia, %) 16 6 5 7
Class-levelInformatIon
Number of classes 49 48 50 48
Class size 20.5 20.2 21.7 21.4
Fraction of Roma students (unweighted, %) 43 46 38 39 Fraction of Roma students (weighted by class size, %) 40 44 35 37
InformatIononsChoolteaChers Program Control Program Control
Fraction female (%) 98 94 85 84
Average age 44 42 44 42
Average tenure (years since in present school) 21 19 20 17 Education: teachers’ college for lower grades
(“tanitokepzo,” %) 77 79 4 4
Education: teachers’ college for upper grades
(“tanarkepzo,” %) 17 12 71 87
Education: teachers’ college MA degree (“egyetem,” %) 2 0 23 4
InformatIononsChools
Number of students in school 344 348 Number of teachers in school 34 34 Fraction of Roma students in school (%) 40 41 Fraction of Roma students in the neighborhood (%) 19 22 Fraction of students in school from outside district (%) 12 12 Fraction of students in district going to other school (%) 12 10
a S u c c e s s f u l S c h o o l in t e g r a t io n P r o g r a m 23
According to the evidence provided in the table, student composition in program and control schools is practically identical, both in terms of individual and class-level measures. This provides important ex-post validation of the sampling procedure. Similarity in student composition means that differences in the results of program versus control schools are very unlikely to be caused by differences in family background.
Teacher composition is also similar, but small differences emerge. Program school teachers are somewhat older and more experienced. With respect to the educational background, no significant differences are found among the teachers of lower grades, but upper grade teachers in the program schools are more educated. Almost one fourth of program school teachers in upper grades had a five-year university degree (sort of a master’s degree), while practically no teacher had such an education in the control schools. The rest of the school characteristics are very similar. These results imply that there may have been some quality differences between program and control schools even before the program. Such quality differences would imply that differences in the results of program versus control schools may have been present without the program. Self-selection of schools into the program also points to such an interpretation. When evaluating the differences in students’ results, therefore, we address the problem in more detail.
2.3.2 Second wave
The second stage of the data collection took place in the spring of 2006. Two measurements were taken: one of family background, and one of teaching practices and classroom dynamics. Family background information was collected by questionnaires filled out by the student and her/his family at home. The questionnaire was based on the family background questionnaire national competence measurement in 2006, with some extra questions added. Table 2.3 shows summary statistics for some variables for both the program and the control schools, along with the corresponding national averages. Note that the national competence measurement of 2006 took place in spring 2006 as well, around the time of our measures. While our measures covered grade 3 and 7 students, the national competence measurement covered grade 4 and 8 students. Comparison of program and control schools serves as our second ex-post validation of the matched sample. Comparisons to national averages reveal the differences of students in the focus of the program to the average Hungarian student.
r o m a e d u c a t i o n f u n d 24
Table 2.3 ‒ Students’ family background in the second wave; data from the national competence measurement of 2006 in comparison
Grade 3 Grade 7
Program Control National Program Control National
Number of students
with information 810 909 91,349 757 897 92,588 Fraction girls (%) 47 48 50 49 50 49 Welfare eligible (%) 37 37 19 31 35 20 Eligible for free meal in
school (%) 59 60 28 10 8 4
Eligible for free school
books (%) 73 83 57 66 78 52
Average family size 4.9 5.0 4.5 4.7 4.8 4.4 Fraction with father in
family (%) 78 76 83 76 73 79
Mother uneducated
(8 grades or less, %) 43 43 21 40 40 19 Father uneducated
(8 grades or less, %) 35 35 16 32 29 13 Fraction with working
mother (%) 41 42 66 52 51 73
Fraction with working
father (%) 64 64 84 69 65 80
Avg. size of apartment
(sqmeter/capita) 19.0 19.0 n.a. 20.8 20.5 n.a. Average monthly
spending (HUF ‘000) 109 110 n.a. 120 115 n.a. Fraction who think
poor (%) 38 38 17 29 29 14
Fraction who were
not on holiday (%) 41 41 21 28 31 18 Fraction without
a car (%) 46 48 27 44 43 27
0 to 50 books
at home (%) 35 35 16 29 27 12
Note. National results refer to grade4 and grade 8.
Response rate to the family background questionnaire is 85 per cent in grade 3 and 75 per cent in grade 7. Response rates are somewhat lower in program schools than in control schools. Sample size in the program and the control schools is less than a thousand students per grade each, while the national competence measurement data refer to over 90 thousand students per grade. Comparing students of program schools to students of control schools reinforces our previous findings: the composition of students by family background is very
a S u c c e s s f u l S c h o o l in t e g r a t io n P r o g r a m 25
similar. Also in accordance with our previous findings, we see that families of students in program and control schools are significantly poorer than the national average, and their parents are significantly less educated and are significantly less likely to be employed. Teaching practices and classroom dynamics was measured with the help of structured classroom observations. The questionnaire focused on objective measures (physical environment, structure of class, types of activities etc.) as well as more subjective assessments (student cooperation, autonomy, respect, etc.). The observations were taken in two classes in each student group, one in mathematics and one in Hungarian literature. Each observation was carried out by two observers. Typical classroom observers were upper year psychology majors or students of teacher training colleges. They participated in intensive two-day training sessions including video training and trial observations.13
We considered classroom observations to be collaborative processes in which the observed teachers and the observers both had their role before, during and after the observation. Therefore, the observations were preceded and also followed by discussions with the teachers. The primary goal of the first discussion before was clarifying the roles and reducing tensions. The observers informed the teachers about the goals and aspects of the monitoring, answered the teachers’ questions, and received some information about the “history” of the class. The goal of the second interviews was to provide feedback. The observers, where possible, took a back or side seat at a distance from the students and the teacher as well. Observed classes are not representative of average classes. The presence of the observers results in inevitable changes. Teachers were notified about the observation well in advance. They had time for preparing for the observed classes more thoroughly than usual, and they were likely to have done so. Aside from being better prepared, teachers are likely to have tried to make their and the students’ best. Even with these biases, though, classroom observations are suitable for our purposes. Our main question is not about the level of the observed phenomena but the differences between program and control schools. While all measures may be biased, the comparisons of major interest may not be biased much if the behavioral distortions are similar in program and control schools. Moreover, observed classes were better (or simply different) in ways that were important for the teachers. Therefore, classroom observations can provide a good picture of the teacher’s educational principles and the methods that she considered to be good.
More importantly, many things are difficult to change (e.g. contact with students, speed of speech, spontaneous reactions), in which distortions are probably small. The students’ behavior is also less likely to be affected by classroom observations, partly due to the lower awareness (because of the positioning of the observers), and partly due to the lower incentives to change their behavior. Students’ behavior, therefore, can be closer to
13 Léna Szilvási and Katalin Medvecki video trainers provided excellent assistance both in the design
r o m a e d u c a t i o n f u n d 26
the representative classroom behavior, perhaps with the exception of extreme forms of behavior. When assessing the results of classroom observations, we take all these aspects into consideration.
From among the 197 classes participating in the research, classroom observation took place in 189, from 201 student groups (a few schools divided classes into smaller groups). Altogether 366 classes were evaluated, most but not all by two observers, resulting in 684 questionnaires filled out properly. Results of the classroom observations are described in Chapter 4. 2.3.3 Third wave
The third wave of data collection took place in the spring of 2007. This was the outcome measurement of the evaluation study. We assessed the cognitive and non-cognitive skills of children who participated in the research. Measurement was carried out with the help of two questionnaires: a cognitive and a non-cognitive test. The tests will be discussed in detail in the following chapters together with the results. Cognitive skills were again measured using tests developed by Benő Csapó and his colleagues (see above), this time with a focus on reading comprehension. The second questionnaire contained the rest of the outcome variables: self esteem, locus of control, coping, ethnic stereotypes, social distance, etc. Besides the two questionnaires, we collected information on the children’s ethnic background (using the parental assessments, see later), and, on the eight-graders, we collected data about thir admissions to secondary schools.
2.3.4 Connecting individual data
During the three years of research, we carried out several separate surveys on the same students. In order to comply with requirements of data anonymity, students’ names were not mentioned on any of the questionnaires. Instead, the students were identified by their number in the class roster, which ensured a smooth matching of questionnaires within the same year. Matching questionnaires across years was made possible by matching the class rosters across grades.
2.4 Validation and Standardization of the Tests
Students’ results were measured by self-administered questionnaires (under appropriate supervision). Whether those tests measure what they are supposed to measure is an important and non-trivial question. Another question is the interpretation of the results: what to make of the magnitude of the estimated differences. The first question is one of validity, while the second question is one of standardization.
a S u c c e s s f u l S c h o o l in t e g r a t io n P r o g r a m 27
As we mentioned before, our cognitive tests (inductive thinking in sixth grade, mathematical thinking in second grade, and reading comprehension test in fourth and eighth grades) were developed, validated and standardized by the research group led by Benő Csapó.14 The other
tests on non-cognitive skills and inter-ethnic relations were developed and standardized by ourselves. All were adaptations of standard international tests. Measurement of so many dimensions was possible by using short versions of the tests. Reduction was guided by theory and by maximizing internal validity. We discuss each test when we present their results, in the subsequent chapters.
We standardized all non-cognitive tests on national representative samples of elementary school students for both the fourth and the eighth grades. Besides means, standard deviations were standardized in order to achieve interpretable units of measurement. One unit of difference between two students (or two groups of students) will mean one national standard deviation, i. e. the expected difference between two randomly selected students.
2.5 Disadvantaged and Roma Students
Disadvantaged students were the program’s explicit target group. In theory, disadvantage covers family circumstances which in themselves seriously impede children’s development. Chronic poverty, social exclusion, unstable family structure as well as deviant parental behavior may all contribute to disadvantage. Disadvantage is therefore a complex notion. Social sciences and social policy attempt to define disadvantage with proxy variables that are relatively easy to measure. The proxies in use often deviate from each other. At the time of the evaluation study, Hungarian educational policy defined disadvantage by welfare eligibility as assessed by the municipality, complemented with some family characteristics. Severe disadvantage was defined as welfare eligibility coupled with uneducated parents (eight grades or less). The definitions changed many times in the past. Our data allows for simultaneous measurement of various definitions. It also contains the schoolteachers’ direct assessment of disadvantaged status. Perhaps not surprisingly, the groups of students identified by the various measures are quite different.
In this study we define disadvantage by the parents’ education. Parental education is a strong proxy of permanent income in modern economies, with very low education predicting long-term poverty and poor home environment. At the same time, it is a relatively simple and clear measure. This is the reason why parents’ (primarily mothers’) educational level is often used in international comparisons.15
14 http://www.edu.u-szeged.hu/mtakcs/.
15 See, e.g. Micklewright, J.–Schnepf, S. V. (2004): Educational achievement in English-speaking
countries. Do different surveys tell the same stories? IZA Discussion Paper, No. 1186. http://ftp. iza.org/dp1186.pdf.
r o m a e d u c a t i o n f u n d 28
We define disadvantaged children to be those both of whose parents have 8 grades of education or less. There is a bit of a controversy in Hungary as to whether three-year vocational training schools (of grades 9 to 11) qualify for secondary education.16 Although there are powerful
arguments against vocational education to be considered a “real” secondary a degree (those with vocational training degree are in many respects more similar 8-grade-educated),17 we
restricted disadvantage status to parents without even such a degree.
According to this definition, 35 per cent of the students in our sample are disadvantaged. The schools considered two thirds of these to be disadvantaged when asked directly, while half of the students they labeled as disadvantaged had at least one parent more educated than eight grades. If vocational training degrees were included into the disadvantaged definition, the extent of the mismatch remained similar with opposite magnitudes. Even the more complex definitions, including those closer to regulations, did not result in a larger overlap with schools’ direct assessment of disadvantage.
Roma students are not explicitly targeted by the program. It may seem therefore as if the program took a position with respect to ethnic targeting and opted for a color-blind policy. At the same time, many of the program’s elements explicitly target ethnicity (minority culture) or ethnic conflicts and prejudices. This provides a reason for measuring the impact of the program also separately for Roma and non-Roma students.
Two other reasons led us to look at the program’s impact by ethnicity. One reason was that in Hungary integrated education is usually understood as integration by ethnicity. Therefore, independent of the program’s objectives, it is of great political interest to assess the development and beliefs of Roma and non-Roma students separately. The second reason is based on a more general principle. The dismal labor market situation of the Roma minority is one of the most serious problems in contemporary Hungary. There are therefore powerful arguments in favor of measuring the impact of practically all policy interventions on the Roma minority, whether the policy itself is color-blind or not.18
However important, measuring ethnicity is somewhat difficult in Hungary. Similarly to most countries with a sizeable Roma minority, Hungarian regulation prohibits the collection of information on ethnicity without the knowledge and documented consent of the individuals involved. As a result, ethnicity is not part of any administrative record. In principle, aggregated data can be collected along ethnic lines, but data providers (including governmental statistical agencies) opt for the safer choice and collect no data by ethnicity at all.
16 The Hungarian Census of 2001 does not consider vocational training schools as secondary schools,
see http://www.nepszamlalas.hu/hun/egyeb/eurostat/tables/tabhun/load1_10.html.
17 See, e.g. Gábor Kertesi and Júlia Varga, “Employment and Educational Attainment in Hungary”,
and Gábor Kezdi, “Education and Earnings.” Both in: K. Fazekas and J. Varga (eds.), The Hun-garian Labour Market 2005. In Focus: Education and the Labour Market, Institute of Economics, Budapest, 2005. http://econ.core.hu/doc/mt/2005/en/infocus.pdf.
18 Glenn Loury puts forward a similar argument in his book (Glenn C. Loury: The Anatomy of Racial
a S u c c e s s f u l S c h o o l in t e g r a t io n P r o g r a m 29
Our research took the measurement of ethnicity seriously. Fully complying with the regulations (Act LXIII of 1992 on personal data protection plus the recommendations of the data protection ombudsperson), we were able to identify the ethnicity of schoolchildren in a satisfactory way. We sent out a letter to the parents of all students in the sample. The letter asked them to provide a statement declaring the national and ethnic belonging of the student, and we explicitly asked for their consent for the information to be used in the research in an anonymous way. Importantly, we allowed for multiple ethnicity. The parents had an opportunity to provide the following answers:
My child is
» Hungarian, non-Roma
» Hungarian, Roma
» Hungarian, partially Roma
» not Hungarian, Roma
» Romanian
» Slovak
» Other
Based on the statements that were sent back to us, we considered all students to be Roma if the parents selected from the answers b, c or d. The first row of table 2.4 contains the proportion of Roma students defined this way from among those who submitted valid statements. The next row in the table contains teachers’ estimates as to the proportion of Roma students. This latter information was taken from the interviews made before the classroom observations (the estimate is the average two estimates by class if the assessments of the two teachers were different, and the numbers shown in the table are weighted estimates of the class-level figures). The last row of table 2.4 shows the proportion of students whose parents did not submit statements.
Table 2.4 ‒ Fraction of Roma students. Individual statements by the parents versus the class-level estimates by the teachers
Grade 4 Grade 8
Program Control Program Control Fraction of Roma students (%)
From individual statements by the parents 35 35 27 29 From class-level estimates of teachers
(weighted by class size) 34 36 27 33 Missing individual statements from
r o m a e d u c a t i o n f u n d 30
Twenty-seven per cent of the statements were not returned. But those who did return the statements gave the same ethnic identity as the schoolteachers. The proportion of Roma students measured from the parents’ statements and the teachers’ estimates are virtually identical except for a small discrepancy in control schools in grade 8. This means two things. On the one hand, the proportion of Roma and non-Roma parents among those who did not respond was the same. On the other hand, and this is the more important conclusion, there is no significant difference between ethnicity as stated by the parents and by the teachers. The figures calculated in the two different ways are very close to each other not only in total, but also by class. All this means that parents’ statements measure the same Roma identity that would have been measured on the basis of the teachers’ estimates. Recall that the parents’ statements are in full compliance to the regulations.19
Not surprisingly, the joint distribution disadvantage (defined by low-educated parents) and ethnicity (defined by the parents’ statements) show a close relationship. Two-thirds of the Roma students in the examined schools are disadvantaged, while somewhat less than two-thirds of disadvantaged students are Roma in the sample.
2.6 Identifying the Impact of the Program
As defined above, a program’s impacts are the results of the program school students compared to what their results they would have been if they had not participated in the program. In the matched sample of this study, a control school is assigned to each program school in order to measure those counterfactual results. When measuring the program’s impact, the starting point is the average difference of the results of program students compared the results of the control students. These simple comparisons are unbiased estimates of the impacts of the program if the matching is perfect in the sense that the results of control students, on average, equal to the results program students would achieved without the program.
Because of the nonexperimental design of this evaluation study, nothing guarantees that the control group is appropriate. Tables 2.1 to 2.3 demonstrate that the student composition is virtually the same in program and control schools but program schools may have better
19 Census data in Hungary and neighboring countries systematically underestimate the proportion of
the Roma population. According to the 2001 census, the number of the Roma population in Hun-gary is 190,046 persons (1.86 per cent of the total population). Based on the results of the most recent sociological research, the population of individuals identified as Roma by their environ-ment is estimated at 600 thousand, 6 per cent of the total population (see, e.g., István Kemény –Béla Janky–Gabriella Lengyel: “The Gypsy Population of Hungary” (A magyarországi cigányság), 1971–2003. Gondolat Publisher, Budapest, 2004). The contradiction is usually explained by the assumption that a large number of Roma “deny” or “hide” their Roma ethnicity in order to avoid stigma. Our results, on the other hand, indicate that the problem of the census is due in large part to double identity. See also Béla Janky–István Kemény: On the Gypsy Ethnicity Related Data (A cigány nemzetiségi adatokról). Minority research, 2003/2, 309–315. Online: http://www.hhrf. org/kisebbsegkutatas/kk_2003_02/cikk.php?id=747.