Improving ITIL Process with a Lean methodology
André Filipe Moreirinha Lino, nº 53834
Dissertação para obtenção do Grau de Mestre em
Engenharia Informática e de Computadores
Júri
Presidente:
Orientador: Professor Doutor Miguel Leitão Bignolas Mira da Silva
Vogal:
i
Acknowledgements
As I look back over the last 23 years of my life, I realize that there are several key individuals whom I owe a great deal, as I truly believe that I would not be here without their constant support.
I would like to express my gratitude to my supervisor, Prof. Dr. Miguel Mira da Silva who always helped me over the last year. I would like to thank to everyone from all the organizations that supported and made this Thesis possible. I would also like to thank to all my colleges for listening to my ideas and for always being there when I needed them.
For the last, but not for the least I need to thank to my family. Without their constant support, love, patience and encouragement I would never have finished this thesis.
ii
Abstract
Many companies around the world have already implemented ITIL as a way to manage and control their IT Departments more effectively. These companies are now willing to improve their ITIL processes in order to become even more efficient. Lean is a methodology that can be used to conduct these improvements and its application in the IT Services is becoming increasingly popular. The initiatives taken to improve ITIL processes using Lean have some limitations as they do not address all Lean’s principles and goals. Using an Action Research methodology, we propose a framework that addresses all the principles and goals and that can be used to improve ITIL processes. The framework was applied in a Portuguese Public Organization, with the aim of improving the ITIL v3 Incident Management Process. The results are discussed, demonstrating the framework’s effectiveness.
Keywords
iii
Table of Contents
ACKNOWLEDGEMENTS ... I
ABSTRACT ... II
KEYWORDS ... II
TABLE OF CONTENTS ... III
LIST OF TABLES ... V
LIST OF FIGURES ... VI
ACRONYMS AND ABBREVIATIONS ... VII
1.
INTRODUCTION ... 1
2.
PROBLEM ... 3
3.
RELATED WORK ... 5
3.1. Lean based methodologies ... 5
3.1.1. Fujitsu – Sense and Respond ... 5
3.1.1.1. Critical Analysis ... 6
3.1.2. Lean Six Sigma in IT help-desk service ... 7
3.1.2.1. Critical Analysis ... 8
3.2. Lean & ITIL together ... 10
3.2.1. Lean Six Sigma and ITIL by ISQ... 10
3.2.1.1. Critical Analysis ... 11
3.2.2. Lean and ITIL v3 Event Management Process... 12
3.2.2.1. Critical Analysis ... 13
4.
PROPOSAL ... 15
5.
IMPLEMENTATION ... 16
5.2. Action Research – The 1st Iteration ... 17
5.2.1. Diagnosing ... 17
5.2.2. Action Planning ... 17
5.2.3. Action Taking ... 25
5.2.4. Evaluating ... 37
5.2.5. Specify Learning ... 39
5.3. Action Research – The 2st Iteration ... 39
5.3.1. Diagnosing ... 39
5.3.2. Action Planning ... 39
5.3.3. Action Taking ... 41
iv
5.3.5. Specify Learning ... 45
6.
CONCLUSION ... 46
6.1. Future Work ... 46
v
List of Tables
Table 1: Fujitsu Services - Sense and Respond analysis ... 6
Table 2: Lean Six Sigma methodology analysis ... 8
Table 3: ITIL & Lean Six Sigma methodology by ISQ... 11
Table 4: Identified problems and established goals for Event Management improvement ... 13
Table 5: Lean principles and goals identified in the Event Management improvement initiative ... 13
Table 6: Problem Analysis activities ... 18
Table 7: Solution Definition activities ... 21
Table 8: Solution Implementation activities ... 22
Table 9: Check activities ... 22
Table 10: Act activities ... 24
Table 11: Lean ITIL Framework v1 evaluation ... 37
Table 12: Framework v2 - Initial Planning phases ... 40
vi
List of Figures
Figure 1: Thesis purpose ... 15
Figure 2: Action Research cycle ... 16
Figure 3: IT Department Structure ... 17
Figure 4: Framework phase's diagram ... 18
Figure 5: Kano's model for customer satisfaction. Source: [23] ... 25
Figure 6: Activities Diagram perceived for the Incident Management Process in the organization ... 26
Figure 7: Activities Diagram for the ITIL v3 Incident Management Process ... 32
Figure 8: Possible to-be Activities Diagram defined for the Incident Management Process ... 33
Figure 9: Fishbone Diagram used to analyze the issue of non-logging all the incidents ... 33
Figure 10: Telephone used in the Service desk ... 34
Figure 11: Total number of logged incidents per month ... 36
Figure 12: Lines of support and their structure ... 37
Figure 13: Framework v2 phase’s diagram ... 40
Figure 14: Possible to-be Activities Diagram defined for the Incident Management Process ... 43
vii
Acronyms and Abbreviations
DMADV
Define, Measure, Analyze, Define, Verify
DMAIC
Define, Measure, Analyze, Improve, Control
ICOV
Identify, Characterize, Optimize, Verify
ISQ
Instituto de Soldadura e Qualidade
IT
Information Technology
ITIL
Information Technology Infrastructure Library
NVA
Non Value Adding
USD
United States Dollars
VA
Value Adding
1
1.
Introduction
ITIL is a framework of best practices for delivering IT Services. It was developed by the British Government during the 1980s trying to increase efficiency, value for money in commercial activities and improve success in the delivery of programs and projects in the public sector. It is not a proprietary framework so even though it was developed by the government, all the private companies are able to use it. Over the years, ITIL’s credibility and popularity became recognized, until now its practices have contributed to and are aligned with the ISO 20000 Service Management standard, the first international standard for IT service management [2].
Nowadays, ITIL’s best practices are very popular around the world and a significant number of companies are at least considering its adoption. There are several distinct reasons for this. In some cases companies are aware of ITIL’s benefits and want to implement it to guarantee better quality of service, lower costs or better alignment between business and IT [1]. In some other cases companies are influenced by this ITIL fever and want to implement it just because it seems that everyone else is doing it. In fact, IT Managers are getting an increasing pressure to deliver better results from their departments and sometimes they see ITIL as the solution for all their problems. As a consequence of this pressure and the increasing value of IT for the companies businesses, the desire for ITIL’s adoption has arisen and spreaded [6]. But the truth is that adopting this set of best practices is not easy and without proper planning and execution it is most likely that the implementation will be a failure [12].
While ITIL has been developed for managing IT Services, Lean is a business system for organizing and managing product development, operations, suppliers and customer relations. It was developed in Japan and has its origin in the Toyota Production System. After World War II, and as a result of the very limited human, financial and material resources, Toyota had to use Lean principles to be able to produce a wide variety of products at lower prices and with fewer defects than its competitors.
The Lean principles can be summarized as the following [30]:
Specify Value – Realize what the costumer really wants and is willing to pay for.
Identify all the steps in the Value Stream – Map all the activities into paper, this way it will be easier to identify wastes in the process flow.
Introduce continuous flow – Eliminate non-value-adding activities and idle times between them as much as possible.
Allow customers to pull value from the upstream activity – Produce what the costumers want allowing them to pull the products and to define the rate at which the products should be delivered.
Pursue perfection – All the activities and processes should be perfect. There’s always waste to eliminate and ways to do things better.
Following these principles is the way to achieve the four golden goals described in the Lean methodology: better quality, quickness, more flexible response and more value to the costumer [3]. Although it was originally developed to be used in a manufacturing environment, it has also been used in the services area,
2
mainly in Healthcare services [13]. Its use in the IT services is not a common practice yet, but there are already some success stories about its application in Service Desks.
From a very simplified and high level perspective, Lean can be seen as a methodology to allow process improvement and optimization. One of the ITIL’s v3 goals is to continuously improve IT processes, making them more effective and efficient. The catch here is that ITIL documentation does not provide a clear and specific roadmap to do it. There are only some clues and generic advices in the ITIL v3 books. CIOs who want to improve the ITIL processes of their departments do not have a roadmap to guide them. This is where Lean can assume a very important role, being used as the methodology to enable the processes improvement [8]. In the current crisis panorama, where the worldwide IT spending growth is expected to slow significantly [21], it makes even more sense to apply Lean as one of its most visible results is operational costs reduction.
The proposal of this thesis is then to develop a generic framework, which addresses all the Lean principles, and that provides guidance to ITIL’s processes optimization.
The used research methodology is Action Research as it is extremely important to develop and evaluate this framework in a real environment [20]. Two iterations of the Action Research cycle are performed in the IT Department of a Portuguese organization. The achieved results will be presented and discussed.
3
2.
Problem
Many companies have already implemented some ITIL processes in order to enhance better results from their IT departments. The benefits are usually high but as ITIL v3 states, it is important to keep improving the processes always aiming to provide IT Services with higher quality and efficiency [14]. The problem is that often managers do not know how to further improve their IT Departments. First of all it is hard to understand what can be improved in each process and secondly, it is hard to know how to improve it.
ITIL books define which processes should be present, how they should interact with each other and which metrics can be used. They also define which steps are relevant for the Continual Service Improvement process in the 7-Step Improvement Process:
Define what you should measure Define what you can measure Gathering the data
Processing the data Analyzing the data
Presenting and using the information Implementing corrective action
These steps are no more than a very high level strategy to process improvement. While explaining in more detail each one of these steps, there are no references to tools or procedures that can be used. Only a few clues are provided about where to find data and a small list of questions that one should try to answer in each step. The information provided by ITIL’s documentation is not detailed enough to establish a roadmap to improve a process.
Nowadays, IT Departments can no longer be an isolated silo in the organization. They must be completely aligned with business in order not only to support it, but also to improve it. Still, business is not static, and it needs to be adapted as a response to market needs or to exploit a business opportunity that has arised. As business is not static, IT Services can’t be static either. This is another important motivation for IT Departments to continuously improve their processes [7]. But once again, it is hard to define a roadmap for improvement as ITIL does not provide a set of tools to do so and as very often CIOs aren’t able to see the true links between IT and Business [9].
Even when CIOs know how to effectively analyze their IT processes performance and know which changes need to be introduced, in many situations, it is not easy to implement them. In fact, the amount of changes can be extremely high and according to Laudon’s framework [4] they can be organized as following:
Organizational changes
o New organizational structure for the department o New skills demanded for the employees
o New activities and processes
o Different way to perform old activities
o New perspectives of how IT supports and enables Business Managing changes
4 o New SLAs
o Higher expectations for this department and his services Technological changes
o New software o New hardware
The technological changes should not be too hard to implement as IT staff is usually highly trained in this area, but the organizational and managing changes represent a big challenge due to people’s intrinsic resistance to change [7]. It is important to understand how this resistance can be mitigated, assuring that a process can effectively be improved and that once it was, there is no coming back. But once again, ITIL does not address these topics, providing little guidance to IT managers.
In the current panorama, only experienced consulting firms can effectively assist organizations in ITIL deployment and process improvement [7].
The identified problem can then be summarized in the following sentence:
Even after implementing ITIL, IT Departments still need to continuously improve their processes but they do not know how.
5
3.
Related Work
Since this thesis is about improving ITIL processes using a Lean methodology, it’s important to understand how Lean has been applied in IT Departments lately. These issues will be addressed in the following sections.
3.1.
Lean based methodologies
Over the last few years, Lean also been applied in the Services area. The main objectives are the same as in the manufacturing: to have more flexible processes, eliminating wasteful activities and enabling the delivery of a more valuable service. IT Service providers are no exception. The number of initiatives of this kind is still low, but there are already some success stories. Fujitsu, an IT service provider, has developed a Lean based methodology to improve their business and some IT Departments have also tried this approach. In both cases, the results were very positive, encouraging further research about this subject. The purpose of the next topics is to have a more detailed look into these approaches.
3.1.1. Fujitsu – Sense and Respond
Fujitsu is a multinational company, providing IT services to more than four hundred clients in the areas of financial services, telecommunications, utilities and government markets. They were facing some problems, from which the following were the most relevant:
Some clients were not satisfied and were looking for another service supplier.
There was the constant need to acquire new clients to replace the ones that were leaving The Call Center Service provided to their clients was performing at a very low level.
Trying to solve all this problems, they decided to develop a Lean based methodology which should then be applied in their Call Center Service [10]. The objectives were simple: to provide a better service, increasing its direct and indirect customer’s satisfaction. The Methodology was named Sense and Respond and had four distinct phases:
Phase 1 – Learning to Sense
o View the organization from a customer perspective
o Evaluate value chain measurement horizontally and vertically o Understand front-line roles and responsibilities
Phase 2 – Learning to Respond o Re-educate management
o Introduce the Pull theory of management
o Replace Make and Sell mass production theories with Sense and Respond theories that incorporate Systems Thinking and Lean Production
Phase 3 – Leading Change
o Utilize transformation leadership theories o Employ cognitive behavior methodology
6 o Operate within a leadership and coaching framework
o Award staff managers with accreditations Phase 4 – Mobilizing
o Provide detailed change programmes to transform the corporate infrastructure o Design domestic and international plans for mobilization
This methodology brought very positive results to Fujitsu’s Service: First-contact fix increased by 64%
End-to-end service cycle reduced by 60% End-to-end service costs decreased by 30% Customer satisfaction increased by 28% Employee satisfaction increased by 40%
3.1.1.1. Critical Analysis
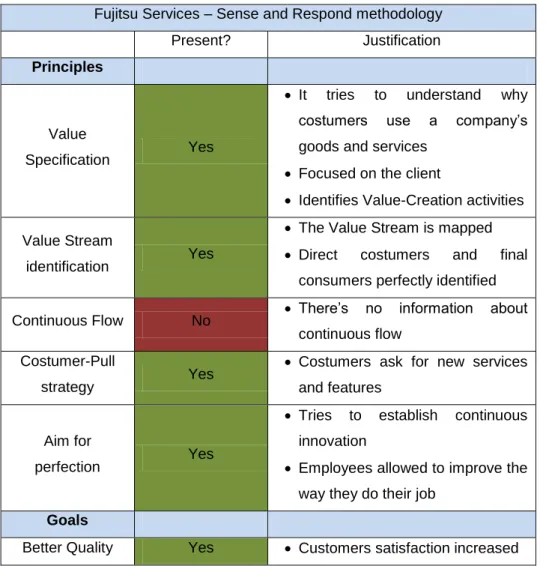
More than analyzing the obtained results, which are clearly positive, it is important to analyze the methodology itself. In order to do so it is important to understand which Lean principles and goals could be identified. The next table will be used in every analysis of this kind and will be very useful to compare the distinct approaches.
Table 1: Fujitsu Services - Sense and Respond analysis
Fujitsu Services – Sense and Respond methodology
Present? Justification
Principles
Value
Specification Yes
It tries to understand why costumers use a company’s goods and services
Focused on the client
Identifies Value-Creation activities Value Stream
identification Yes
The Value Stream is mapped Direct costumers and final
consumers perfectly identified Continuous Flow No There’s no information about
continuous flow Costumer-Pull
strategy Yes
Costumers ask for new services and features
Aim for
perfection Yes
Tries to establish continuous innovation
Employees allowed to improve the way they do their job
Goals
7
Quickness Yes End-to.end service cycle
decreased
More flexibility Yes
Flatter organization
Easier to adapt to costumers requirements
More value to the
costumer Yes
Costumer success becomes a goal
By looking at the table it’s possible to realize that this methodology is heavily based on Lean. Most of the principles could be identified and the goals were achieved in its first application. Despite its enormous potential, some problems and limitations were still identified:
Every time that this methodology is used in a new service, an entire set of metrics and indicators has to be designed. This metrics are not based in any standards and may not be the best.
There is not a base architecture to be suggested to the organizations/departments where this methodology is applied. Therefore, it may take some time to identify the best structure.
Anyone who wants to apply this methodology has to be highly experienced in the targeted services area to be able to define the metrics and structure to use.
3.1.2. Lean Six Sigma in IT help-desk service
In this second approach it is described and analyzed the development and application of a Lean Six Sigma methodology in an IT help-desk service [11]. First of all it is important to understand what Six Sigma is. Like Lean, it is a business management strategy and it seeks to identify and remove the causes of defects in manufacturing and business processes [19]. It uses a set of quality management methods, including statistical methods and has two key methodologies: DMAIC and DMADV. Lean and Six Sigma can be used together and the Lean Six Sigma methodology has been developed with that purpose. After this brief description it is now possible to analyze the work developed in the University of National Chiao Tung University, in Taiwan, where the idea of developing a Lean Six Sigma methodology to improve service-quality arised.
The methodology has five phases, each one with several steps which are summarized in the following topics:
Phase 1 – Identify/Define value o Draft a project charter
o Identify the Voice of the Costumer (VOC)
o Categorize and translate the VOC into measurable requirements o Identify critical-to-quality characteristics
Phase 2 – Measure/Define value stream map o Gather data
o Build a current state value stream map o Build a future state stream map o Develop a detailed process map
8 o Define levels of service based on CTQ
Phase 3 – Determine root causations o Data and diagram analysis
o Identify root cause of non-value added steps o Determine significant root causes
Phase 4 – Improve flow and pull strategy o Eliminate significant root causes o Develop a pull system
Phase 5 – Control/ Pursue perfection o Develop a control plan o Implement the control plan
This methodology was used in an IT help-desk of a multinational company, based in Taiwan. The motivation for its use came when the company realized that they had several problems in their IT Department:
They had a slow IT service processing time
o It had impact on employees work efficiency o It had impact in costumer relationship
o They were receiving several complaints from employees and costumers There was a lack of standards in the IT department
After applying the methodology, the results were quite positive: Savings around USD 120.000.
A reduction of 47.5% in services processing time.
3.1.2.1. Critical Analysis
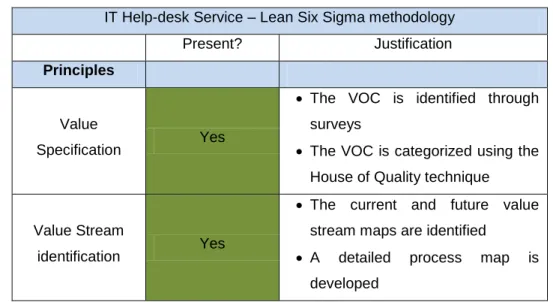
Following the same procedure that was used in the previous methodology, let’s first take a look into the following table:
Table 2: Lean Six Sigma methodology analysis
IT Help-desk Service – Lean Six Sigma methodology
Present? Justification
Principles
Value
Specification Yes
The VOC is identified through surveys
The VOC is categorized using the House of Quality technique
Value Stream
identification Yes
The current and future value stream maps are identified
A detailed process map is developed
9
Continuous Flow Yes
Non-value-added activities are identified and removed
There is an aim of reducing lead time between value-added activities
Costumer-Pull
strategy Yes
The service levels expected by the costumers are taken into consideration
Aim for
perfection No
Although there is a phase with this name, it is just about measuring, managing and controlling the current state. There is no plan for continuous improvement
The perfect value stream is not identified
Goals
Better Quality No
The users satisfaction is not measured in the end
Besides faster services, there is no data about quality improvement.
Quickness Yes
Non-value-added activities are removed
Faster service-process time
More flexibility No
There is not a strategy or plan to enable the creation of new services or features
There is not a process to allow customers to ask for new features
More value to the
costumer Yes
Non-value-added activities are removed
The VOC enables the creation of better metrics to manage users expectations
By looking at the table, it is possible to identify some Lean goals and principles that are not considered in this methodology. Being the aim of this initiative to improve the service quality, it’s odd that in the end there aren’t any results about this topic. It’s true that the main problem in this company was the service-processing time, and it’s also true that that problem was solved. But has the overall service quality improved? It’s possible that the number of re-opened incidents has increased, or maybe the user’s satisfaction about the
10
quality of the solution has decreased. These are important issues that are not addressed. Another limitation in this methodology is concerned with the aim for perfection. The last phase should actually address this topic, but the truth is that it’s only about controlling the performance.
Taking a look into the phases and steps defined, at first, this methodology seems to be very well designed, using a lot of well known tools and techniques. In fact, in every step some of these tools are used giving this methodology a high credibility. But after a deeper analysis, some issues arise. The definition of the as-is state is crucial before starting any project, but using so many tools like the house of quality, the Kano’s model and the categorization of the VOC can highly increase the time needed for this phase. This becomes even worst when some of this information is not used later. For instance, the categorization of the VOC into the five dimensions of quality service seems to have little impact on the definition of the new metrics and the information provided by the Kano’s model seems to have no use at all. The main conclusion about this issue is that the authors tried to use as many of these tools as they could, trying to develop a very complete methodology and to give it a high credibility, but in some cases the information that is produced does not have a significant impact on final result.
Besides the main limitations identified in the previous two paragraphs, there were some smaller ones that were also identified:
The criterion to classify an activity as value-added or non-value-added is not exposed. It should be based on the VOC, but there is not a direct linkage between them.
The VOC is only concerned about the performance of the actual services and does not provide any hints about which activities are value-added ones.
The metrics identified are not based in any standard or set of best practices.
There are only four metrics to be considered, which represent a very limited amount of information.
The perfect value stream is not mapped and therefore it’s harder to identify waste.
3.2.
Lean & ITIL together
This section describes some initiatives that used Lean and ITIL together.
3.2.1. Lean Six Sigma and ITIL by ISQ
ISQ and SQS are developing a Lean Six Sigma methodology to use jointly with the ITIL framework [17]. Their motivation is to develop a methodology to guide ITIL’s implementation and to provide continuous optimization in IT processes. All this description and analysis is based in the public presentations that were made by this project’s developers.
According to ITIL V3, the continuous optimization cycle for a service has three phases: Service Design, Service Transition and Service Operation. This methodology suggests the integrated use of the DMAIC and ICOV Six Sigma cycles within the ITIL’s cycle:
While in Service Design phase use ICOV While in Service Transition phase use ICOV While in Service Operation phase use DMAIC
11
When in an ICOV cycle, this methodology suggests a great number of Six Sigma tools that can and should be used. It also states that the VOC should be captured and that it influences the service’s strategy.
3.2.1.1. Critical Analysis
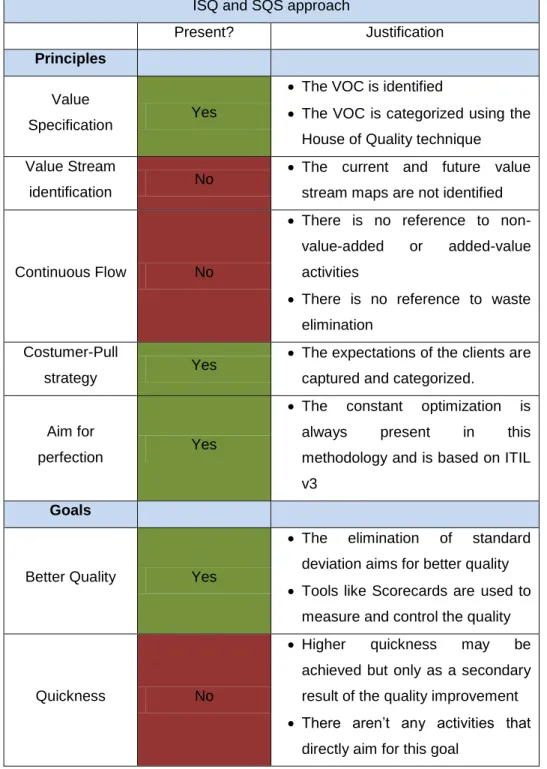
Although it states that it has some basis in Lean, this methodology is mostly based in Six Sigma. In fact, the main goal is to improve quality by eliminating the common deviations that occur when operating a service. There is no reference to any activities like the Value Stream Mapping or the non-value-added activities identification. Following the same procedure that was used in the previous Lean methodologies it’s important to consider the following table:
Table 3: ITIL & Lean Six Sigma methodology by ISQ
ISQ and SQS approach
Present? Justification
Principles
Value
Specification Yes
The VOC is identified
The VOC is categorized using the House of Quality technique Value Stream
identification No
The current and future value stream maps are not identified
Continuous Flow No
There is no reference to non-value-added or added-value activities
There is no reference to waste elimination
Costumer-Pull
strategy Yes
The expectations of the clients are captured and categorized.
Aim for
perfection Yes
The constant optimization is always present in this methodology and is based on ITIL v3
Goals
Better Quality Yes
The elimination of standard deviation aims for better quality Tools like Scorecards are used to
measure and control the quality
Quickness No
Higher quickness may be achieved but only as a secondary result of the quality improvement There aren’t any activities that
12
More flexibility Yes
The expectations of clients are used as input to the optimization process allowing more flexible services
The continuous optimization process contributes to more flexible services as it creates a regular evolutionary environment More value to the
costumer Yes
The VOC is captured and categorized and it influences the services
By looking at the table it is possible to realize that some of the Lean principles and goals are not addressed by this methodology. In fact, value stream mapping should always be the starting point, as it enables the discovery of waste and is an important tool to understand the as-is state and to define the to-be state. Another limitation in this approach is that it does not take full advantage of ITIL’s potential. For instance, there is no reference to the use of ITIL’s metrics which can represent an effective way to measure and control the current’s service quality.
3.2.2. Lean and ITIL v3 Event Management Process
Infosys needed to reduce waste in an ITIL v3 Event Management Process as the Service Desk operations involved significant efforts towards monitoring alerts triggered by specific application related events [16]. A full context is not provided so there’s no information about the organization where this initiative took place.
In order to reach their goal, they decided to apply Lean principles to the process. Their approach consisted in several activities which were organized in three different phases:
Phase 1 - Analysis
o Map the value stream o Collect data
o Identify waste
o Validate waste identification with application groups Phase 2 - Business Case
o Develop a business case (effort/savings) o Determine the implementation requirements Phase 3 - Implementation
o Setup implementation team o Implement changes
o Validate the achieved results
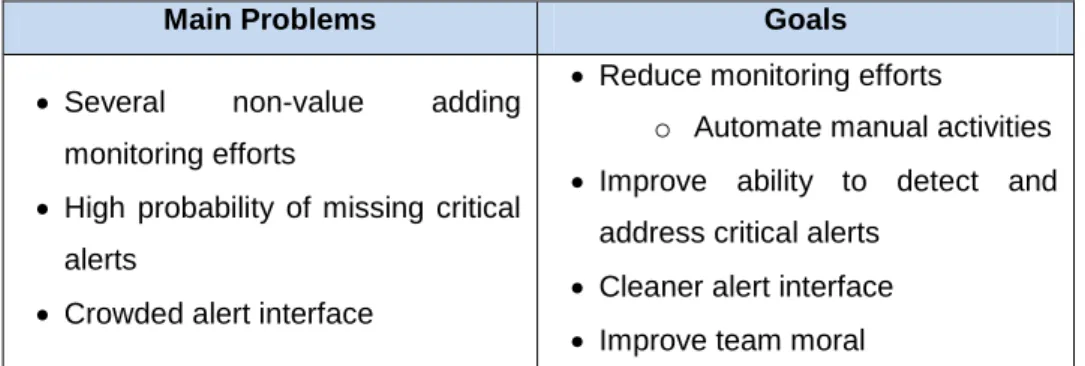
The following table matches the main problems identified in the first phase and the goals established in the second phase:
13
Table 4: Identified problems and established goals for Event Management improvement
Main Problems Goals
Several non-value adding monitoring efforts
High probability of missing critical alerts
Crowded alert interface
Reduce monitoring efforts
o Automate manual activities Improve ability to detect and
address critical alerts Cleaner alert interface Improve team moral
Both the main problems and goals stated in the table are very high level, but they are enough to understand the nature of this initiative.
After the implementation phase, the Event Management efforts were reduced by 44%, representing savings around 600.000 USD.
The total amount of waste was classified in the seven waste forms suggested by Lean [18]: 32% inventory
24% processing time (redundant alerts)
13% waiting time (alerts performing reminder service) 11% product defects
10% overproduction 5% motion
5% transportation
Besides the quantitative results obtained, a continuous improvement program was built and maintained.
3.2.2.1. Critical Analysis
The results achieved in this initiative were clearly positive and all the stated goals were achieved. Once again, it is important to use the same table as in the previous critical analysis:
Table 5: Lean principles and goals identified in the Event Management improvement initiative
Lean in ITIL v3 Event Management Process
Present? Justification
Principles
Value
Specification Yes
The events were classified as non-value/value adding
The classification was validated Value Stream
identification No
The complete value stream was not mapped
Only the process flow was determined
Continuous Flow Yes
Several amount of waste eliminated
14
Less waiting time Costumer-Pull
strategy No
There’s no reference to any kind of pull system.
Aim for
perfection Yes
A continuous improvement program was built and maintained Goals
Better Quality Yes
The probability of ignoring important events was reduced The global quality of event
management improved
Quickness Yes Due to the elimination of waste the process is now faster
More flexibility Yes Due to the elimination of waste the process is now more flexible
More value to the
costumer Yes
There’s more value to the staff managing the events
There’s more value to the final costumers (users) as important alerts are less likely to be ignored
Looking at the table it’s possible to realize that all Lean goals were achieved. In fact, this initiative brought better quality, quickness, flexibility and value to the costumer. There are, however, some aspects that are important to address: the non identification of the Value Stream is a relevant issue. It would be important to understand how each alert influences or contributes to the productivity or satisfaction of end users. IT staff may think that some alerts are crucial while the actions triggered by those alerts may not have any value to the final costumers. This may mean that some waste was not identified and removed. On the other hand, this also means that there’s still room for a better costumer-pull strategy where end users can actually ask for the kind of actions that they consider valuable.
This initiative clearly shows how useful Lean can be to improve ITIL v3 processes. Not only does it eliminates waste, reducing operational costs, as it improves the global quality of the provided service.
15
4.
Proposal
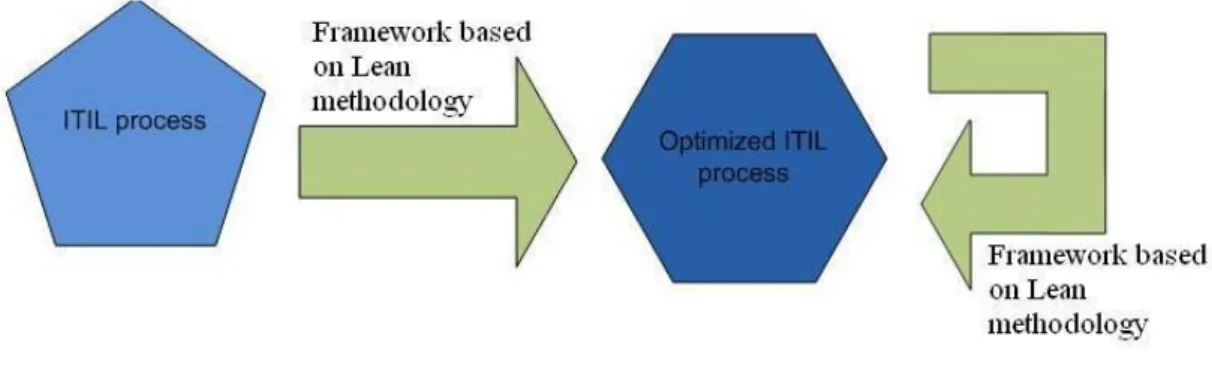
In order to solve the problem described in section 2, the proposal of this thesis is to suggest and evaluate a framework to guide an ITIL process optimization. The framework is based on the Lean methodology, addressing all its principles and goals.
The following diagram represents the application of the framework:
Figure 1: Thesis purpose
As the diagram shows, the framework can be applied to an ITIL process that has never been improved or it can be used to further improve an already somehow optimized ITIL process. There’s always waste to eliminate [3].
16
5.
Implementation
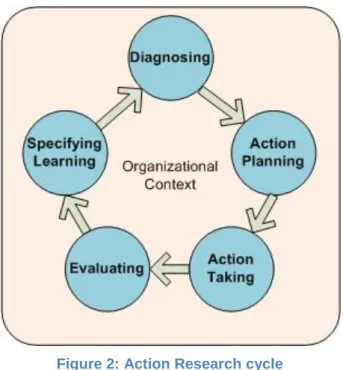
The research methodology used in this Thesis is the Action Research. Action research is an established research method in use in the social and medical sciences since the mid-twentieth century. Toward the end of the 1990s it began growing in popularity for use in scholarly investigations of information systems. The method produces highly relevant research results, because it is grounded in practical action, aimed at solving an immediate problem situation while carefully informing theory [29]. It is composed by five activities conducted within an organizational context in a cyclical way, as it is shown in Figure 2.
Figure 2: Action Research cycle
The purpose of each activity is stated on the following topics:
Diagnosing - corresponds to the identification of the primary problem that is the underlying cause of the organization’s desire for change.
Action Planning - this activity specifies organizational actions that should relieve or improve these primary problems. The discovery of the planned actions is guided by the theoretical framework, which indicates both some desired future state for the organization, and the changes that would achieve such a state. The plan establishes the target for change and the approach to change. Action Taking - Action taking implements the planned action. The researchers and practitioners
collaborate in the active intervention into the client organization, causing certain changes to be made. Several forms of intervention strategy can be adopted.
Evaluating - After the actions are completed, the collaborative researchers and practitioners evaluate the outcomes. Evaluation includes determining whether the theoretical effects of the action were realized, and whether these effects relieved the problems. Where the change was successful, the evaluation must critically question whether the action undertaken, among the myriad routine and non-routine organizational actions, was the sole cause of success. Where the change was unsuccessful, some framework for the next iteration of the action research cycle (including adjusting the hypotheses) should be established.
17 Specifying Learning - Finally, the success or failure of the theoretical framework provides important
knowledge to the scientific community for dealing with future research settings.
5.1.
The Organizational Context
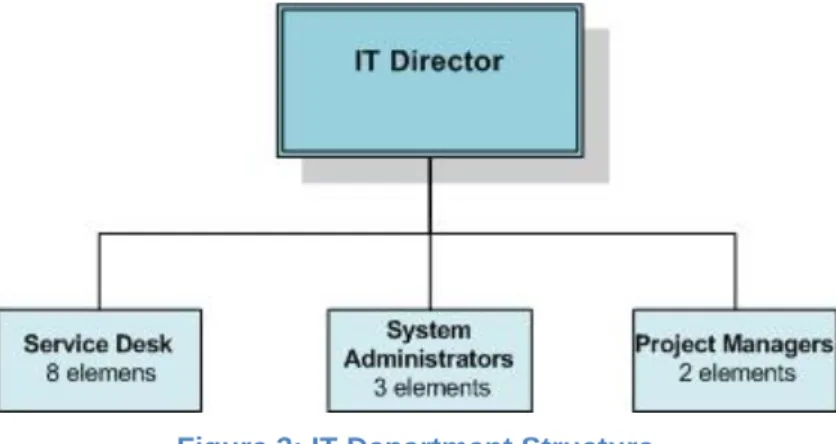
The implementation took place in a Portuguese public organization. The IT Department of this organization is functionally structured as show on the following image:
Figure 3: IT Department Structure
This IT Department is responsible for providing IT Services to the entire organization, which represents a total of 650 users. The users are geographically dispersed around the globe, but most of them are based in Portugal.
In order to manage the department more effectively, ITIL processes were being implemented.
5.2.
Action Research – The 1st Iteration
5.2.1. Diagnosing
The ITIL v3 Incident Management Process was already implemented in the organization. As some issues related to the process were already identified, there was clearly room for improvement. The organization wanted to improve the process in order to mitigate the identified issues and therefore, had the desire to change.
5.2.2. Action Planning
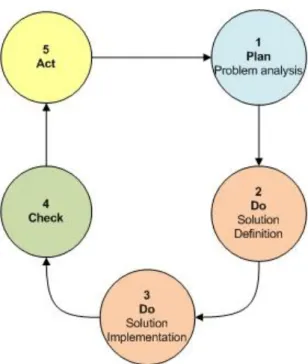
In order to improve the process it was important to create a framework which could be used as a road-map. As stated before, the framework should be based on the Lean Methodology and should address all its goals and principles. Using the Plan-Do-Check-Act cycle, proposed by Lean and also addressed in ITIL v3, the next diagram represents a high-level perspective of the defined framework:
18
Figure 4: Framework phase's diagram
As shown in the diagram, the framework is composed by five phases that are dependent from the organizational context. Along the next topics of this document, the framework’s phases will be explored and described in detail.
Phase 1 – Problem Analysis
Table 6: Problem Analysis activities
Objectives Sequence of Activities Deliverables
Understand the as-is state of the process
Definition of relevant metrics
for the process List of Metrics
Map the as-is Value Stream As-is Value Stream Map
Quantify the previously defined
metrics List of quantified metrics
Identify process customers and their needs
Identify Process Customers List of Process Customers
Define tools to capture the VOC
Inquiries Interviews
19
Identify VA and NVA activities in the current Value Stream Definition of a desirable to
be state
Map a desirable to-be Value Stream
Desirable to-be Value Stream Map
Definition of a possible to-be state
Map a possible to-be Value Stream
Possible to-be Value Stream Map
Identify the Gap between the as-is and the to-be state
Identify the GAP between the as-is and the possible to-be Value Stream
Identify causes for the existing Gap
The activities in detail
Definition of relevant metrics for the process – Metrics are needed in order to quantitatively evaluate the process
◦ Through the analysis of ITIL books, papers and implementation case studies it is possible to identify the most relevant metrics for the process
Map the as-is Value Stream - Value Stream Maps are a graphical representation of the process, including the sequence of activities that compose it and quantitative information about them
◦ In order to create the as-is Value Stream Map it is crucial to observe the process where it takes place
▪ Creation of Activities Diagram
▪ Gathering of quantitative information about each activity
Quantification of previously defined metrics - In order to evaluate the as-is process’s performance it is important to quantify the metrics
◦ Searching for data in logging tools, records or statistical information about the process ◦ Observe and measure the activities if possible/needed
Identify process customers - Costumers are the reason for a service to exist and it is important to understand who they are. They can be identified by:
◦ Observing process outputs
◦ Talking to process managers and employees
Develop tools to capture the Voice of the Costumer – It is important to understand what customers really expect from the provided service
◦ Development of inquiries and/or interviews in order to understand which service features represent value to the customers
◦ Development of inquiries and/or interviews to understand the current satisfaction level of costumers
20 Capture the VOC – After identifying the costumers and developing the tools to capture the VOC it is
possible to:
◦ Perform the surveys ◦ Perform the interviews
◦ Categorize the service's features using the Kano Model
Identify VA and NVA activities in the as-is Value Stream – Having the as-is Value Stream Map and the service's features categorizes, it is possible to identify VA and NVA activities in the process ◦ For each activity answer the following questions (5Ws 1H)
▪ What is done? ▪ When is it done? ▪ Why is it done? ▪ Where is it done?
▪ Who is responsible for doing it? ▪ How is it done?
◦ With the answers from these questions it is possible to understand how each activity affects the process outcomes
◦ If an activity is responsible for the creation of a feature that represents value to the customer, than the activity is VA, otherwise it is NVA.
Map a desirable to-be Value Stream – This Value Stream Map represents the perfect state for the process. Usually, it is only possible to achieve it on the long term, or it may even be impossible to achieve.
◦ NVA that are not essential to the process should not be present ◦ There should be no idle time between activities
◦ Industry Benchmarks can be useful to understand what is possible to achieve for this process ◦ ITIL literature is a very useful resource where a lot of relevant information can be found Map a possible to-be Value Stream – This Value Stream Map represents a state the is possible to
achieve on the short term
◦ It is crucial to conduct Kaizen Workshops involving process managers and collaborators, introducing them to relevant Lean tools:
▪ 7 kinds of waste ▪ Value Stream Maps ▪ Spaghetti Diagrams
◦ The as-is Value Stream Map should be analyzed, looking for waste
◦ Definition of a short term to-be Value Stream Map, where some waste and/or NVA activities have been removed
21 Identify the Gap between as-is and to-be state – The objective is to create charts and tables that can
be used to quantitatively compare the as-is and the short term to-be sates
◦ Spider charts might be useful tools. The most relevant metrics can be used as axis ◦ Box Score tables might also be useful
Identify causes for the existing Gap – After documenting the Gap, it is important to understand why it exists
◦ Fishbone Diagrams might be useful tools
◦ If there's something that employees aren't doing properly, it is relevant to ask them why ◦ Skills matrices might be useful to understand if a team has the right skills to perform an activity
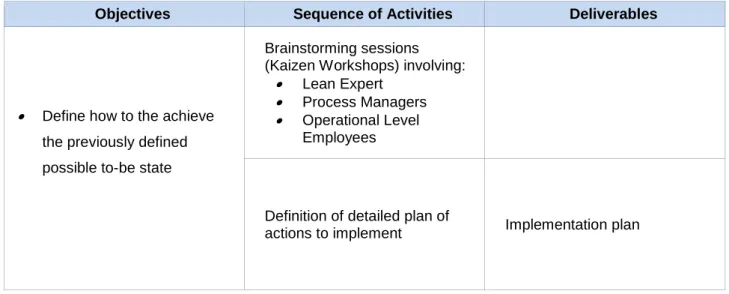
Phase 2 – Solution Definition
Table 7: Solution Definition activities
Objectives Sequence of Activities Deliverables
Define how to the achieve the previously defined possible to-be state
Brainstorming sessions (Kaizen Workshops) involving:
Lean Expert Process Managers Operational Level
Employees
Definition of detailed plan of
actions to implement Implementation plan
The activities in detail
Brainstorming Sessions (Kaizen Workshops) – After defining the possible to-be state and understanding the reason for the Gap to exist, it is possible to define the solution to implement ◦ Organization of Kaizen workshops involving process managers and collaborators where they
should be asked for possible solutions or ideas to solve the current problems
◦ It might be useful to turn things more visual. Creation of Display Boards is a good example of this kind of initiatives
◦ Manual tasks should be turned in automatic tasks when possible
Definition of detailed plan of actions to implement – As a result of the Brainstorming sessions, or even during them, it should be created an implementation plan
◦ Definition of changes to be introduced and actions to be taken ◦ Definition of implementation scope
22 ▪ Pilot – Implementation affects just a part or some elements of the process
▪ Global – The implementation affects the entire process and all the elements associated with it
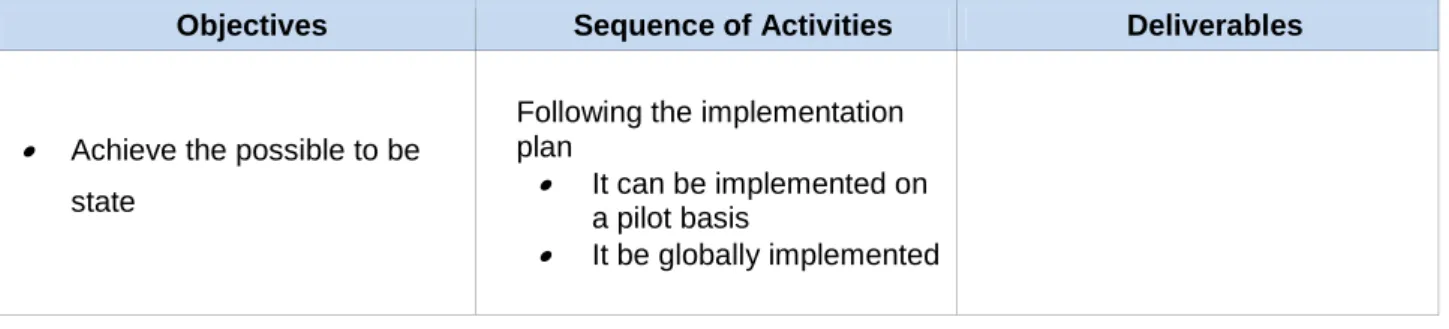
Phase 3 – Solution Implementation
Table 8: Solution Implementation activities
Objectives Sequence of Activities Deliverables
Achieve the possible to be state
Following the implementation plan
It can be implemented on a pilot basis
It be globally implemented
The activities in detail
Following the implementation plan – After the planning phases it is possible to start implementing the defined plan
◦ The implementation should always respect the plan
◦ The Lean expert and/or process owners should be present when the changes are being introduced in the process
◦ It is important to perform coaching activities
▪ Every individual has to understand why the process is changing ▪ Everyone has to understand the new roles, tools or process work-flow
Phase 4 – Check
Table 9: Check activities
Objectives Sequence of Activities Deliverables
Evaluate the new as-is state
Map the new as-is Value
23
Quantify the metrics with their current values
If customer satisfaction
surveys were performed during the first phase, execute them again
Confirm that the possible to-be state was achieved
Compare the new as-is state with the defined possible to-be state:
Compare the Value Stream
Compare metrics values Compare customer
satisfaction
The activities in detail
Map the new as-is Value Stream – After implementing the changes in the process it is important to assess the new as-is state
◦ In order to map the new as-is Value Stream it is crucial to observe the process where it takes place
▪ Creation of an Activities Diagram
▪ Gathering of quantitative data about each activity
Quantification of metrics with their new values – In order to evaluate the variation in the process performance, the metrics must be quantified once again
◦ Searching for data in logging tools
◦ Observing and measuring the activities if possible/needed
Performing customer satisfaction surveys – By performing the customer satisfaction surveys it is possible to gain some insight about their reaction towards the implemented changes
◦ Performing the surveys ◦ Performing the interviews
24
Table 10: Act activities
Objectives Sequence of Activities Deliverables
Definition of new standards for the process
If the implementation made on the third phase was performed on a pilot basis, conduct it on a broader scale
Define new standards for the
process Process Standards
Periodically measure the process performance and guarantee that it is according to the defined standards
The activities in detail
Definition of new standards for the process – If new standards are not defined, the process will probably return to its previous state. Furthermore, it will be harder to control
◦ If there is a new work-flow, it should be included in the new standards ◦ New standard values for metrics
◦ New roles in the process and associated responsibilities
Periodically measure the process performance – In order to guarantee that the standards are being met, it is important to measure and process's performance
◦ Performing Gemba Walks periodically ◦ Assessing metric values periodically
Lean Tools
Kano's ModelThe Kano's model allows the classification of service features, distinguishing between those contributing solely to customer satisfaction, those contributing only to customer dissatisfaction and those which contribute to both satisfaction and dissatisfaction [22]. According to this model, service features can be categorizes into three categories:
Must-be attributes – The must-be attributes correspond to the basic requirements of a service. If these requirements are not fulfilled, the customer will be extremely dissatisfied. On the other hand, as the customer takes these attributes for granted, their fulfillment will not increase his satisfaction. Fulfilling the must-be attributes will only lead to a state of non dissatisfaction.
25 Performance attributes – Depending on the level of their fulfillment, these requirements can satisfy or
dissatisfy customers.
Attractive attributes – These attributes have an high influence on how satisfied a customer will be with a given product. Fulfilling these requirements can lead to more than proportional satisfaction. If they are not met, there is no felling of dissatisfaction.
The following figure represents a graphical representation of the three categories and their influence in customer satisfaction levels:
Figure 5: Kano's model for customer satisfaction. Source: [23]
Customer needs can be categorized using the same model. In that case, Must-be attributes category will be replaced by Basic Needs, Performance Attributes by Performance Factors and Attractive Attribute by Delighters [3]. The criteria for classification is exactly the same, just the perspective is switched from Service Features into Customer Needs.
5.2.3. Action Taking
During this activity of the Action Research cycle, the framework was applied in the organization. The purpose was to improve the ITIL v3 Incident Management Process.
Phase 1 – Problem Analysis
During this phase, one of the main objectives was to understand the as-is state of the process. ITIL literature was assessed in order to gain a deeper insight about the best practices and, subsequently, it was defined a short term to-be state, where the process was improved in comparison with the as-is state.
In the first activity it was created a list with the metrics that ITIL suggests to evaluate the process performance:
26 Average time taken to solve each type of incident
Percentage of incidents that respect the SLA Percentage of reopened incidents
Percentage of incidents solved by the Service Desk Team (first line of support) Percentage of incidents solved by each element of the IT Department
Percentage of incidents remotely solved Total number of logged incidents per month Percentage of solved incidents from each category Number of solved incidents over different day periods
In order to map the as-is Value Stream, it was used one of the methods suggested by Lean: The Gemba Walks. They consist in no more than observing the process were it takes places, talking to the people that are performing it and gaining a true insight about its current issues. It is a much more practical approach than conducting interviews or analyzing documentation. Through the Gemba Walks it was possible to perceive the following set of activities for the process:
Figure 6: Activities Diagram perceived for the Incident Management Process in the organization
The criteria for classifying the activities as Value Adding or Non Value Adding will be further explained in this paper. The next step was to quantify some of the metrics previously defined. As there was a software application that was being used to log and manage incidents during their life cycle, it was possible to analyze the records and quantify the following metrics:
Percentage of incidents that respect the SLA - 66% Total number of logged incidents per month – 360
Although the software application supported incident categorization and prioritization, these features were not being used, as it can be seen in Figure 5. Another relevant issue was that although, there were 360 incidents logged during the last month, this only represented about 50% of the received incidents. During the Gemba Walks it was possible to observe that the Service Desk Team was only logging half of the incidents that were communicated by users. Some other issues have been identified in the User Contact activity:
27 ◦ The average number of unread emails on the inbox was 4. Typically, some of the messages
were read only a few hours after they have been received. When users were contacting the Service Desk through phone calls:
◦ Some of the calls were not being answered and in these cases the Service Desk was not retrieving them. As there was no software to manage phone calls, it was impossible to quantify the amount of received calls and the percentage of missing calls. However, through observation, it was possible to estimate the percentage of missing calls to be ranging from 5% to 10% of all the received calls.
Identifying the clients of this process was an easy task: every employee of this organization, with computer access, represented a potential client. To capture the VOC, two inquiries were created: one to assess the current level of satisfaction towards the service and another to understand which features represent value to users. One constraint arose in this stage as some other inquiries had been conducted just two weeks before with the aim of assessing the current user satisfaction level. As a consequence, it was not possible to ask users to fulfill the new inquiries. On the other hand, the results from the conducted inquiries were still very useful:
In a scale ranging from 1 to 5, the user satisfaction level was 3,6
The software application that was used to manage incidents, also allowed users to express their satisfaction level towards incident resolution. During the Incident Closure activity, users could vote, in a scale ranging from 1 to 5. Surprisingly, the average satisfaction level was 4,74, which was quite higher than the 3,6 suggested by the inquiries. There were several reasons for this disparity:
Not all the incidents were being logged, therefore, the average of 4,74 was not representing the true satisfaction level.
When using the software tool to vote, the users were evaluating the performance of a specific IT college, as they were all part of the same organization. Some of them would never give a low rate as that act could somehow harm the college. In the inquiries, users were evaluating the IT Department as a whole, not individuals. Furthermore, the inquiries were anonymous.
To understand which features represent value to the customer, it was taken an approach similar to the one used by Fujitsu. Typically, the first lines of support, which are in permanent contact with users, know and understand their needs and expectations. Furthermore, users often give suggestions about how to improve the service to the front line element with whom they are communicating. Therefore, using the information provided by the Service Desk Team, it became clear that a user only wants to be able to report his incident and be sure that his problem is well perceived and understood by the entity that is responsible for solving it. Furthermore, they expect the root cause for their problem to be identified in a fast diagnosis, followed by a resolution and recovery situation. Additionally, clients just need to confirm that the problem is solved in order to close the interaction. All this activities should be performed in the smallest amount of time possible, and with IT Staff avoiding the usage of technical speech. Using Kano's Model, it is possible to categorize user's needs as:
Basic Needs
◦ Possibility to report incidents
28 ◦ Possibility to confirm that incident resolution meets user's expectations
Performance Factors
◦ Time to solve an incident ◦ Usage of non-technical speech Delighters
◦ Ability to inform users that there is a problem before they notice it
After categorizing the user’s needs, the next step was to identify VA and NVA activities in the process. In order to do so, it was used the 5W's and 1H Lean Tool:
User Contact – User perspective ◦ What?
▪ A user contacts the Service Desk ◦ When?
▪ Between 8am and 8pm, weekdays ◦ Why?
▪ Because an IT related issue/request has arisen ◦ Where?
▪ From user's working place, which is usually in Portugal ◦ Who?
▪ Any employee in the organization that has computer access ◦ How?
▪ Using Telephone, Windows Messenger, Email User Contact – Service Desk perspective
◦ What?
▪ A user's contact is received ◦ When?
▪ Between 8am and 8pm ◦ Why?
▪ IT Department is responsible for providing support to users ◦ Where?
▪ Organization's main office, in Lisbon, Portugal ◦ Who?
▪ Any Service Desk element ◦ How?
▪ Answering the phone
29 Investigation and Diagnosis
◦ What?
▪ User's request is analyzed and a solution is defined ◦ When?
▪ After a user has reported an incident ◦ Why?
▪ There is the need to analyze user's request
▪ There is the need to identify a solution that can solve an incident ◦ Where?
▪ Organization's main office, in Lisbon, Portugal ◦ Who?
▪ Any element of the Service Desk Team ◦ How?
▪ Communicating with the user ▪ Searching in the internet
▪ Asking to another Service Desk element Resolution and Recovery
◦ What?
▪ User's requests are attended
▪ The previously defined solution is implemented ◦ When?
▪ After the Investigation and Diagnosis activity ◦ Why?
▪ There is the need to solve an incident ◦ Where?
▪ Organization's main office, in Lisbon, Portugal ▪ Service Desk room, using remote assistance tools ▪ In user's work station if it is located in the main office ◦ Who?
▪ Any element of the Service Desk Team ◦ How?
▪ Applying the previously defined solution Incident Logging
30 ▪ An incident is logged
◦ When?
▪ After it has been solved ◦ Why?
▪ There is the need to keep a record of solved incidents ◦ Where?
▪ Service Desk room ◦ Who?
▪ Any element of the Service Desk Team ◦ How?
▪ Using a software application that exist to manage incidents along their life cycle Incident Closure – User perspective
◦ What?
▪ User confirms that his incident was handled properly ▪ User may vote expressing his satisfaction level ◦ When?
▪ After a Service Desk element changes the state of an incident to “Closed” ◦ Why?
▪ There is the need to understand if the incident was handled properly ▪ There is the need to assess user's satisfaction level
◦ Where?
▪ User's workstation ◦ Who?
▪ The user who reported the incident ◦ How?
▪ Reading the e-mail, which was automatically sent by the software application ▪ Replying to the email using just one “click”
Incident Closure – Service Desk perspective ◦ What?
▪ The incident state is altered to “Closed” ◦ When?
▪ After the incident has been logged ◦ Why?
31 ◦ Where?
▪ Service Desk room ◦ Who?
▪ The same Service Desk element that has logged the incident ◦ How?
▪ Using the Software application that is available for managing incidents
Using the synthesized information about each one of the activities and the user’s needs previously categorized, it became possible to classify the activities in the process as VA or NVA:
User Contact – This is a VA activity as reporting an incident is a user’s basic need. If it is not possible or if it is too hard to report an incident, users will never have their needs fulfilled.
Investigation and Diagnosis – Although this is an essential activity, it is not responsible for the creation of value. In a user’s perspective, the IT Department should always know how to attend to their requests and investigation should not be needed. Therefore, this is a NVA activity.
Resolution and Recovery – During this activity, a solution is provided in order to attend user's requests. It modifies/creates process outputs and therefore it represents a VA activity.
Incident Logging – Although this is an essential activity, it is considered a NVA. It does not contribute to the fulfillment of user's requests.
Incident Closure – Users want to be informed that an incident has been solved and want to be able to confirm that the provided solution fits their needs. This is a VA activity.
As it can be seen, although not all the activities are VA, they all are essential for the process. Therefore, none can be eliminated, as none constitutes pure waste.
After assessing the as-is state, it was important to understand the sequence of activities that ITIL suggests for this process. Performing a detailed analysis to ITIL literature it became possible to develop the following diagram:
32
Figure 7: Activities Diagram for the ITIL v3 Incident Management Process
Using the same procedure as before, the activities were categorized as VA or NVA. From a user's perspective, it makes no difference if an incident is or is not logged, categorized and prioritized, or if there is the need to conduct a deep Investigation and Diagnosis. Although the activities represented in white are not responsible for providing direct value to customers, they are essential to the IT Department. Typically, there are several customers interacting with the Service Desk simultaneously, which raises the need to log and prioritize incidents. In many cases there's also the need to perform a deep Investigation and Diagnosis as the incident to be solved might not have a known resolution.
After gaining a deep understanding of ITIL best practices for this process, it was time to, analyzing the as-is state, define a possible to-be state for the process. As defined in the framework, a Kaizen Workshop was conducted, involving IT managers, the Lean expert and operational level employees. In this workshop, both the as-is and desirable to-be Value Stream Maps were discussed. After analyzing the main differences between them, it became clear that the main issue in the current process was the non logging of all the received incidents. Furthermore, this activity should start to be performed right after the User Contact activity, enabling a more effective management of incidents along their life cycle. Therefore, the following diagram representing a new sequence of activities for the process was designed during the workshop:
33
Figure 8: Possible to-be Activities Diagram defined for the Incident Management Process
The two issues previously identified in the User Contact activity were also brought into discussion during the Kaizen Workshop. It was decided that they should be solved in order to turn the user contacts more effective, as the possibility to report incidents is one of the customers Basic Needs.
As a result of the workshop, the Gap between the two states was identified and documented: Incident Logging activity performed after User Contact.
Improve from 50% logged incidents into 100% logged incidents. Average number of unread emails decreasing from 4 to 0. Always answer the calls or call back to users otherwise.
Although the definitions of a possible to-be state and the Gap identification have been relatively easy tasks, identifying the reason for the existence of this Gap proved itself to be challenging. In fact, and as an example, everyone involved in the process knew that all the incidents should be logged and that they should be logged right after user's contact, but still, that was not happening. Using a Fishbone diagram [28], this issue was analyzed accordingly to four main aspects: People, Technology, Equipment and Management.