C
LERMONT
C
OUNTY
F
ACILITIES
M
ANAGEMENT
P
ERFORMANCE
A
UDIT
Executive Summary 1-1
EXECUTIVE SUMMARY
Project History
In January of 2000, the Clermont County Office of Management and Budget contacted the Auditor of State’s Office requesting a performance audit of various County departments. Clermont County has undertaken a performance improvement process to improve accountability to County residents and increase the efficiency of the County’s services. As a component of the performance improvement process, the County requested a performance audit of four County departments to determine the efficiency and effectiveness of operations in each department. Meetings between the Auditor of State’s Office and County management were held to discuss the scope and objectives of the performance audit.
As a result of these discussions, it was determined that the performance audit would focus on the following areas and departments:
! Facilities Management
! Child Protective Services, Policies and Procedures Establishment and Implementation
! Child Support Enforcement
! Permits Central
! Child Protective Services, Agency Program Operational Assessment
The Facilities Management Department performance audit is the first of five performance audit sections to be released. Each performance audit compares the County to standard industry benchmarks and best practices in the specified area. Within the Department, the report focuses on the following areas:
! Staffing
! Capital planning and budgeting
! Repair and maintenance
! Strategic planning
! Contracted services
! General operations
! Building capacity and utilization
! Technology
Executive Summary 1-2
Department Overview
The Facilities Management Department (the Department) is responsible for the operation and upkeep of the majority of the County’s buildings and grounds. The County facilities consist of 38 structures and 2 vacant sites ranging in size from 120,000 square feet (Adult Detention Center/Jail) to 1,030 square feet (Milford Auto Title Building). The Department maintains and repairs the County’s facilities, equipment and plants; constructs and renovates County facilities; plans and designs work spaces; manages supplies and logistics in support of all County departments; and provides custodial services and support.
Thirteen employees work within the Facilities Management Department and, because of the small staff, the Department relies heavily on contracted services to provide specialized services to the County. Functions, including custodial work and ground maintenance, are out-tasked through competitive contracting. In FY 1999, the Department allocated approximately 14 percent of its total FY 1999 expenditures to contracted services. Through using competitive contracting, the Department has maintained expenditures at rates below International Facility Management Association (IFMA) averages for most custodial services.Department out-tasked custodial operations were $0.99 per square foot compared to $1.27 for government facilities in the Midwest, as reported by IFMA. While the County has shown a commitment to its facilities by allocating 2.0 percent of every significant facility’s installation cost for capital improvements, funds have not been set aside for building replacement. A ten year capital plan was developed in a spread sheet format, but this document does not include key components such as costs, responsible parties, and due dates. Capital planning has not been linked to preventive maintenance or long term building replacement and the County has not examined building capacity and utilization, resulting in the County having substantial excess capacity in five of its facilities.
The Department has been highly proactive in achieving energy savings through deregulation. The Department decreased utility expenditures and save approximately $12,000 from March 1998 to December 1999. In addition, the Department is planning for the de-regulation of the electric industry by convening an energy de-regulation task force. Because of efforts to reduce costs, utility expenditures are generally below IFMA averages, except for the Adult Detention Center and the Sheriff’s Office. Yet, the Department has not conducted analyses of energy utilization on a per building basis.
Executive Summary 1-3
Summary Results
The summary results of the performance audit are contained within pages 1-3 through 1-13. The summary result is followed by overall performance audit information, including a definition of performance audits, the objective and methodology of performance audits and comparisons of key information.
The performance audit addresses Clermont County’s Facilities Management Department and focuses on staffing, capital planning and budgeting, repair and maintenance, strategic planning, contracted services, general operations, building capacity and utilization, technology, and energy management. Major findings, commendations, and recommendations are provided for each area. A thorough analysis of each of the Departments, including detailed findings and recommendations, is contained within the corresponding section of the report. All interested parties are encouraged to read the entire report.
The results of this performance audit should not be construed as criticisms of Clermont County’s Facilities Management Department. The performance audit should be used as a management tool by Clermont County and the Department to improve operations within the agency, as the performance audit provides a series of ideas which the County and Department should consider in its decision-making process.
A table representing a summary of the financial implications of the recommendations is presented on page 1-13. However, this performance audit also contains a number of recommendations that may not generate estimable cost savings but will result in enhanced service delivery within the Facilities Management Department operations. If implemented, these recommendations would improve the operational efficiency of the Department and its effectiveness in achieving its mission.
Staffing
Findings: The Facilities Management Department reports to the County administrator and currently consists of 13 full-time equivalents (FTEs). Within the Department, administrative employees do not fulfill the tasks indicated in the job descriptions. Most job descriptions have not been updated in the past ten years. Because the work being performed does not met the criteria of the job description, some tasks are not completed, while others may be duplicated. The essential responsibilities of the CAFM specialist remain unfulfilled and the CAFM specialist has not made significant headway in cataloging the County’s buildings or fixed assets. The County employs more full time administrative employees, excluding clerical staff, per maintenance employee than similar sized counties. With the addition of the management systems specialist, the County will essentially have two Facilities Management Department directors and will spend nearly $98,000 in salaries for both the two positions, which is twice the average amount expended by similar size counties for overall department management.
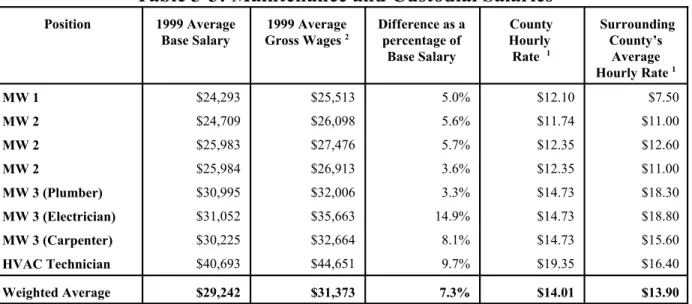
Executive Summary 1-4 The weighted average base salary for the maintenance staff in Clermont County is $29,242. On average, the maintenance and custodial gross salaries are 7.3 percent higher than the base salary amounts, reflecting overtime used by maintenance worker 2s (MW2s) and maintenance worker 3s (MW3s). Clermont County’s Facility Management Department hourly wage rates are similar to the surrounding counties. Entry level positions are slightly higher than those in the surrounding counties, but skilled maintenance salaries are lower. In FY 1998, County employees were paid a total of $6,897 in overtime, compared to $15,446 in FY 1999, an increase of approximately 124 percent. Additional overtime was paid in FY 1999 because of the installation of a new HVAC system in the Medical Social Services Building and an increase in emergency snow days over FY 1998.
Recommendations: The County should determine which tasks are most appropriate for each administrative employee within the Facilities Management Department. Job descriptions for the Facilities Management Department should be updated to accurately reflect the roles and responsibilities of each position in the Department and should be reviewed on a regular basis. The County should ensure that the CAFM specialist has the necessary computer skills to complete the required duties of the job. The CAFM specialist should complete CAD drawings showing utilized space for all of the County’s facilities. The County also should designate department representatives to compile what the County considers to be fixed assets. The fixed asset database should be tied to the County’s accounting system to ensure that all items designated as fixed assets are captured and tagged as soon as they are received by the County departments. Furthermore, Clermont County should examine the administrative staffing levels in the Facilities Management Department and consider reducing administrative staffing levels to be more in line with staffing levels in similar sized counties.
Capital Planning and Budgeting
Findings: Clermont County facilities consist of 40 sites with a total square footage of 537,092. The County was not able to provide ages for all of the County’s buildings. Including only County buildings for which the age is known, the average age of the facilities is about 36 years old, but four facilities are over 100 years old. The County estimates the total cost to renovate existing and construct new facilities to be approximately $26.2 million dollars. Renovations of existing facilities would cost $6,115,000 and $20.1 million would be needed to construct new facilities to reduce overcrowding.
The County funds building maintenance, capital improvement and repairs through approximately 1/3 of a 3.2 mill inside (non-voted) levy and state and federal grants which are paid from the general fund. The Facilities Management Department is funded through a General Fund appropriation which amounted to approximately $2.0 million in FY 1999. The County allocates an additional 2.0 percent of every significant facility’s estimated installation value from the General Fund to a Capital Projects Fund which is used for both repairs and improvements within the facility and facility replacement. The
Executive Summary 1-5 2.0 percent significant building set-aside is also used by the County to fund major capital improvements that will extend the life of a building and aid in the preservation of the County’s capital investments. Facilities not considered to be of major status, including the majority of buildings constructed before 1993, are funded out of the Facilities Management Department’s annual budget. Clermont County’s facilities-related expenditures are lower than or equal to IFMA reported averages for government institutions. Factors which contribute to the low expenditure level are the County’s low custodial and maintenance salaries and benefits expenditures including lower hourly salaries. Lower purchased services per square foot are facilitated through the use of out-tasked custodians and JIP operating at a relatively efficient cost per square foot.
The County has developed a 10 year capital improvement list forecasting anticipated capital outlays for renovation and construction of the County’s facilities and uses linked spreadsheet files that comprise a multi-year capital improvement plan. The plan does not address the County’s plans for leased buildings that may be rendered obsolete by the construction of new facilities such as the Municipal Courthouse.
Commendations: The County has been able to keep its facilities-related expenditures lower than or equal to IFMA averages through the use of sound management practices such as out-tasking custodial operations at a relatively efficient cost per square foot and gross square feet cleaned per employee, and augmenting custodial operations by the use of JIP, which costs the County about half of the IFMA average custodial cost per square foot.
Also, the County has developed an appropriate and effective methodology to fund the capital and replacement needs of significant buildings. Subdividing the fund ensures that each building will have the necessary capital improvement resources to fund large repairs and upgrades during the building’s useful life.
Recommendations: The County should examine its facilities-related expenditures to ensure that funding levels are adequate to ensure the continued upkeep of the County’s buildings as the County currently faces costly repairs to many of its buildings. The Department, with the assistance of County management, should update the facilities survey and include prioritized repairs and associated funding sources in Departmental planning documents.
The County should consolidate the linked spreadsheet files into a comprehensive capital improvement plan in an effort to centralize planning. The plan should include an overview of critical investments that are planned during the life of the plan, a detailed explanation of how the County will finance these projects, sources of funding, links to long-term facilities and preventive maintenance plans, and Americans with Disabilities Act (ADA) compliance funding measures.
Executive Summary 1-6
Repair and Maintenance
Findings: The County owns 28 facilities and leases 10 facilities. Buildings are leased at a cost to the County of $8.00 to 10.00 per square foot, of which approximately $1.70 per square foot (based on FY 1999 expenditures of $92,000 for 52,000 feet of leased space) is maintenance costs. The County leases primarily smaller structures that County officials feel are more cost effective to lease than building dedicated structures. The Facilities Management Department provides minimal maintenance on the leased spaces. Most maintenance done to the leased facilities is the lessor’s responsibility and is performed at the lessor’s expense. Custodial services are provided by either the lessor, although the County provides custodial services to three of the leased buildings.
Maintenance and custodial services provided to the Professional Building, the Milford Auto Title Building, and the Williamsburg Records Retention Center Building all reflect higher costs to maintain and provide custodial services than County owned buildings and IFMA averages. Custodial costs are high because the MW1 provides custodial services to the Professional Building and Milford Auto Title at $5.90 per square foot.
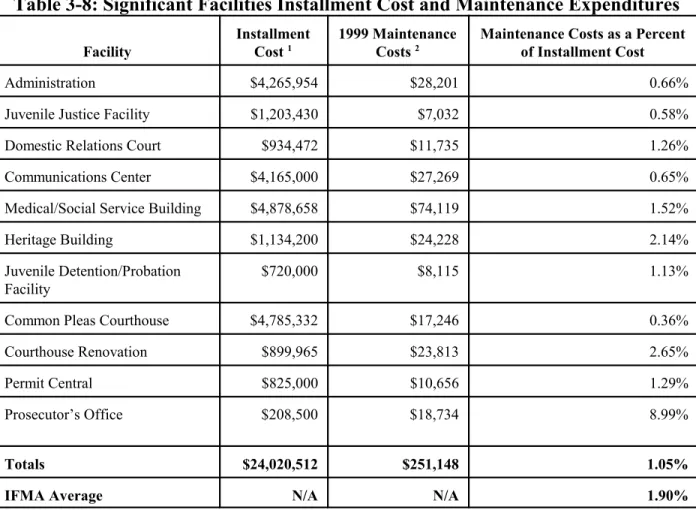
The Building Research Board of the National Research Council published a report in 1990 in which they recommended that an appropriate budget for routine maintenance of a facility should fall within a range of 2.0 to 4.0 percent of current replacement value. The County dedicates two percent of each significant facility’s installation cost to capital improvements and replacement. The County does not track replacement costs, but monitors the construction cost, the annual and accumulated depreciation, and net book value of each building over a fifty year depreciation schedule. IFMA reports that maintenance costs as a percentage of replacement costs averaged 1.9 percent overall and generally increase with the age of the facility. The overall amount expended on the County’s significant facilities is 1.05 percent of the installation cost, which is 44.7 percent below IFMA averages.The County’s repair and preventive maintenance costs are approximately 10.0 percent lower and 19.1 percent higher than IFMA averages respectively.
Although the County sets aside funds to replace buildings after their useful life span, the County is only providing set-aside funds for the newest buildings under its management. Plans have not been made to replace older buildings or to fund future expansions of County facilities. The IFMA recommends an annual set aside of approximately 2 to 4 percent of a building’sreplacement value which is allowed to accrue until a replacement building is required. Furthermore, the County does not have a comprehensive preventive maintenance plan. The Department relies on the contracted service providers to relay maintenance concerns occurring in the buildings. To address and evaluate maintenance issues raised by contracted staff, the County employs one multi-functional MW2 that can evaluate most areas of a building’s operations. This employee is often sent into buildings after contractors have reported maintenance concerns.
Executive Summary 1-7
Recommendations: In order to offset the high custodial costs, the County should monitor services provided by the Facilities Management Department to the leased buildings. If the County determines the JIP program can be expanded, the County should consider using the JIP to clean the Professional Building and the Milford Auto Title Building and eliminating the MW1 position.
The County should develop a replacement schedule for aging buildings in conjunction with a detailed capital improvement plan. Revenues from the levy should be set aside in increments sufficient to fund a building’s replacement after the fifty year expected life span of the building has expired. Finally, the County should implement a planned preventive maintenance program. An effective preventive maintenance program can help improve worker productivity by proactively maintaining equipment rather than responding to breakdowns and emergencies. The County has several options regarding the development of preventive maintenance software. The County could use the County Management Information Systems Department in conjunction with the CAFM specialist and management systems specialist to develop a preventive maintenance system in-house. The County could purchase a stand-alone preventive maintenance software application or it can purchase an add-on Facilities Maintenance Module to the CAD program already in existence. A preventive maintenance software program would flag preventive maintenance items and notify the appropriate personnel when items are scheduled for preventive maintenance.
Financial Implication: Eliminating the MW 1 position would save the County about $33,000 in salaries and benefits. Using the JIP to clean the buildings currently maintained by the MW1 would cost approximately $8,200. A total cost savings of $24,800 could be realized through shifting the MW1's cleaning duties to the JIP.
The County could implement a preventive maintenance program without increasing staffing levels. If the County decides to develop preventive maintenance software in-house, the cost is unquantifiable. If the County purchases stand-alone preventive maintenance software, it should expect to pay approximately $6,000. If the County purchases the CAD add-on facilities maintenance software, the cost is between $3,000-$4,000, depending upon the options the County decides to purchase.
Strategic Planning
Findings: The County does not have an up-to-date long range facilities plan to address its future needs. In June 1992, NBBJ Architects/Interior Space Designers/Site and Community Planners developed a master facilities plan for the County that evaluated County growth trends, outlined specific facility site recommendations, and analyzed space utilization, existing location and proposed area required for facilities needs based on FY 1995 County population projections. Despite the 1992 facilities assessment, the County and Department have not referred to the plan when considering building utilization. Since 1992, the county has completed HVAC upgrades to several buildings. Two new buildings have been added to the downtown Batavia complex, but the Department has not examined energy efficiency in many of the buildings outlined in the 1992 report as less than adequate. The County has a risk assessment plan and tool box that was developed by an outside consulting firm
Executive Summary 1-8 in January 1998. The plan outlines the County’s risk management policy and breaks down potential areas of risk by department, such as the Department of Human Services, Facilities Management, Water and Sewer Department and the Fleet Management Department. Although the County does not employ a risk coordinator, the facilities coordinator and safety officer for the Engineer’s Office currently facilitate organizational safety systems and processes through formal monthly meetings in which aspects of the risk management plan are explained and OSHA safety standards are discussed. Clermont County contracts with a third party administrator, CompManagement Inc., to oversee all workers compensation issues. The Facilities Management Department filed one claim in FY 1999 that resulted in an award of approximately $200. The Department has not filed any other claims in the last five years. From 1995 to 1999, the County’s experience modifier status remained constant at 0.81, which indicates the third party administrator is effectively managing the contract. In 1999, the County saved $96,000 in workers’ compensation premiums.
Commendations: The Department has been proactive in helping management and staff identify accident prevention by using the risk assessment plan and other resources to regularly discuss worker safety issues. These regular meetings ensure employees are trained in safety related issues and may contribute to controlling overall worker’s compensation costs by preventing claims from the outset.
Recommendations: The County should develop a comprehensive long-range facilities plan which contains historical information about the County’s demographics and community characteristics. The County should revise the 1992 facilities plan to include the most important repairs based on the current condition of County facilities. The plan should include an annual maintenance plan detailing by year the types of work to be performed; an ongoing preventive maintenance plan for each of the County’s facilities; planned public access within County buildings that ensures a reduction of barriers for compliance with the Americans with Disabilities Act (ADA) statutes; facility evaluations, capital improvement needs, and capacity and space utilization analyses to guide long-term plans and shape the space needs for future generations of citizens; an implementation plan and budget which includes funding sources and an evaluation process to guide facility spending and help anticipate funding needs; and formal written standards outlining space allocation.
General Operations
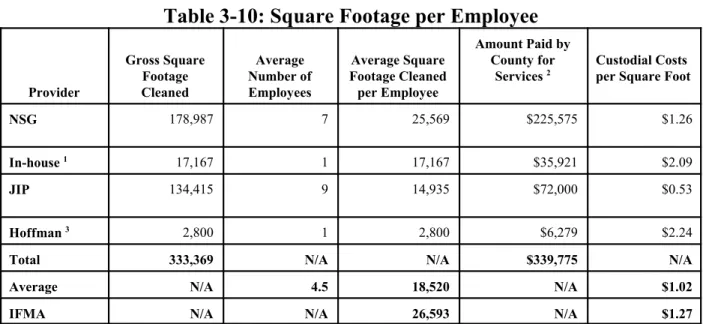
Findings: The County does not make adequate use of quantitative data to determine the appropriate number of custodians necessary to maintain its facilities. The County’s facilities are currently cleaned by a combination of in-house and contracted employees and jail inmates that are part of the Jail Industrial Inmate (JIP) program. County custodial staff is cleaning approximately 8,000 square feet per custodian less than averages reported in IFMA Research Report #16. Although the County is operating its custodial operations at $1.02 per square foot, which is less than IFMA averages reported for government facilities in the Midwest, two providers, the MW1 and Hoffman, are providing custodial services to the County at 46 percent and 42 percent above IFMA reported averages respectively. The County is cost effectively using minimum security jail inmates to clean
Executive Summary 1-9 approximately 134,000 square feet of the County’s facilities at about $0.53 per square foot, the lowest custodial cost per square foot of the County’s custodial providers. In FY 1999, the County furnished approximately $29,000 in cleaning supplies to NSG and the jail inmates in the JIP. The County does not have a formal equipment replacement policy for maintenance equipment of charge back end users for services rendered by the Facilities Management Department. IFMA reports that 55 percent of government facility management departments charge users for expenses in some manner.
Recommendations: The County should use quantitative data to determine custodial staffing levels which would help to reduce costs and bring the County more in line with IFMA averages. When determining the number of custodians necessary to maintain its facilities, the County should take into consideration factors such as the building’s age, condition, size and layout; access to equipment; number of restrooms; and industry standards published by the International Sanitary Supply Association and the Building Service Contract Association International.
The County should also consider the following:
! Expand the JIP program.
! Establish custodial supply budgets for each building and track supply costs
! Establish a formal departmental equipment replacement policy
! Charge back end-users for services rendered by the Facilities Management Department
! Establish fixed rate charges for services provided to lessors and the Williamsburg Records Retention Center, and special projects charges for services
Financial Implication: Decreasing the cost of cleaning supplies from $0.10 per square foot to the average best practice cost of $0.05 per square foot will save the County approximately $15,000 per year.
Contracted Services
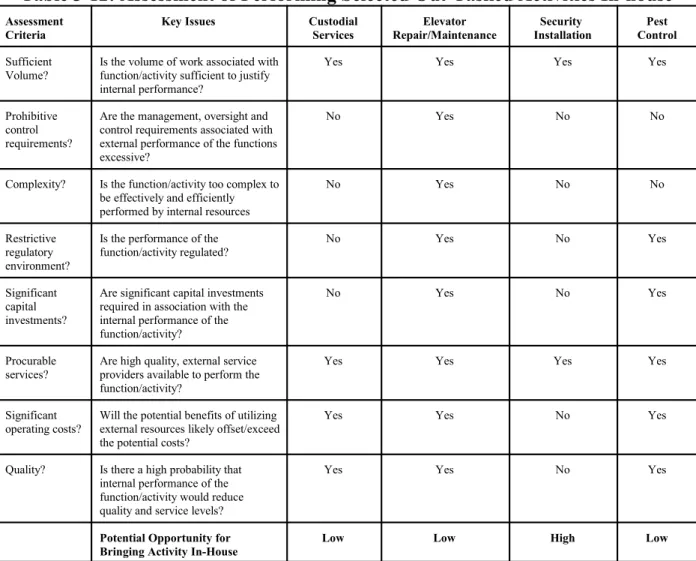
Findings: The County currently expends about 14 percent of the Facilities Management Department’s annual budget on contracted services. The majority of the out-tasked activities have been contracted out because of liability issues. Based on an assessment of out-tasking opportunities, it appears that the County should continue to out-task the custodial operations, elevator repair and maintenance and pest control functions. The out-tasked service providers generate minimal complaints regarding service levels. In addition to gauging service levels by the number of complaints
Executive Summary 1-10 received, which averages about one complaint every two weeks, the County monitors contractor service levels on a daily basis.
The County does not annually assess its out-tasked services to determine if improvements, such as cost savings can be realized by bringing the activity in-house. Although a significant amount of funds are expended on out-tasked services, the County and Department have not performed analyses to determine if some services could be performed in-house at a lower cost by certifying County personnel.
Recommendations: The director, management systems specialist and facilities coordinator should perform an annual cost-benefit analysis of out-tasked activities to determine whether the County would benefit from bringing some out-tasked operations in-house. Some operations may be able to be performed in-house at a lower cost through certifying existing personnel, such as the plumber and electrician.
Other significant recommendations include:
! Increase the number of unannounced building inspections
! Install all fire and burglar alarms in-house.
Financial Implication: Based on FY 1999 costs, the County could save approximately $2,400 in alarm installation charges by transferring installation responsibilities to the MW 3. Hardware costs are not included in this analysis.
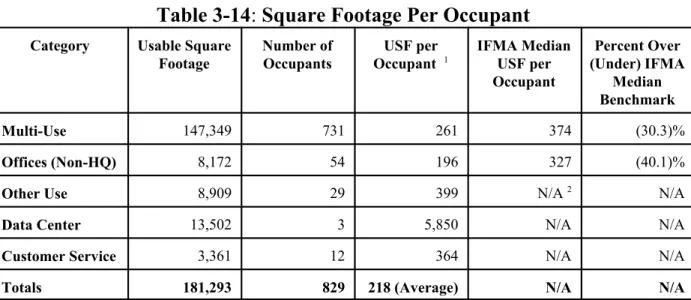
Building Capacity and Utilization
Findings: The County has not examined building capacity and utilization. County employees are currently occupying about 218 usable square feet per employee. The County has an average vacancy rate of 17 percent, which can partially be attributed to the large amount of unused space in County buildings like the Coroner’s Office, Old Courthouse and Service Center.
Recommendations: The County should develop formal written standards outlining space allocation and include the standards as part of the long term strategic facilities plan. The County should also consider closing some of its facilities with substantial unused excess capacity, such as the Coroner’s Office and Service Center. By closing underutilized buildings, such as the Service Center and the Coroner’s Office, the County could save approximately $34,000 in custodial, utility and maintenance costs. Also, a methodology for projecting population that accounts for the County’s needs and services should be adopted by the County and used to determine facility capacity and utilization at least every five years.
Executive Summary 1-11
Financial Implication: By closing underutilized buildings, such as the Service Center and the Coroner’s Office, the County could save approximately $34,000 in custodial, utility and maintenance costs.
Technology
Findings: The current work order processing system limits management’s ability to make effective decisions regarding the needs of the Facilities Management Department. The management systems specialist has expressed interest in purchasing Work Director software which will track work orders; work order requests; labor activities; compile work history and costs; track equipment and materials inventory; maintain maintenance and scheduled activities logs; and perform other user defined functions.
All of the County’s boilers and HVAC systems are equipped with audible alarms that are tied into the security system at the Communications Center Building. If an alarm sounds, it will show up as a boiler alarm, prompting a 911 dispatcher to contact the HVAC technician, who is on 24 hour call. Because of this, the Department does not conduct weekend building checks. The boilers at the Medical/Social Services Building are the only boilers remotely monitored by a computer software package. The boilers systems can be monitored through a modem.
Commendations: The County has eliminated the need for weekend building inspections, which saves the County from paying unnecessary overtime. The use of alarm systems tied to the Communications Center and the remotely controlled boiler allow the County to monitor the boilers without on-site presence of Facilities Management Department staff members.
Recommendations: The County should purchase an automated comprehensive work order system such as the Work Director software which will allow the County to track work orders, material use figures, personnel information and productivity statistics with relative ease.
Financial Implication: The cost of automated comprehensive work order system, such as the Work Director software, is approximately $2,100. However, in-direct costs may also occur due to installation of the software and employee training.
Energy Management
Findings: The County purchases self-help gas from Cinergy Resources and the Department has saved nearly $12,000 from March 1998 to December 1999. The County has convened an energy deregulation task force consisting of representatives from the Sewer and Water Department, Facilities Management Department, Permits Central, Office of Management and Budget and the Information Systems Department. The task force meets monthly to discuss options for the County in anticipation of electrical de-regulation. The County appears to adequately monitor energy consumption in the
Executive Summary 1-12 majority of its facilities and is expending utility costs at below IFMA averages. However, the County has three facilities that exceed IFMA averages in average utility costs per square foot: the Adult Detention Center, Communications Center and Transportation Connection/Adult Treatment Center Building. While these higher costs may be a result of 24 hour building use, the County has not studied electricity usage in a majority of its buildings.
In 1996, the County Water and Sewer Department purchased a systems analyzer that attaches to the in-coming Cincinnati Gas and Electric Company (CG&E) power supply to monitor and electronically log energy utilization. Because of these monitoring efforts, the Water and Sewer Department has been able to reduce electrical costs by approximately $128,000 between 1995-1998. The Facilities Management Department declined to take advantage of the Water Department’s systems analyzer. In 1999, the Facilities Management Department purchased an Amprobe data/logger recorder and an oscilloscope, which the Department uses to troubleshoot electrical problems and determine if problems lie within the County’s electrical system or within CG&E. The Facilities Management Department has not used the equipment to perform a systems analysis that could better track utility costs and monitor high use areas. Utilities for the Adult Detention Center and the Sheriff’s Office are paid out of the Facilities Management Department’s annual budget, although the Department does not perform work at either facility. Because the Facilities Management Department does not perform services at either building, energy analysis and conservation efforts are not addressed or overseen by Facilities Management Department personnel. Utility costs for both facilities amounted to $166,999 for 1999, or about 8 percent of the total Facilities Management Department budget.
Beginning in 1995, the County started retrofitting building light bulbs from larger T-12 type fluorescent bulbs to smaller, more energy efficient T-8 type bulbs. However, only 4 of the 40 buildings in the County were completely retro-fitted with both the T-8 bulbs and the electronic ballasts. The remaining buildings have been partially retrofitted with only the T-8 bulbs, have not been retro-fitted because they are leased, or have been recently constructed with more efficient lighting already in place
Commendations: By taking advantage of the deregulation of the gas industry, the County has decreased its utility expenditures and increased funding to support facilities-related programs. In addition, conducting regular meetings made up of diverse county departments and personnel dedicated to electrical deregulation will ensure adequate communication and input regarding up-coming electrical deregulation options for the County.
Recommendations: The Facilities Management Department should analyze building energy consumption to help reduce utility costs. The County should also request that its present electricity provider, CG&E, conduct an energy consumption audit on those facilities that have the highest kilowatt per hour and utility cost per square foot. The Department should ensure that the Adult Detention Center follows through on recommendations for energy management upgrades. Also, the County should install T-8 fluorescent bulbs and electronic ballasts in the remaining buildings.
Executive Summary 1-13 Because utility costs for the Sheriff’s Office and Adult Detention Center/Jail represent a substantial part of the total Facilities Management Department budget, the County should better regulate energy consumption at these facilities. In doing so, the County should consider centralizing the maintenance and operation of the two facilities under the Facilities Management Department.
Summary of Financial Implications
The following table summarizes the performance audit recommendations which contain financial implications. These recommendations provide a series of ideas or suggestions which the Facilities Management Department should consider. Detailed information concerning the financial implications, including assumptions, is contained within the performance audit.
Recommendation Estimated Annual
Cost Savings
One-time Implementation Costs
R3.7 Eliminate the MW1 positions and use the JIP to clean the Professional Building and the Milford Auto Title Building
$24,800
R3.10 Purchase and implement preventive maintenance software to manage preventive maintenance efforts
$3,000-$6,000
R3.14 Through bulk purchasing, decrease the cost of cleaning supplies
$15,000
R3.17 Transfer alarm installation from Honeywell to an in-house employee
$2,400
R3.20 Close the Service Center and Coroner’s Office to reduce unused space
$34,000
R3.22 Purchase automated comprehensive work order system software
$2,100
Total $76,200 $5,100 - $8,100
The County estimates the total cost to renovate existing and construct new facilities to be approximately $26.2 million. Renovations of existing facilities would cost $6,115,000 and new construction would amount to $20.1 million.
Executive Summary 1-14
Objectives and Scope
A performance audit is defined as a systematic and objective assessment of the performance of an organization, program, function or activity to develop findings, conclusions and recommendations. Performance audits are usually classified as either economy and efficiency audits or program audits. Economy and efficiency audits consider whether an entity is using its resources efficiently and effectively. They attempt to determine if management is maximizing output for a given amount of input. If the entity is efficient, it is assumed that it will accomplish its goals with a minimum of resources and with the fewest negative consequences.
Program audits normally are designed to determine if the entity’s activities or programs are effective, if they are reaching their goals and if the goals are proper, suitable or relevant. Program audits often focus on the relationship of the program goals with the actual program outputs or outcomes. Program audits attempt to determine if the actual outputs match, exceed or fall short of the intended outputs. The performance audit conducted on the Facilities Management Department contains elements of both an economy and efficiency audit and program performance audit.
The objectives of performance audits may vary. The Auditor of State’s Office has designed this performance audit with the objective of reviewing systems, organizational structures, finances and operating procedures to assess the efficiency and effectiveness of the Department. Specific objectives of this performance audit include the following:
! Determine the efficiency and effectiveness of the in-house staffing level and mix
! Determine the effectiveness of capital planning, budgeting and strategic planning
! Evaluate repair, maintenance, and custodial service levels and operations
! Analyze the efficiency and effectiveness of in-house general operations and contracted services
! Review building capacity and utilization
! Evaluate the use of technology and energy management techniques by the Department The performance audit of the Authority covers the following areas of operations:
! Staffing
! Capital planning and budgeting
! Repair and Maintenance
! Strategic Planning
! Contracted Services
! General Operations
! Building Capacity and Utilization
! Technology
Executive Summary 1-15 Planning for the performance audit began in February 2000. The actual performance audit was conducted primarily during the months of March 2000 through mid-June 2000. Regular progress meetings were conducted throughout the entire period. Draft reports were discussed with the staff and management of Clermont County and the Department.
Methodology
To complete the performance audit, the auditors gathered and assessed a significant amount of data pertaining to the Department, conducted interviews with various individuals associated with the Department and assessed information from industry benchmark and best practices reports. The methodology is further explained below.
Use of previous studies, reports other data sources
In evaluating the various performance audit areas, the Department was asked to provide any previous studies or analyses already prepared on the subject areas. In addition to reviewing this information, the auditors spent a significant amount of time gathering and reviewing other pertinent documents or information.
• International Facility Management Reports #16 and #18
• Clermont County Master Plan of Facilities and Risk Management Policy/Tool Box • City of Milwaukee Capital Plan
• CG&E Energy Consumption Report (1994-1999) and Internal Utility Data • Clermont County Vendor Contracts
• Maintenance Solutions Reports
• KPMG Activity Based Costing Report FY 1999 • CAD Documents
• Salary and Benefit Data from Clermont and surrounding Counties • Fiscal Information from FYs 1998, 1999 and 2000 projections • Office of Management and Budget
Interviews and Discussions
Audit staff also held numerous interviews and discussions at many levels and with groups of individuals involved internally with the Department. These interviews were invaluable in developing the overall understanding of departmental operations and in some cases, were useful sources in identifying concerns with facilities management operations and in providing recommendations to address these concerns. Examples of the studies, reports, other data sources and organizations and individuals which were reviewed and interviewed include the following:
Executive Summary 1-16 • Clermont County Facilities Management Department staff
• Facilities Management Department directors in Clark, Greene, Lake, Licking, Medina, Portage and Warren Counties
• IFMA personnel • CG&E representatives
• Clermont County Office of Management and Budget personnel
Benchmark Comparisons with Other Agencies
Benchmark comparisons were developed through best practice agencies, International Facilities Management Association (IFMA) benchmarks, and like sized counties: Clark, Greene, Lake, Licking, Medina, Portage and Warren. Performance indicators were established for the various performance audit areas to develop a mechanism to compare how effectively and efficiently the Department is providing necessary functions. The information was gathered through interviews, data reports, and industry publications.
Comparative Statistics
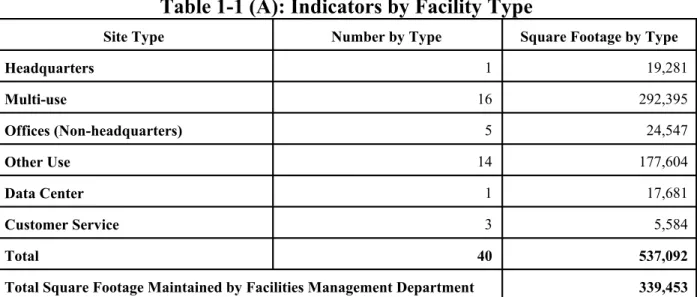
Comparative statistics and information regarding Department operations are presented in Tables 1-1 (A) through 1-1 (D). Table 1-1 (A) shows the Facility Management Department’s number and square footage maintained by facility site type. The categories of facility types are drawn from the IFMA Benchmark Reports #16 and #18
Table 1-1 (A): Indicators by Facility Type
Site Type Number by Type Square Footage by Type
Headquarters 1 19,281 Multi-use 16 292,395 Offices (Non-headquarters) 5 24,547 Other Use 14 177,604 Data Center 1 17,681 Customer Service 3 5,584 Total 40 537,092
Total Square Footage Maintained by Facilities Management Department 339,453
Executive Summary 1-17 Clermont County is considered a medium sized county in Ohio when evaluated on population levels. When compared to IFMA indicators, Clermont County’s facilities fall into the second to the largest grouping which encompasses departments managing 500,000 to 1 million square feet. Table 1-1(B)
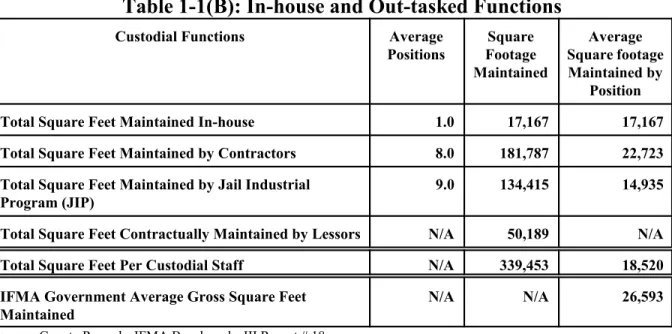
shows in-house and out-tasked activities and the square footage maintained by each, as well as the cost to maintain the County’s facilities by square foot.
Table 1-1(B): In-house and Out-tasked Functions
Custodial Functions Average
Positions Square Footage Maintained Average Square footage Maintained by Position
Total Square Feet Maintained In-house 1.0 17,167 17,167
Total Square Feet Maintained by Contractors 8.0 181,787 22,723
Total Square Feet Maintained by Jail Industrial Program (JIP)
9.0 134,415 14,935
Total Square Feet Contractually Maintained by Lessors N/A 50,189 N/A
Total Square Feet Per Custodial Staff N/A 339,453 18,520
IFMA Government Average Gross Square Feet Maintained
N/A N/A 26,593
Source: County Records, IFMA Benchmarks III Report # 18
The square footage maintained by Clermont County is low when compared to the IFMA average. Overall, the Department maintains between 3,870 and 9,426 less square feet per worker when compared to the IFMA average. Yet, Table 1-1(C) shows Clermont’s costs are below the IFMA average. Low costs are facilitated through low negotiated contract costs and the low costs to operate the JIP program.
Table 1-1(C): Facilities Management Department Costs
Per Square Foot and as a Percent of County Budget
Total 1999 Maintenance and Operations Expenditures Per Square Foot $3.95 Maintenance Expenditures by Component
- Maintenance - Utilities - Purchased Services $1.46 $1.76 $.70
IFMA Cost Study Average cost of Facility Operations $4.52
1999 Facilities Expenditures as a % of County General Fund Expenditures 5.2% IFMA Average Facility Expenditures as a % of General Fund Expenditures 8.5%
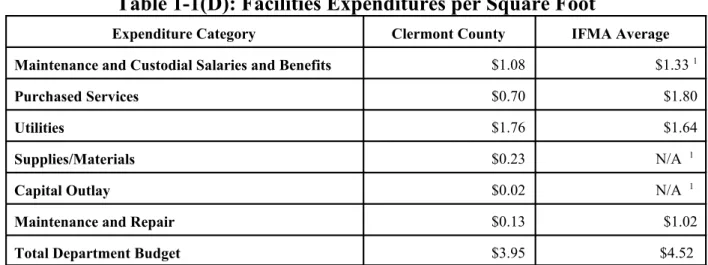
Executive Summary 1-18 Overall, Clermont County’s Facility Management Department expenditures are below or equal to IFMA averages in all categories. Table 1-1(D) below shows a breakdown of costs by square foot between Clermont County and the IFMA industry averages for government institutions.
Table 1-1(D): Facilities Expenditures per Square Foot
Expenditure Category Clermont County IFMA Average
Maintenance and Custodial Salaries and Benefits $1.08 $1.33 1
Purchased Services $0.70 $1.80
Utilities $1.76 $1.64
Supplies/Materials $0.23 N/A 1
Capital Outlay $0.02 N/A 1
Maintenance and Repair $0.13 $1.02
Total Department Budget $3.95 $4.52
Source: Office of Management and Budget
1 The IFMA average for maintenance and custodial includes salaries and benefits, supplies and materials and capital outlay. For
Background 2-1
Facilities
Background
Organizational Chart
The Department of Facilities Management (the Department) is responsible for maintaining Clermont County’s (the County) facilities. The director of facilities management is responsible for county-wide maintenance operations and reports to the county administrator. The facilities coordinator prioritizes day-to-day work order assignments and oversees the Department’s budget. The organizational structure and staffing levels are depicted in the following organizational chart.
Chart 2-1: Facilities Management Department
Background 2-2
Organizational Function
The Department is responsible for the operation and upkeep of the majority of the County’s buildings and grounds. The County uses contracted custodial providers to clean 16 of 40 locations, and utilizes minimum security jail inmates that make up the jail industrial program (JIP) to clean 9 locations. An in-house employee, the MW 1, cleans four locations. The remaining 11 sites are either maintained by building staff internally or are leased, in which case the lessor provides maintenance and custodial services. In FY 1999, the Department allocated approximately 14 percent of its total FY 1999 expenditures to contracted services.
The functions of the Facilities Management Department include maintaining and repairing the County’s facilities (except the Adult Detention Center, Sheriff’s Office and leased buildings), equipment and plants; constructing and renovating County facilities; space planning and design; managing supplies and logistics in support of all County departments; and providing custodial services and support.
The Department staff consists of the director, the facilities coordinator, the building maintenance supervisor, the computer aided facility management (CAFM) specialist, an air quality technician (HVAC specialist) and seven repair workers who report to the building maintenance supervisor. Additionally, the Department has one full-time secretary who provides clerical support primarily to the director and facilities coordinator.
Summary of Operations
The County facilities consist of 28 owned structures , 10 sites leased from private individuals and two vacant sites. The facilities range in size from 120,000 square feet (the Adult Detention Center/jail) to 1,030 square feet (the Milford Auto Title Building). The buildings were constructed between 1884 and 1998 and are housed primarily at three locations within the County: Downtown Batavia, Bauer Road and Filager Road. Although the total square footage of all 40 buildings is approximately 537,092 square feet, the Facilities Management Department is directly responsible for maintaining approximately 339,453 square feet. Custodial and maintenance work for the 10 leased buildings is contractually provided by the lease owners, and the Adult Detention Center and Sheriff’s Office are maintained by funds derived from the Sheriff’s Office budget.
While the MW1 and contracted custodial staff are assigned to specific buildings and clean each on a nightly basis Monday through Friday, the remainder of the maintenance staff is a mobile crew which travels from building to building. The maintenance staff is assigned jobs based on work order requests which are submitted by designated building contacts through fax or electronic mail to the Department secretary and facilities coordinator
.
Background 2-3
Staffing
The Facilities Management Department is comprised of 13 full-time employees (FTEs), consisting of the director, two supervisors, the CAFM specialist and air quality/HVAC technician, seven general maintenance repair workers and the secretary. The CAFM specialist develops and maintains computer generated drawings of buildings and systems, as well as space allocations by department. The air quality/HVAC technician position monitors County heating and electrical systems. The general maintenance repair 1 (MW1) position acts as a custodian and is assigned to clean four buildings. The three general maintenance repair 2 (MW2) positions perform general maintenance duties in the County. The three general maintenance repair 3 (MW3) positions consist of a plumber, carpenter and electrician. All of the general maintenance worker positions report to the building maintenance supervisor.
The contracted custodial staff, NSG Inc., averages between six and seven workers and one supervisor while Hoffman Inc. averages one worker. The jail inmates performing cleaning duties vary between 6 and 12 inmates and 2 correction officers. Currently, the jail inmates clean the Old and New Courthouse, the Heritage Building, the County Administration Building, the Sheriff’s Office and Adult Detention Center/jail, the Vehicle Garage, the Sign Shop and the Engineer’s Office. Staffing levels are shown in Table 2-1.
Background 2-4
Table 2-1: Number of Budgeted Employees (FTEs) for 1999-2000
Classification Administration1 Admin Office Mobile Crew Total FTEs
Director, Facilities Management Facilities Coordinator
Supervisor, Building Maintenance Secretary CAFM Specialist 1 1 1 1 1 0 0 0 0 0 1 1 1 1 1 Total Administration 5 0 5 Maintenance Maintenance Worker 2 (MW2) Maintenance Worker 3 (MW3) Air Quality Technician 2 (HVAC)
0 0 0 3 3 1 3 3 1 Total Maintenance 0 7 7 Other Maintenance Worker 1 (MW1) 1 0 1 Total Other 1 0 1 Total 6 7 13
Source: Facilities Management Department
Background 2-5
Key Statistics
Key statistics related to the maintenance and operation of the County are presented in Table 2-2. In addition, results from the International Facility Management Association (IFMA) Benchmarks III Research reports #16 and #18 are included in the table and throughout this report. These studies surveyed private and public facility managers across the country to gather information about the size and use of facilities, office space planning, staffing levels, expenditures and salaries for maintenance and custodial operations, and utility costs and usage. In general, the IFMA found that the majority of facilities management policy areas remain unwritten, the majority of facilities managers surveyed report charging back end users for facility management services. Security and computer usage were reported as the most troublesome departmental issues. In addition, the report suggests facility managers are doing more with less internal facility management staff and are exploring greater outsourcing opportunities. Best practices from nationally recognized local governments are also included to provide examples of potential enhancements to the Facilities Management Department. The IFMA Report #18 categorizes facility management by ten facility use definitions, including headquarters, multi-use, non-headquarter office space, customer service, and data center. In addition, the study categorizes the gross square footage (GSF) of facility types into five GSF sizes, ranging from less than 100,000 to greater than 1,000,000 gross square feet. Clermont County falls into the fourth largest category, with total gross square footage ranging between 500,001 to 1,000,000. This performance audit breaks down the County facilities into relevant categories presented in the IFMA Report #18. The categories are outlined in Table 2-2.
Background 2-6
Table 2-2: Indicators
Number of Sites Headquarters 1 Multi-use 2 Offices (Non-headquarters) 3 Other Use 4 Data Center 5 Customer Service 6 40 1 16 5 14 1 3Total County Gross Square Feet
Headquarters Multi-use Offices (Non-headquarters) Other Use Data Center Customer Service 537,092 19,281 292,395 24,547 177,604 17,681 5,584
Total Square Feet Maintained by Facility Management Department 333,453 7
Total Square Feet Cleaned By Custodial Staff (MW 1, Contractors and JIP’s-Average 18 positions)
Total Square Feet Maintained by Contractors (Average 8 positions)
Total Square Feet Maintained by Jail Industrial Program (JIP) (Average 9 Positions)
Total Square Feet Contractually Maintained by Lessors
333,369
181,787 134,415 8
50,189 Square Feet Maintained In-house (Maintenance Worker 1) (1 FTE)
Average Square Feet Maintained per Contractor Position Average Square Feet Maintained per JIP Position
IFMA Government Average Gross Square Feet Maintained
17,167 22,723 14,935
26,593 IFMA Cost Study Average cost of Facility Operations
FY 1999 Maintenance and Operations Expenditures Per Square Foot
- Maintenance
- Utilities (based on 486,903 square feet, which excludes 50,189 in leased space square footage) - Purchased Services $4.52 $3.95 $1.46 9 $1.76 $.70
FY 1999 Facilities Management Department Expenditures as a % of Total County General Fund Expenditures IFMA Cost Study Average
5.2% 8.5%
Source: Treasurer’s Office, Facilities Management Department
Note: The Department has verified square footage in 60 percent of the County’s facilities. Remaining square footage calculations are based on estimates provided by the Facilities Coordinator.
1 The Sheriff’s Office
2 Includes the Old and New Courthouses, the Adult Probation Annex, the Kahle and Heritage buildings, the Service Center/Facilities Management
Building, the Medical Social Services Building, the County Administration Building, the Municipal Courts-Civil Building, the Communications Center, the Juvenile Court Building, the Juvenile Detention Center, Permits Central, the CTC/TASC Building, Public Utility Building-Amelia, and the Domestic Relations Building
3 Includes the Prosecutor’s, Engineers’, Public Defender’s, and Municipal Court Probation Offices and the Professional Building
4 Includes the Coroner’s Office, Vehicle Garage, Adult Detention Center/Jail, Animal Shelter, the Wiseman Property, the Clergy Building, the Mental
Health Outpatient Center, three Family and Children’s First Buildings and the Agricultural Building, the Sign Shop, Recovery Center and Haskell Lane buildings.
5 Includes the Williamsburg Records Retention Center
6 Includes the Milford Auto Title, New Richmond Auto Title and Batavia Auto Title buildings 7 Excludes the ten leased buildings, Sheriff’s Office and Adult Detention Center.
8 Excludes the Sheriff’s Office and Adult Detention Center, which are maintained by funds derived from the Sheriff’s Office budget 9Includes salaries and benefits, materials and supplies, capital outlay and maintenance and repair
Background 2-7
Financial Data
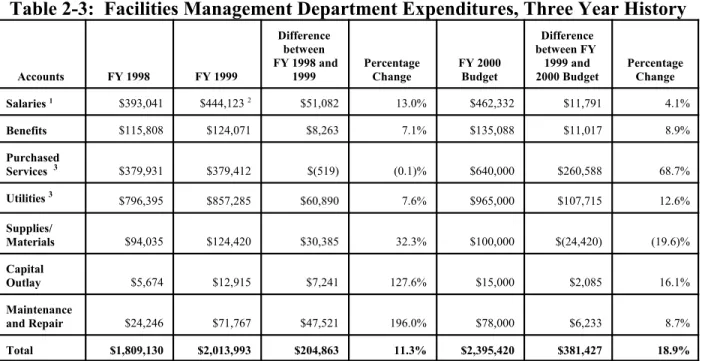
The following table shows expenditures to maintain and operate the County’s facilities for FY 1998 and FY 1999 and budgeted expenditures for FY 2000.
Table 2-3: Facilities Management Department Expenditures, Three Year History
Accounts FY 1998 FY 1999 Difference between FY 1998 and 1999 Percentage Change FY 2000 Budget Difference between FY 1999 and 2000 Budget Percentage Change Salaries 1 $393,041 $444,123 2 $51,082 13.0% $462,332 $11,791 4.1% Benefits $115,808 $124,071 $8,263 7.1% $135,088 $11,017 8.9% Purchased Services 3 $379,931 $379,412 $(519) (0.1)% $640,000 $260,588 68.7% Utilities 3 $796,395 $857,285 $60,890 7.6% $965,000 $107,715 12.6% Supplies/ Materials $94,035 $124,420 $30,385 32.3% $100,000 $(24,420) (19.6)% Capital Outlay $5,674 $12,915 $7,241 127.6% $15,000 $2,085 16.1% Maintenance and Repair $24,246 $71,767 $47,521 196.0% $78,000 $6,233 8.7% Total $1,809,130 $2,013,993 $204,863 11.3% $2,395,420 $381,427 18.9%
Source: Clermont County Facilities Management Department
1 Includes overtime, temporary workers and costs associated with retirement buyouts. This category also includes salaries and benefits for the MW 1 who provides custodial services to two leased buildings.
2 FY 1999 had an additional payroll totaling approximately $17,081 which was backed out of the calculation to better reflect the 26 pay periods in FY 1998 and FY 2000 budget.
3 Excludes costs for leased buildings.
An explanation for some of the more significant variances in Table 2-3 are as follows:
! An increase in salaries in FY 1999: The County awarded $12,000 in merit pay bonuses in FY 1999 for completing a re-modeling project under budget. One employee received $10,000 in retirement benefits and two part-time employees converted to full-time status.
! An increase in purchased services in the FY 2000 budget: The primary reason for the significant increase in the FY 2000 purchased services budget was because the County shifted approximately $200,000 in building and property insurance from an insurance cost center fund into the Facilities Management Department cost center fund in FY 1999. Both cost center funds are part of the general fund.
Background 2-8 ! An increase in utilities for FY 1999 and FY 2000 budget: The County anticipated
increased costs for gas and electricity. The winter of 1998 was mild and the County budgeted for harsher weather conditions. In addition, the County budgeted for increased utility costs due to the installation of additional beds at the Adult Detention Center in FY 1999. Also, the County purchased a new building to act as a planning building in FY 1999 that was occupied in April 2000, causing a slight increase in overall utility expenditures.
! An increase in capital outlay and maintenance and repair for FY 1999. In FY 1999, the County upgraded its snow removal equipment and installed upgraded cooling towers at the Permit Central building, causing increased capital outlay costs. In addition, the county was required to spend funds on fire prevention equipment and elevator maintenance due to the findings of state mandated inspections. The department also expended funds repairing HVAC systems, vehicles and general building repairs.
Performance Measures
The following is a list of performance measures that were used to conduct the analysis of the County’s Facilities Management Department operations:
! Utilization of staffing resources
! Appropriateness of lines of authority and responsibility ! Efficiency and effectiveness of custodial services ! Effectiveness of facilities maintenance
! Utilization of existing facilities ! Efficiency of out-tasked operations
!
Effectiveness of long range facilities planning! Effectiveness of current needs assessment and prioritization processes and procedures ! Adequacy of operating policies and procedures
! Adequacy of preventive maintenance system ! Effectiveness of energy conservation programs
Background 2-10 This page intentionally left blank.
Facilities Management Department Operations 3-1
Findings/Commendations/Recommendations
Staffing
F3.1 The Facilities Management Department reports to the County administrator and currently
consists of 13 full-time equivalents (FTEs), including a director, facilities coordinator, facilities supervisor, computer aided facilities management (CAFM) employee, administrative assistant and eight maintenance workers. In addition, the County has reassigned a management systems specialist with the County Commissioners Office to act as a management systems specialist within the Department. The management systems specialist will help to implement computer software programs for the Department and will assist in overseeing the Facilities Management Department. The management systems specialist will start in Summer 2000. The following is a brief description of the responsibilities of administrative members of the Facilities Management Department staff according to job
descriptions and interviews with personnel. The majority of the Department’s job
descriptions have not been updated in at least 10 years. !
! !
! Management Systems Specialist: The management systems specialist, in conjunction with the facilities director, serves as an overall leader for the Department and is responsible for developing and implementing a cost allocation time tracking system for the Facilities Management Department. In addition, the position is responsible for overseeing the quality of a time tracking and work order system and assists in problem resolution, training of necessary staff and planning, implementing and inspecting capital improvement projects. The management systems specialist is also responsible for developing a preventive maintenance program and fixed asset inventory system for facilities management.
! ! !
! Facilities Management Director: The facilities management director primarily oversees energy utilization and de-regulation issues, building leases and telecommunications needs for the County’s facilities.
! ! !
! Facilities Coordinator: This position assists the director in researching and compiling data for report preparation, developing new procedures and programs, overseeing the computer aided facilities management (CAFM) position, preparing the department’s annual appropriation, scheduling personnel for training, and scheduling and coordinating requests for service. This position was created approximately two years ago to replace the business coordinator who acted as a liaison between the Office of Management and Budget (OMB) and the Department.
Facilities Management Department Operations 3-2 !
! !
! Building Maintenance Supervisor: According to the job description, this position supervises and assists the facilities management director with all assigned skilled and unskilled maintenance staff and contractors. However, this position currently reports to the facilities coordinator and acts as the field supervisor of all in-house maintenance
and custodial employees. In conjunction with the facilities coordinator, the building
maintenance supervisor prepares annual employee evaluations for all maintenance staff.
! Computer Aided Facilities Management (CAFM) Specialist: The CAFM specialist is responsible for developing and maintaining computer aided design (CAD) drawings of buildings and systems, and space allocations of the County’s facilities by department. The CAFM specialist reports to the facilities coordinator. The position is also responsible for maintaining a graphical user interface (GUI) to a fixed assets database, developing and maintaining a GUI for preventive maintenance procedures, and performing data entry to maintain accurate records and maximize efficiency of operations.
! ! !
! Administrative Secretary:This position reports to the facilities director and facilities coordinator. This employee functions as a liaison between building staff requesting service and the Department, manages employee files and enters employee payroll and work order information into the time tracking system.
F3.2 The Facilities Management Department administrative employees do not fulfill the tasks
indicated in the job descriptions. For example, the facilities director position description states the director supervises workers engaged in general building maintenance and administers the annual operating budget for the Department. These duties are currently performed by the building supervisor and facilities coordinator, respectively. On a daily basis, the director oversees energy conservation and de-regulation projects in the County, two areas not outlined in the position description. Also, the facilities coordinator prepares the Department’s annual appropriation instead of the director, and the facilities supervisor reports to the coordinator rather than reporting to the facilities director, as outlined in the respective position descriptions. Because the work being performed does not meet the criteria of the job description, some tasks are not completed, such as fixed asset tracking and preventive maintenance, while others may be duplicated, such as contract compliance monitoring and personnel scheduling and evaluating.
R3.1 The County should determine which tasks are most appropriate for each administrative
employee within the Facilities Management Department. Job descriptions for the Facilities Management Department should be updated to accurately reflect the roles and responsibilities of each position in the Department and should be reviewed on a regular basis. Doing so will
Facilities Management Department Operations 3-3 provide the County with the foundation for establishing internal job equity and will clearly outline specific responsibilities, levels of decision-making and knowledge, skills and ability requirements. Monitoring the work being performed against the formal job description will help ensure that all important tasks are completed, reduce duplication of effort and should be used as the basis for evaluation.
F3.3 The essential responsibilities of the CAFM specialist do not appear to have been fulfilled. The
CAFM specialist’s primary duties are to develop and maintain computer generated drawings of buildings, systems and furnishings and enter numerical data to ensure proper building plans, dimensions and measurements. About 60 percent of the County’s facilities were placed on the CAD system by a consultant in 1998. Two additional buildings under Facility Management control were recently added to the CAD system by the CAFM specialist, but several other buildings used by the County have not been added to the CAD system. In addition, the CAD system contains incomplete data on County buildings such as the Service Center/Facilities Management Building, which has three floors of unused space but is depicted in the CAD system as consisting of only the basement level. Incomplete CAD data has resulted in the Facilities Management Department having to estimate space utilization in many of its facilities. Because square footage analysis is partly used by the County to determine annual Department appropriations, and is an important component of space utilization studies (see building capacity and utilization subsection), it is important that the County determine the actual square footage existing in the facilities.
In addition, the CAFM specialist recently began implementing a fixed asset database through the CAD system that includes entry of all fixed assets in the County’s facilities. The fixed assets database includes furniture and items needing preventive maintenance, such as heat pumps, fire extinguishers and smoke alarms. The CAFM specialist records all items in the building manually, then reconciles the date of delivery of the item, cost, purchase order number and ten-year depreciation with a purchasing clerk in the OMB, and finally records them in a fixed asset module of the CAD program. The CAFM specialist has completed recording fixed assets in only two of the County’s facilities, stating that problems with the software and the manual process currently used has led to delays.
R3.2 The County should ensure that the CAFM specialist has the necessary computer skills to
complete the required duties of the job. The CAFM specialist should complete CAD drawings showing utilized space for all of the County’s facilities and includes the completed document
as part of a comprehensive, long-range facilities plan as outlined in R3.11. Because essential
job duties have not been addressed, the County should consider having the CAFM specialist report directly to the management systems specialist and should consider examining additional training opportunities for the position. The management systems specialist should work closely with the CAFM specialist to ensure these responsibilities are completed.
Facilities Management Department Operations 3-4 In addition, the County should designate department representatives to compile what the County considers to be fixed assets. The fixed asset database should be tied to the County’s accounting system to ensure that all items designated as fixed assets are captured and tagged as soon as they are received by the County departments. For example, the County may consider furniture, furnishings, instruments, and machines that cost at least $500 as a single unit and do not lose their identity when incorporated into a more complex unit as fixed assets. The County should ensure that fixed assets are affixed with a bar code or pre-numbered tag that can be used to account for the asset in the fixed asset system. Proper inventory control over the County’s assets can aid in establishing adequate insurance coverage and promote accountability. Furthermore, accurate inventory records allow the County to assess its needs when procuring fixed assets, thereby reducing the risk of purchasing unnecessary items.
F3.4 The County employs one administrative secretary who appears to provide adequate support
to all areas of the Facilities Management Department. The secretary spends the majority of time inputting employee workday and payroll information into the time tracking system, serving as a liaison between building contacts requesting service and Department staff, ensuring purchase orders for supplies purchased by the Department are paid, and updating badges and employee ID numbers, which are kept in a database in the Facilities Management Department.
F3.5 The County employs more full time administrative employees, excluding clerical staff, per
maintenance employee than similar sized counties. Table 3-1 compares administrative staff,
including directors, coordinators and supervisors, to the number of custodial and maintenance employees supervised, and indicates that Clermont County employs the highest number of administrators to custodial and maintenance employees among seven similar sized counties: Clark, Greene, Lake, Licking, Medina, Portage and Warren. Even in cases where administrative employees monitor contracted services (Clark, Green, Licking and Medina),
the Department has the lowest ratio of administrators to supervised staff. Table 3-1 also
compares salary levels of the various director’s or building superintendent’s of similar sized counties.