The
Integrated
Inventory
Management
with
Forecast
System
Noor‐Ajian Mohd‐Lair *1, Chin‐Chong Ng 2, Abdullah Mohd‐Tahir, Rachel Fran Mansa, Kenneth Teo Tze Kin
1School of Engineering and Information Technology, Universiti Malaysia Sabah, Jalan UMS,
88400 Kota Kinabalu, Sabah, Malaysia
*1[email protected]; 2[email protected]
Abstract
Inventory Management System is very important for driving a company into better achievement. The main objective of inventory management is to keep the inventory level as low as possible and meet customers’ demand. This project centers on development of the computerized integrated inventory management and forecast system for the Guan Lee Sdn Bhd. In this project, the exponential smoothing is selected to predict demands as inputs to control the computerised inventory management system. The integrated system was written using the Visual Basic 2008. This integrated inventory management and forecast system has the ability to forecast while effectively control on inventory level with six specific features of alert, creation, inventory, transfer, search and reports. Performance of the system was analyzed with three types of forecast value (actual and adjusted forecast values). From the results, the actual forecast values tend to move toward the ideal one. Thus, the forecast system is proved to be reliable and accurate. The suggested improvements are auto recording of historical data, attachment of picture to each item, and sending notification through text message.
Keywords
Inventory Management System; Forecast Technique; Exponential
Smoothing; Mean Absolute Deviation
Introduction
Inventories are materials and supplies that a business
or institution carries for either sale or providing inputs
or supplies to production process (Wildm, 2002).
Improving the inventory management system enables
a company to keep track on their inventory level
consistently while supplies customers’ needs and
maintains their inventory level as low as possible with
minimum cost. Selection and utilization of an
appropriate method and software for a computerized
inventory management system is very important for
company in order to be more efficient.
This project centered on improving the Guan Lee Sdn
Bhd inventory management strategies. The company
controls the inventory manually without any
inventory management system. Few major problems
were incurred due to mis‐managed inventory. The
time for stocks being used up and re‐reorder, is
difficult to be determined by the company. The annual
demand for the company is uncertain and hard to be
predicted precisely, as it strongly depends on season,
marketing, management and etc. The monthly
quantity ordered by the company is imprecise, and
always causes excessive or insufficient stocks.
Therefore, the objective of this project is to develop an
efficient computerized inventory management system
that helps the company to control and manage the
inventories through efficient forecasting system. Review of Literature
In inventory management, various techniques have
been used to manage the stock. For instance, the step
function can be used to represent many real‐life
situations in which the storage items can be classified
into different ranges, each with its distinctive unit
holding cost (Alfares, 2007). Alfares (2007) introduced
two types of discontinuous step functions to represent
these holding costs which are retroactive increase and
incremental increase holding costs. For retroactive
increase, a uniform holding cost that depends on the
length of storage is used. For incremental increase,
higher storage cost rates is applied to storage in later
periods. By using these step functions, the respective
total inventory cost (TIC) coupled with the ordering
cost is then developed for further calculation in further
research.
The Croston’s method used to predict the inventories
with intermittent demand is an adaptation of the
exponential smoothing proposed by Croston in 1972,
involving separate simple exponential smoothing (SES)
forecasts on the demand size and the demand interval
Croston’s method was introduced by Synder (2002),
called the adaptive variance version (AVAR). Synder
proposed modifications to overcome certain
implementation difficulties in forecasting slow and
fast moving inventories. In the paper, Synder
introduced variance instead of mean absolute
deviation (MAD) for measuring variability in a time
series, and a second smoothing parameter β to define
how the variability changes over time, for Croston’s
method.
Another new method proposed by Teunter et al.
(2011), is called TSB (derived from authers’ name),
which is a modification of Croston’s method as well.
In that modification, exponential smoothing was
utilized to update the demand probability instead of
the demand interval. The estimate of the probability of
occurrence is updated at eavh time period. The
estimate of the demand size is updated at the end of
periods with positive demand. Then, two different
smoothing constants were applied because the
demand probability is updated more often than the
demand size. Thus, the product of the estimates for
demand size and demand probability provides the
forecast of the demand per period.
Periodic review system (R,S) is another type of
inventory management policy used to deal with
highly variable and irregular demand, where R stands
for the review period while S is the base stock. At each
review instance, the order quantity for any item is S‐IP,
where IP is the inventory position of that item, namely
the stock is either physically available or has been
previously ordered but not yet received. In 2010,
Nenes et al.(2010) adopted and implemented the
periodic review system (R,S) to solve the problem of
managing the inventories of thousands of different
items, supplied by more than 20 European and Asian
manufacturers and sold to a large number of different‐
type customers. The lead time for every supplier is
unlike to each other’s. Thus, those researchers use this
method as the review period R can be used regarding
to all different suppliers.
In addition, the bootstrap is a method that creates
pseudo‐data by sampling with replacement from the
individual observations (Willemain et al., 2004). In the
problem of forecasting lead‐time demand, Willemain
et al. (2004) adopted this method, and developed a
modified bootstrap in response to three difficult
features of intermittent demand, which are
autocorrelation, frequent repeated value, and
relatively short period. In their research, Markov
model was used to generate a sequence of
zero/nonzero value over forecast horizon. Summing
the forecast over each period of the lead time gives one
forecast of lead time demand (LTD). Thus, the process
was repeated until they have 1000 bootstrap forecasts
estimating the entire distribution of LTD.
A method called fuzzy set theory was also applied in
inventory problem, which can be found in the field of
artificial intelligence either. Fuzzy set theory is
concerned with the rules for computing the combined
possibilities over expressions that contain fuzzy
variable (Luger, 2005). For instance, a model
constructed by Kao and Hsu (2002) for the case of
fuzzy demand, was adopted as fuzzy number that was
described by a membership function. After that, the
total cost was computed from the membership
function in term of fuzzy numbers for three different
cases. As fuzzy number can be ranked, then Yager’s
method was applied for ranking the fuzzy numbers.
At the end, a quantity with the smallest fuzzy cost
(optimal quantity) was calculated.
Decomposition procedures are used in time series to
describe the trend and seasonal factors in a time series.
By using decomposition procedures, seasonal
component of time series, which influences the
original time series, can be removed. For instances,
Gardner Jr. and Diaz‐Saiz (2002) conducted their
research coupled with an additive decomposition
procedure for seasonal adjustment of inventory
demand series at a large US auto parts distributor,
BPX. In adjustment of seasonal series, first of all, the
nature of demand series was identified on whether it
is seasonal or not by comparing the variance of
original series with the seasonally‐adjusted series, and
then additive adjustment was applied instead of
multiplicative adjustment on the series.
This research attempts to integrate the inventory
management and forecast system in contolling and
managing the inventory for a company. Specifically,
the exponential smoothing forecast technique will be
integrated into a computerised inventory management
system.
The Case Study
The Guan Lee Sdn Bhd commenced business in 1998
as a store selling daily necessities at Bayan Lepas,
Penang. The inventory of the store is practically well
managed as the volume of the goods is fair enough to
be arranged systematically. After seven years, the
company expanded their core business to sell bicycle.
as a major supplier of bicycle of that area even further.
At that time, the volume of inventory was very high
and messy, and tracking the amount of each good
manually was no longer feasible. In 2007, the company
moved the business of mat from the first store to
another new store, with the focus on providing mat
only. Currently, the Guan Lee Sdn Bhd owns 3 stores
and a storehouse at Bayan Lepas, Penang. The
storehouse is fully occupied with the inventory for the
3 stores with very limited space. The entire storehouse
is managed solely by the owner, without any
computerised inventory management system.
Currently, the Guan Lee Sdn Bhd is run by seven
peoples consisting of one director, three supervisors
and three workers. The storehouse consists of four
sections, three sections at first floor, which are A, B,
and C from front entrance to rear entrance, and the
last section at second floor, which is the D section. In
order to specify the location of the items within the
section, each section is divided again into five sub‐
sections, rangeing from 1 to 5 subsections.
The Integrated Inventory Management and Forecast System
The Integrated Inventory Management and Forecast
System consists of two distinct system; the inventory
management system and the demand forecast system.
Basically, the inventory management system offers 6
features (alert, transfer, creation, inventory, search,
reports) for the user to manipulate the inventory of the
storehouse. With the system, user is able to store the
quantity of each item inside the storehouse with
complete information such as location, category and
etc. Plus, user will be notified by the system itself as
critical circumference occurs such as extremely low
inventory level.
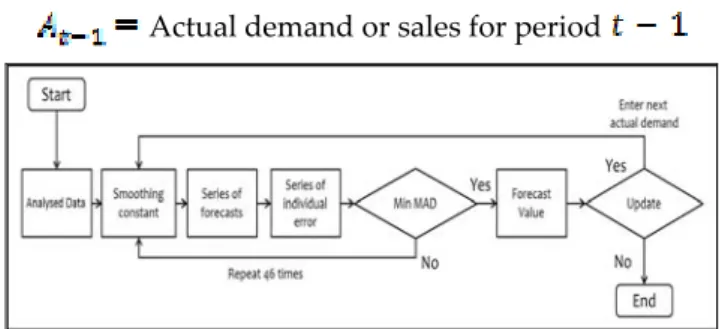
The demand forecast system anticipates the future
demands for the company. The system uses the
exponential smoothing technique to predict the future
demands which are then used as an inputs for the
quantity to be ordered by the company. The general
structure of the forecast system is shown in Fig. 1. The
formula used in the exponential smoothing technique
is shown below:
Where,
Forecast for period Forecast for period
Smoothing constant
Actual demand or sales for period
FIG. 1 GENERAL STRUCTURE OF THE FORECAST SYSTEM
Performance Analysis of the Forecast System
The performance of the system was analysed on 3
selected items with its historical monthly demands (12
months), to determine whether the forecast values
generated with minimum mean absolute deviation
(MAD) value are reliable or not. A simulation of the
forecasting function of the system was conducted,
within the 12 months of year 2010 and 2011, for
analysis. In addition, 3 types of forecast values (actual,
maximum and minimum adjusted forecast values)
were considered together with the actual demand.
A simulation of the forecasting function of the system
was conducted by entering the actual demand one by
one to obtain the individual forecast value (called the
actual forecast) for each month before another. Each
actual demand entered was computed 46 times to
obtain a smoothing constant with minimum MAD,
thus the constant for every month might be different
from each other. Apart from the actual forecast values,
the adjusted forecast values were also obtained by
entering all the actual demands in one time. Once all
the actual demands were entered, the entire forecast
values (adjusted forecast values) were then computed,
by adjusting the forecast values in the 12 months until
the one with minimum MAD (called the ideal forecast),
and another with maximum MAD (called the
undesired forecast).
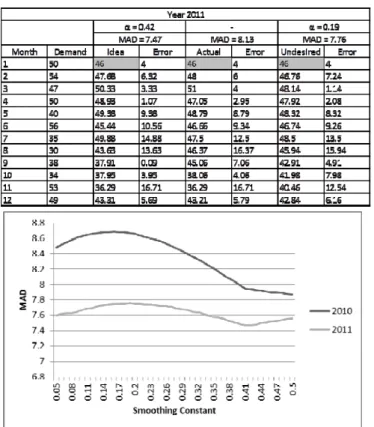
Table 1 shows the history data along with the forecast
values and individual error for 2011. The value of the
initial forecast, which is 46 in January is computed
from the exponential smoothing equation. The
smoothing constant for the forecast technique used is
0.42.
For bicycle with size of 26 inches, according to Fig. 2,
both MAD of year 2010 and 2011 show a parabolic
pattern with maximum point toward left side, but they
converge toward right side, with an approximately
same turning point. In year 2010, MAD rose to the
point, but continued to decrease to a point where
MAD is 0.5 at smoothing constant of 0.5. However, in
year 2011, same behaviour as year 2010 at the
beginning, but there is a minimum MAD at that
turning point, which is 0.42 at smoothing constant of
0.42.
TABLE 1 FORECAST VALUES AND INDIVIDUAL ERRORS OF 26 INCHES
BICYCLE (2011)
FIG. 2 MAD VERSUS SMOOTHING CONSTANT OF 26 INCHES
BICYCLE
FIG. 3 COMPARISONS BETWEEN DEMANDS AND 3 TYPES OF
FORECAST VALUES FOR THE 26 INCHES BICYCLE (2011)
Fig. 2 shows the graph of MAD versus the smoothing
constant for the 26 inches bicycle. This graph is plotted
according to the data generated from the inventory
system internally as well. Fig. 3 shows the
comparisons between demands and three types of
forecast values for the 26 inches bicycle, in the year
2010 and 2011 respectively. According to Fig. 3, all the
forecast values have fine smoothing effect and
sensitivity. However, the MAD of the undesired
forecast values is lower than the actual one, which
might due to the disturbance of the actual forecast
pattern in September. In addition, the actual forecast
values for 2011 tend to move toward the ideal one as
well.
From the results, the overall actual forecast values
tend to move toward the ideal one which is
significantly closed to either, even the MAD is greater
than the undesired one. From that, this result proved
that the forecast system is reliable and accurate for
forecasting. Apart from that, the pattern of the forecast
values is not clearly observed, as the range of period is
limited within 12 months only. Thus, a wider range of
period should be considered for further analysis, such
as weekly or even daily with fast moving item. Lastly,
from this analysis, the results indicated that a seasonal
demand is much more compatible with the
exponential smoothing model, as the demand pattern
has a trend. Conclusions
The developed integrated inventory management and
forecast system offers fast response to current
inventory on hand at any time. User is able to
immediately responses to customer on whether a
particular requested item is available or not. Besides
that, forecasting, summarizing data and analysis are
easily performed with aid of the system. Data can be
fully accessable for user to gather all information
whenever needed for any purpose such as analysis or
forecasting. In addition, user can identify which
product the best seller from the data.
In addition, the developed system is able to function
well as the actual forecast values tend to move toward
the ideal one’; as well to generate a smoothing
constant with the minimum MAD within the
smoothing constant ranging from 0.45 to 0.50, for
every actual demand entered by the user. The forecast
system is reliable and accurate according to the results.
However, the developed system does have limitations;
one of which discovered from this system, is lack of
visualized effect on a particular item, or being difficult
to be identified from item code or name. Thus, a
picture should be attached to every item to improve
effectiveness of the system. In addition, the system is
still lack of automated feature, and user has to
intentionally manipulate the entire system without
features such as making order automatically, or
sending notification through text message and etc will
be useful.
ACKNOWLEDGMENT
The authors would like to acknowledge the Malaysian
Ministry of Higher Learning for the FRGS grant
awarded for this project.
REFERENCES
Alfares H. K. “Inventory model with stock‐level dependent demand rate and variable holding cost.” International Journal of Production Economics, 108 (2007): 259‐265. Gardner Jr, E. S., and Diaz‐Saiz, J. “Seasonal adjustment of
inventory demand series: a case study.” International Journal of Forecasting, 18 (2002): 117‐123.
Kao, C., and Hsu, W.K. “A single‐period inventory model with fuzzy demand.” Computer and Mathematics with Applications, 43 (2002): 841‐848.
Luger, G.F. Artificial Intelligence. 5th Ed. London: Pearson
Education, 2005.
Nenes, G., Panagiotidou, S., and Tagaras, G. “Inventory management of multiple items with irregular demand: a case study.” European Journal of Operational Research, 205 (2010): 313‐324.
Synder, R. “Forecasting sales of slow and fast moving inventories.” European Journal of Operational Research, 140 (2002): 684‐699.
Teunter, R. H., Syntetos, A. A., and Babai, M. Z. “Inttermittent demand: linking forecasting to inventory obsolescence.” European Journal of Operational Research, 214 (2011): 606‐615.
Wildm T. Best Practice in Inventory Management. 2nd Ed. Burlington, New York: Elsivier Butterworth‐Heinemann, 2002.
Willemain, T.R., Smart, C.N., and Schwarz, H. F. “A new approach inttermittent demand for service parts inventories.” Journal of Forecasting, 20 (2004): 375 – 387.
Dr Noor‐Ajian Mohd‐Lair is a senior lecturer in the Mechanical Engineering Program of Universiti Malaysia Sabah (UMS). She graduated with a Bachelor of Science in Industrial Engineering from University of Missouri‐Columbia (MU), USA in 1995 and Master of Mechanical Engineering from Universiti Teknology Malaysia, Malaysia in 2003. She received her Doctor of Philosophy (PhD) degree from University of South Australia (UniSA), Australia in 2009. Dr Noor‐Ajian areas of expertise include Supply Chain Management, Production Planing and Contol, Plant Optimisation and Operation Research using Simulation Modeling and Artificial Intelligent.