Chapter 5
Objects and
Graphics
Objectives
• To understand the concept of objects and how they can be used to simplify programs.
• To be familiar with the various objects available in the graphics library.
• To be able to create objects in programs and call appropriate methods to perform graphical computations.
• To understand the fundamental concepts of computer graphics, especially the role of coordinate systems and coordinate transformations.
• To understand how to work with both mouse and text-based input in a graphical programming context.
• To be able to write simple interactive graphics programs using the graphics library.
5.1
Overview
So far we have been writing programs that use the built-in Python data types for numbers and strings. We saw that each data type could represent a certain set of values, and each had a set of associated operations. Basically, we viewed the data as passive entities that were manipulated and combined via active opera-tions. This is a traditional way to view computation. To build complex systems,
however, it helps to take a richer view of the relationship between data and operations.
Most modern computer programs are built using anobject-oriented(OO) ap-proach. Object orientation is not easily defined. It encompasses a number of principles for designing and implementing software, principles that we will re-turn to numerous times throughout the course of this book. This chapter pro-vides a basic introduction to object concepts by way of some computer graphics. Graphical programming is a lot of fun and provides a great vehicle for learn-ing about objects. In the process, you will also learn the principles of computer graphics that underlie many modern computer applications. Most of the ap-plications that you are familiar with probably have a so-called Graphical User Interface (GUI) that provides visual elements like windows, icons (representa-tive pictures), buttons and menus.
Interactive graphics programming can be very complicated; entire textbooks are devoted to the intricacies of graphics and graphical interfaces. Industrial-strength GUI applications are usually developed using a dedicated graphics pro-gramming framework. Python comes with its own standard GUI module called
Tkinter. As GUI frameworks go, Tkinter is one of the simplest to use, and Python is a great language for developing real-world GUIs. Still, at this point in your programming career, it would be a challenge to learn the intricacies of any GUI framework, and doing so would not contribute much to the main objectives of this chapter, which are to introduce you to objects and the fundamental princi-ples of computer graphics.
To make learning these basic concepts easier, we will use a graphics library (graphics.py) specifically written for use with this textbook. This library is a wrapper around Tkinter that makes it more suitable for beginning programmers. It is freely available as a Python module file1 and you are welcome to use it as you see fit. Eventually, you may want to study the code for the library itself as a stepping stone to learning how to program directly in Tkinter.
5.2
The Object of Objects
The basic idea of object-oriented development is to view a complex system as the interaction of simplerobjects. The word objectsis being used here in a specific technical sense. Part of the challenge of OO programming is figuring out the
1See Appendix B for information on how to obtain the graphics library and other supporting
5.3. Simple Graphics Programming 125
vocabulary. You can think of an OO object as a sort of active data type that combines both data and operations. To put it simply, objects know stuff (they contain data), and theycan do stuff(they have operations). Objects interact by sending each other messages. A message is simply a request for an object to perform one of its operations.
Consider a simple example. Suppose we want to develop a data processing system for a college or university. We will need to keep track of considerable information. For starters, we must keep records on the students who attend the school. Each student could be represented in the program as an object. A student object would contain certain data such as name, ID number, courses taken, campus address, home address, GPA, etc. Each student object would also be able to respond to certain requests. For example, to send out a mailing, we would need to print an address for each student. This task might be handled by aprintCampusAddress operation. When a particular student object is sent the
printCampusAddressmessage, it prints out its own address. To print out all the addresses, a program would loop through the collection of student objects and send each one in turn theprintCampusAddressmessage.
Objects may refer to other objects. In our example, each course in the college might also be represented by an object. Course objects would know things such as who the instructor is, what students are in the course, what the prerequisites are, and when and where the course meets. One example operation might be
addStudent, which causes a student to be enrolled in the course. The student being enrolled would be represented by the appropriate student object. Instruc-tors would be another kind of object, as well as rooms, and even times. You can see how successive refinement of these ideas could lead to a rather sophisticated model of the information structure of the college.
As a beginning programmer, you’re probably not yet ready to tackle a college information system. For now, we’ll study objects in the context of some simple graphics programming.
5.3
Simple Graphics Programming
In order to run the graphical programs and examples in this chapter (and the rest of the book), you will need a copy of the filegraphics.py that is supplied with the supplemental materials. Using the graphics library is as easy as placing a copy of thegraphics.pyfile in the same folder as your graphics program(s). Alternatively, you can place it in a system directory where other Python libraries are stored so that it can be used from any folder on the system.
The graphics library makes it easy to experiment with graphics interactively and write simple graphics programs. As you do, you will be learning principles of object-oriented programming and computer graphics that can be applied in more sophisticated graphical programming environments. The details of the
graphicsmodule will be explored in later sections. Here we’ll concentrate on a basic hands-on introduction to whet your appetite.
As usual, the best way to start learning new concepts is to roll up your sleeves and try out some examples. The first step is to import the graphics module. Assuming you have placedgraphics.pyin an appropriate place, you can import the graphics commands into an interactive Python session.
>>> import graphics
Next we need to create a place on the screen where the graphics will appear. That place is agraphics windoworGraphWin, which is provided by thegraphics
module.
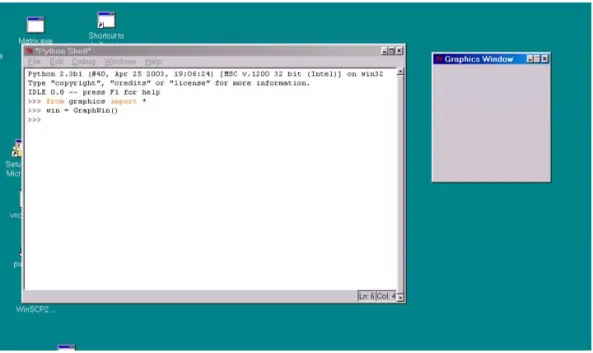
>>> win = graphics.GraphWin()
This command creates a new window on the screen. The window will have the title “Graphics Window.” The GraphWin may overlap your Python interpreter window, so you might have to resize the Python window to make both fully visible. Figure5.1shows an example screen view.
The GraphWin is an object, and we have assigned it to the variable called
win. We can manipulate the window object through this variable, similar to the way that file objects are manipulated through file variables. For example, when we are finished with a window, we can destroy it. This is done by issuing the
closecommand.
>>> win.close()
Typing this command causes the window to vanish from the screen.
We will be working with quite a few commands from thegraphicslibrary, and it gets tedious having to type the graphics. notation every time we use one. Python has an alternative form ofimportthat can help out.
from graphics import *
Thefrom statement allows you to load specific definitions from a library mod-ule. You can either list the names of definitions to be imported or use an as-terisk, as shown, to import everything defined in the module. The imported commands become directly available without having to preface them with the module name. After doing this import, we can create aGraphWinmore simply.
5.3. Simple Graphics Programming 127
Figure 5.1: Screen shot with a Python window and a GraphWin.
win = GraphWin()
All of the rest of the graphics examples will assume that the entire graphics
module has been imported usingfrom.
Let’s try our hand at some drawing. A graphics window is actually a collec-tion of tiny points calledpixels (short for picture elements). By controlling the color of each pixel, we control what is displayed in the window. By default, a
GraphWinis 200 pixels tall and 200 pixels wide. That means there are 40,000 pixels in theGraphWin. Drawing a picture by assigning a color to each individ-ual pixel would be a daunting challenge. Instead, we will rely on a library of graphical objects. Each type of object does its own bookkeeping and knows how to draw itself into aGraphWin.
The simplest object in thegraphicsmodule is aPoint. In geometry, a point is a location in space. A point is located by reference to a coordinate system. Our graphics objectPointis similar; it can represent a location in a GraphWin. We define a point by supplyingx andy coordinates(x, y). The xvalue represents the horizontal location of the point, and theyvalue represents the vertical.
corner of the window. Thus x values increase from left to right, andy values increase from top to bottom. In the default200x200GraphWin, the lower-right corner has the coordinates (199,199). Drawing a Point sets the color of the corresponding pixel in theGraphWin. The default color for drawing is black.
Here is a sample interaction with Python illustrating the use ofPoints:
>>> p = Point(50,60) >>> p.getX() 50 >>> p.getY() 60 >>> win = GraphWin() >>> p.draw(win) >>> p2 = Point(140,100) >>> p2.draw(win)
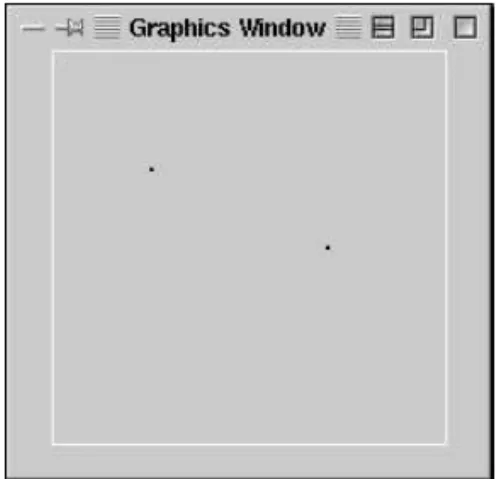
The first line creates a Pointlocated at(50,60). After the Pointhas been cre-ated, its coordinate values can be accessed by the operations getX and getY. A Point is drawn into a window using the draw operation. In this example, two different point objects (pandp2) are created and drawn into theGraphWin
calledwin. Figure5.2shows the resulting graphical output.
Figure5.2: Graphics window with two points drawn.
In addition to points, the graphics library contains commands for drawing lines, circles, rectangles, ovals, polygons and text. Each of these objects is
cre-5.4. Using Graphical Objects 129
ated and drawn in a similar fashion. Here is a sample interaction to draw various shapes into aGraphWin:
>>> #### Open a graphics window >>> win = GraphWin(’Shapes’)
>>> #### Draw a red circle centered at point (100,100) with radius 30 >>> center = Point(100,100)
>>> circ = Circle(center, 30) >>> circ.setFill(’red’)
>>> circ.draw(win)
>>> #### Put a textual label in the center of the circle >>> label = Text(center, "Red Circle")
>>> label.draw(win)
>>> #### Draw a square using a Rectangle object >>> rect = Rectangle(Point(30,30), Point(70,70)) >>> rect.draw(win)
>>> #### Draw a line segment using a Line object >>> line = Line(Point(20,30), Point(180, 165)) >>> line.draw(win)
>>> #### Draw an oval using the Oval object >>> oval = Oval(Point(20,150), Point(180,199)) >>> oval.draw(win)
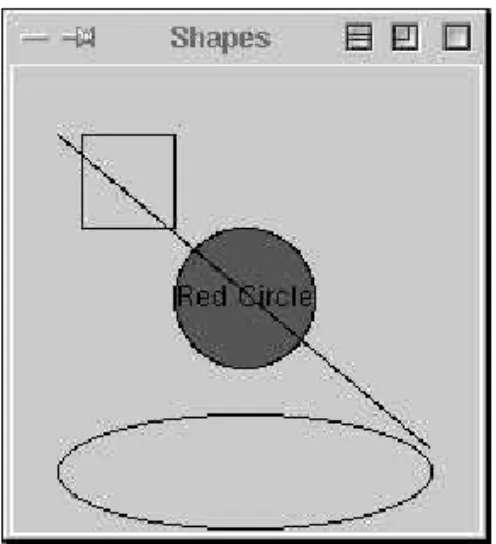
Try to figure out what each of these statements does. If you type them in as shown, the final result will look like Figure5.3.
5.4
Using Graphical Objects
Some of the examples in the above interactions may look a bit strange to you. To really understand thegraphicsmodule, we need to take an object-oriented point of view. Remember, objects combine data with operations. Computation is performed by asking an object to carry out one of its operations. In order to make use of objects, you need to know how to create them and how to request operations.
In the interactive examples above, we manipulated several different kinds of objects: GraphWin,Point,Circle,Oval,Line,Text, andRectangle. These are examples of classes. Every object is aninstance of some class, and the class describes the properties the instance will have.
Figure 5.3: Various shapes from thegraphicsmodule.
Borrowing a biological metaphor, when we say that Fido is a dog, we are actually saying that Fido is a specific individual in the larger class of all dogs. In OO terminology, Fido is an instance of the dog class. Because Fido is an instance of this class, we expect certain things. Fido has four legs, a tail, a cold, wet nose and he barks. If Rex is a dog, we expect that he will have similar properties, even though Fido and Rex may differ in specific details such as size or color.
The same ideas hold for our computational objects. We can create two sepa-rate instances ofPoint, saypandp2. Each of these points has anxandyvalue, and they both support the same set of operations like getX and draw. These properties hold because the objects are Points. However, different instances can vary in specific details such as the values of their coordinates.
To create a new instance of a class, we use a special operation called a con-structor. A call to a constructor is an expression that creates a brand new object. The general form is as follows:
<class-name>(<param1>, <param2>, ...)
Here <class-name> is the name of the class that we want to create a new in-stance of, e.g., Circle or Point. The expressions in the parentheses are any parameters that are required to initialize the object. The number and type of the parameters depends on the class. A Point requires two numeric values, while a GraphWin can be constructed without any parameters. Often, a con-structor is used on the right side of an assignment statement, and the resulting
5.4. Using Graphical Objects 131
object is immediately assigned to a variable on the left side that is then used to manipulate the object.
To take a concrete example, let’s look at what happens when we create a graphical point. Here is a constructor statement from the interactive example above.
p = Point(50,60)
The constructor for the Point class requires two parameters giving the x and
y coordinates for the new point. These values are stored as instance variables
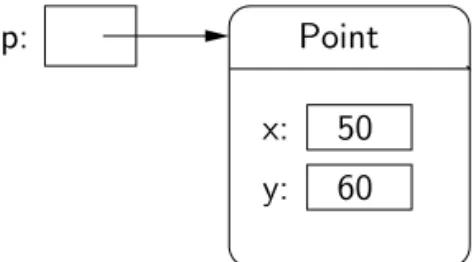
inside of the object. In this case, Python creates an instance ofPointhaving an
x value of 50 and a y value of 60. The resulting point is then assigned to the variablep. A conceptual diagram of the result is shown in Figure5.4. Note that,
in this diagram as well as similar ones later on, only the most salient details are shown. Points also contain other information such as their color and which window (if any) they are drawn in. Most of this information is set to default values when thePointis created.
x: 60 50 p: y: Point
Figure5.4: Conceptual picture of the result ofp = Point(50,60). The variable
prefers to a freshly createdPointhaving the given coordinates.
To perform an operation on an object, we send the object a message. The set of messages that an object responds to are called themethodsof the object. You can think of methods as functions that live inside of the object. A method is invoked using dot-notation.
<object>.<method-name>(<param1>, <param2>, ...)
The number and type of the parameters is determined by the method being used. Some methods require no parameters at all. You can find numerous examples of method invocation in the interactive examples above.
p.getX() p.getY()
ThegetX andgetY methods return the xand y values of a point, respectively. Methods such as these are sometimes calledaccessors, because they allow us to access information from the instance variables of the object.
Other methods change the values of an object’s instance variables, hence changing thestateof the object. All of the graphical objects have amovemethod. Here is a specification:
move(dx, dy): Moves the objectdxunits in thexdirection anddyunits in the
ydirection.
To move the pointpto the right 10 units, we could use this statement.
p.move(10,0)
This changes the x instance variable of p by adding 10 units. If the point is currently drawn in aGraphWin,movewill also take care of erasing the old image and drawing it in its new position. Methods that change the state of an object are sometimes calledmutators.
The move method must be supplied with two simple numeric parameters indicating the distance to move the object along each dimension. Some methods require parameters that are themselves complex objects. For example, drawing a Circle into a GraphWin involves two objects. Let’s examine a sequence of commands that does this.
circ = Circle(Point(100,100), 30) win = GraphWin()
circ.draw(win)
The first line creates aCirclewith a center located at thePoint(100,100)and a radius of 30. Notice that we used thePoint constructor to create a location for the first parameter to the Circle constructor. The second line creates a
GraphWin. Do you see what is happening in the third line? This is a request for theCircleobjectcircto draw itself into theGraphWinobjectwin. The visible effect of this statement is a circle in the GraphWin centered at (100,100) and having a radius of 30. Behind the scenes, a lot more is happening.
Remember, the draw method lives inside the circ object. Using informa-tion about the center and radius of the circle from the instance variables, the
5.4. Using Graphical Objects 133
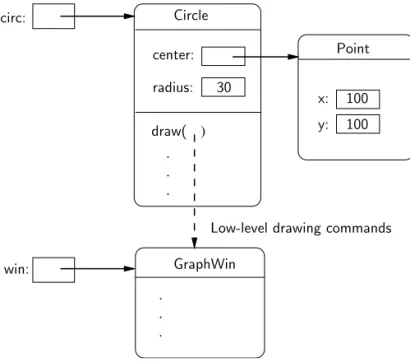
(a sequence of method invocations) to the GraphWin. A conceptual picture of the interactions among the Point, Circle and GraphWin objects is shown in Figure 5.5. Fortunately, we don’t usually have to worry about these kinds of
details; they’re all taken care of by the graphical objects. We just create objects, call the appropriate methods, and let them do the work. That’s the power of object-oriented programming. Circle y: x: 100 100 Point center: radius: draw( ) . . . GraphWin . . .
Low-level drawing commands win:
30 circ:
Figure5.5: Object interactions to draw a circle.
There is one subtle “gotcha” that you need to keep in mind when using objects. It is possible for two different variables to refer to exactly the same object; changes made to the object through one variable will also be visible to the other. Suppose we are trying to write a sequence of code that draws a smiley face. We want to create two eyes that are 20 units apart. Here is a sequence of code intended to draw the eyes.
## Incorrect way to create two circles. leftEye = Circle(Point(80, 50), 5) leftEye.setFill(’yellow’)
leftEye.setOutline(’red’) rightEye = leftEye
rightEye.move(20,0)
The basic idea is to create the left eye and then copy that into a right eye which is then moved over 20 units.
This doesn’t work. The problem here is that only one Circle object is cre-ated. The assignment
rightEye = leftEye
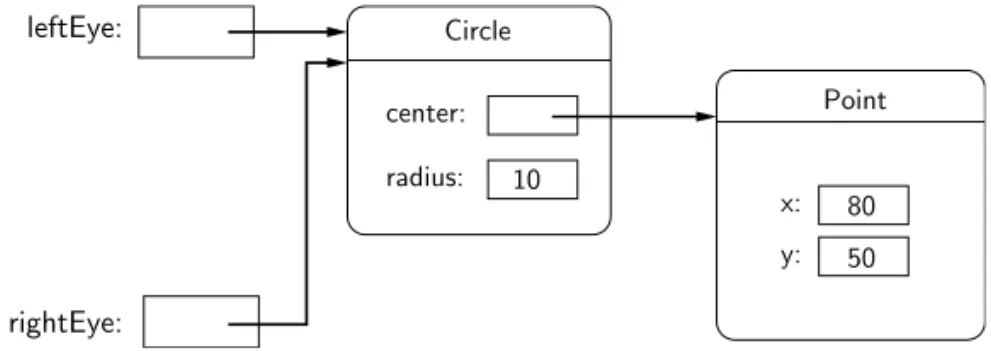
simply makes rightEye refer to the very same circle as leftEye. Figure 5.6
shows the situation. When the Circle is moved in the last line of code, both
rightEye and leftEye refer to it in its new location on the right side. This situation where two variables refer to the same object is called aliasing, and it can sometimes produce rather unexpected results.
rightEye: leftEye: Circle y: x: 50 80 Point center: radius: 10
Figure5.6: VariablesleftEyeandrightEyeare aliases.
One solution to this problem would be to create a separate circle for each eye.
## A correct way to create two circles. leftEye = Circle(Point(80, 50), 5) leftEye.setFill(’yellow’) leftEye.setOutline(’red’) rightEye = Circle(Point(100, 50), 5) rightEye.setFill(’yellow’) rightEye.setOutline(’red’)
This will certainly work, but it’s cumbersome. We had to write duplicated code for the two eyes. That’s easy to do using a “cut and paste” approach, but it’s not
5.5. Graphing Future Value 135
very elegant. If we decide to change the appearance of the eyes, we will have to be sure to make the changes in two places.
Thegraphicslibrary provides a better solution; all graphical objects support a clone method that makes a copy of the object. Usingclone, we can rescue the original approach.
## Correct way to create two circles, using clone. leftEye = Circle(Point(80, 50), 5)
leftEye.setFill(’yellow’) leftEye.setOutline(’red’)
rightEye = leftEye.clone() # rightEye is an exact copy of the left rightEye.move(20,0)
Strategic use of cloning can make some graphics tasks much easier.
5.5
Graphing Future Value
Now that you have some idea of how to use objects from thegraphicsmodule, we’re ready to try some real graphics programming. One of the most important uses of graphics is providing a visual representation of data. They say a picture is worth a thousand words; it is almost certainly better than a thousand numbers. Few programs that manipulate numeric data couldn’t be improved with a bit of graphical output. Remember the program in Chapter 2 that computed the future value of a ten year investment? Let’s try our hand at creating a graphical summary.
Programming with graphics requires careful planning. You’ll probably want pencil and paper handy to draw some diagrams and scratch out calculations as we go along. As usual, we begin by considering the specification of exactlywhat
the program will do.
The original program futval.py had two inputs, the amount of money to be invested and the annualized rate of interest. Using these inputs, the program calculated the change in principal year by year for ten years using the formula principal=principal(1+apr). It then printed out the final value of the principal. In the graphical version, the output will be a ten-year bar graph where the height of successive bars represents the value of the principal in successive years.
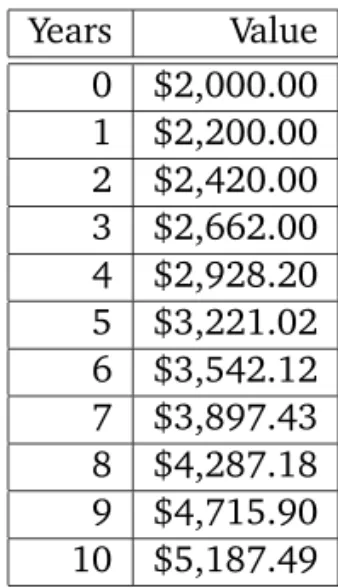
Let’s use a concrete example for illustration. Suppose we invest $2000 at 10% interest. This table shows the growth of the investment over a ten-year period:
Years Value 0 $2,000.00 1 $2,200.00 2 $2,420.00 3 $2,662.00 4 $2,928.20 5 $3,221.02 6 $3,542.12 7 $3,897.43 8 $4,287.18 9 $4,715.90 10 $5,187.49
Our program will display this information in a bar graph. Figure5.7shows the
data in graphical form. The graph actually contains eleven bars. The first bar
Figure5.7: Bar graph showing growth of $2,000 at 10% interest.
shows the original value of the principal. For reference, let’s number these bars according to the number of years of interest accrued, 0–10.
Here is a rough design for the program:
Print an introduction
5.5. Graphing Future Value 137
Create a GraphWin
Draw scale labels on left side of window
Draw bar at position 0 with height corresponding to principal For successive years 1 through 10
Calculate principal = principal * (1 + apr)
Draw a bar for this year having a height corresponding to principal Wait for user to press Enter.
The pause created by the last step is necessary to keep the graphics window dis-played so that we can interpret the results. Without such a pause, the program would end and theGraphWinwould vanish with it.
While this design gives us the broad brush strokes for our algorithm, there are some very important details that have been glossed over. We must decide exactly how big the graphics window will be and how we will position the ob-jects that appear in this window. For example, what does it mean to draw, say, a bar for year five with height corresponding to $3,221.02?
Let’s start with the size of the GraphWin. Recall that the size of a window is given in terms of the number of pixels in each dimension. Computer screens are also measured in terms of pixels. The number of pixels orresolution of the screen is determined by the monitor and graphics card in the computer you use. The lowest resolution screen you are likely to encounter these days is a so-called
standard VGA screen that is 640 x 480 pixels. Most screens are considerably larger. Let’s make theGraphWinone quarter the size of a 640 x 480 screen, or 320 x 240. That should allow all users to see the graphical output as well as the textual output from our program.
Given this analysis, we can flesh out a bit of our design. The third line of the design should now read:
Create a 320 x 240 GraphWin titled ‘‘Investment Growth Chart’’
You may be wondering how this will translate into Python code. You have al-ready seen that theGraphWinconstructor allows an optional parameter to spec-ify the title of the window. You may also supply width and height parameters to control the size of the window. Thus, the command to create the output window will be:
win = GraphWin("Investment Growth Chart", 320, 240)
Next we turn to the problem of printing labels along the left edge of our window. To simplify the problem, we will assume the graph is always scaled to
a maximum of $10,000 with the five labels “0.0K” to “10.0K” as shown in the example window. The question is how should the labels be drawn? We will need someTextobjects. When creatingText, we specify the anchor point (the point the text is centered on) and the string to use as the label.
The label strings are easy. Our longest label is five characters, and the labels should all line up on the right side of a column, so the shorter strings will be padded on the left with spaces. The placement of the labels is chosen with a bit of calculation and some trial and error. Playing with some interactive examples, it seems that a string of length five looks nicely positioned in the horizontal direction placing the center 20 pixels in from the left edge. This leaves just a bit of whitespace at the margin.
In the vertical direction, we have just over 200 pixels to work with. A simple scaling would be to have 100 pixels represent $5,000. That means our five labels should be spaced 50 pixels apart. Using 200 pixels for the range 0–10,000 leaves
240−200 = 40pixels to split between the top and bottom margins. We might want to leave a little more margin at the top to accommodate values that grow beyond $10,000. A little experimentation suggests that putting the “ 0.0K” label 10 pixels from the bottom (position 230) seems to look nice.
Elaborating our algorithm to include these details, the single step
Draw scale labels on left side of window
becomes a sequence of steps
Draw label " 0.0K" at (20, 230) Draw label " 2.5K" at (20, 180) Draw label " 5.0K" at (20, 130) Draw label " 7.5K" at (20, 80) Draw label "10.0K" at (20, 30)
The next step in the original design calls for drawing the bar that corresponds to the initial amount of the principal. It is easy to see where the lower left corner of this bar should be. The value of $0.0 is located vertically at pixel 230, and the labels arecentered20 pixels in from the left edge. Adding another 20 pixels gets us to the right edge of the labels. Thus the lower left corner of the 0th bar should be at location(40,230).
Now we just need to figure out where the opposite (upper right) corner of the bar should be so that we can draw an appropriate rectangle. In the vertical direction, the height of the bar is determined by the value ofprincipal. In drawing the scale, we determined that 100 pixels is equal to $5,000. This
5.5. Graphing Future Value 139
means that we have 100/5000 = 0.02 pixels to the dollar. This tells us, for example, that a principal of $2,000 should produce a bar of height2000(.02) = 40 pixels. In general, they position of the upper-right corner will be given by
230−(principal)(0.02). (Remember that230is the0point, and theycoordinates decrease going up).
How wide should the bar be? The window is 320 pixels wide, but 40 pixels are eaten up by the labels on the left. That leaves us with 280 pixels for 11 bars:
280/11 = 25.4545. Let’s just make each bar 25 pixels; that will give us a bit of margin on the right side. So, the right edge of our first bar will be at position
40 + 25 = 65.
We can now fill the details for drawing the first bar into our algorithm.
Draw a rectangle from (40, 230) to (65, 230 - principal * 0.02)
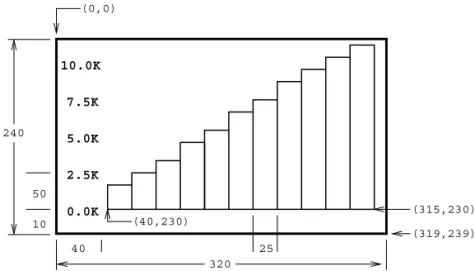
At this point, we have made all the major decisions and calculations required to finish out the problem. All that remains is to percolate these details into the rest of the algorithm. Figure5.8shows the general layout of the window with some
of the dimensions we have chosen.
0.0K 2.5K 5.0K 7.5K 10.0K (40,230) 320 (0,0) (319,239) 25 10 40 50 (315,230) 240
Figure5.8: Position of elements in future value bar graph.
Let’s figure out where the lower-left corner of each bar is going to be lo-cated. We chose a bar width of 25, so the bar for each successive year will start 25 pixels farther right than the previous year. We can use a variableyearto rep-resent the year number and calculate the xcoordinate of the lower left corner
as (year)(25) + 40. (The +40 leaves space on the left edge for the labels.) Of course, theycoordinate of this point is still230(the bottom of the graph).
To find the upper-right corner of a bar, we add 25 (the width of the bar) to the x value of the lower-left corner. The y value of the upper right corner is determined from the (updated) value ofprincipalexactly as we determined it for the first bar. Here is the refined algorithm:
for year running from a value of 1 up through 10: Calculate principal = principal * (1 + apr) Calculate xll = 25 * year + 40
Calculate height = principal * 0.02
Draw a rectangle from (xll, 230) to (xll+25, 230 - height)
The variablexllstands forxlower left—thexvalue of the lower left corner of the bar.
Putting all of this together produces the detailed algorithm shown below:
Print an introduction
Get value of principal and apr from user
Create a 320x240 GraphWin titled ‘‘Investment Growth Chart’’ Draw label " 0.0K" at (20,230)
Draw label " 2.5K" at (20, 180) Draw label " 5.0K" at (20, 130) Draw label " 7.5K" at (20, 80) Draw label "10.0K" at (20, 30)
Draw a rectangle from (40, 230) to (65, 230 - principal * 0.02) for year running from a value of 1 up through 10:
Calculate principal = principal * (1 + apr) Calculate xll = 25 * year + 40
Draw a rectangle from (xll, 230) to (xll+25, 230 - principal * 0.02) Wait for user to press Enter
Whew! That was a lot of work, but we are finally ready to translate this algo-rithm into actual Python code. The translation is straightforward using objects from thegraphicsmodule. Here’s the program:
# futval_graph.py from graphics import *
5.5. Graphing Future Value 141
def main():
# Introduction
print "This program plots the growth of a 10-year investment." # Get principal and interest rate
principal = input("Enter the initial principal: ") apr = input("Enter the annualized interest rate: ") # Create a graphics window with labels on left edge win = GraphWin("Investment Growth Chart", 320, 240) win.setBackground("white") Text(Point(20, 230), ’ 0.0K’).draw(win) Text(Point(20, 180), ’ 2.5K’).draw(win) Text(Point(20, 130), ’ 5.0K’).draw(win) Text(Point(20, 80), ’ 7.5K’).draw(win) Text(Point(20, 30), ’10.0K’).draw(win) # Draw bar for initial principal
height = principal * 0.02
bar = Rectangle(Point(40, 230), Point(65, 230-height)) bar.setFill("green")
bar.setWidth(2) bar.draw(win)
# Draw bars for successive years for year in range(1,11):
# calculate value for the next year principal = principal * (1 + apr) # draw bar for this value
xll = year * 25 + 40 height = principal * 0.02
bar = Rectangle(Point(xll, 230), Point(xll+25, 230-height)) bar.setFill("green")
bar.setWidth(2) bar.draw(win)
win.close() main()
If you study this program carefully, you will see that I added a number of features to spruce it up a bit. All graphical objects support methods for changing color. I have set the background color of the window to white (by default it’s gray).
win.setBackground("white")
I have also changed the color of thebarobject. The following line asks the bar to color its interior green (because it’s money, you know):
bar.setFill("green")
You can also change the color of a shape’s outline using thesetOutlinemethod. In this case, I have chosen to leave the outline the default black so that the bars stand out from each other. To enhance this effect, this code makes the outline wider (two pixels instead of the default one).
bar.setWidth(2)
You might also have noted the economy of notation in drawing the labels. Since we don’t ever change the labels, saving them into a variable is unnecessary. We can just create aTextobject, tell it to draw itself, and be done with it. Here is an example:
Text(Point(20,230), ’ 0.0K’).draw(win)
Finally, take a close look at the use of theyearvariable in the loop.
for year in range(1,11):
The expression range(1,11) produces a sequence of ints 1–10. The loop in-dex variableyearmarches through this sequence on successive iterations of the loop. So, the first time through year is 1, then 2, then 3, etc., up to 10. The value ofyearis then used to compute the proper position of the lower left corner of each bar.
xll = year * 25 + 40
I hope you are starting to get the hang of graphics programming. It’s a bit strenuous, but very addictive.
5.6. Choosing Coordinates 143
5.6
Choosing Coordinates
The lion’s share of the work in designing thefutval graphprogram was in de-termining the precise coordinates where things would be placed on the screen. Most graphics programming problems require some sort of a coordinate trans-formationto change values from a real-world problem into the window coordi-nates that get mapped onto the computer screen. In our example, the problem domain called forxvalues representing the year (0–10) andyvalues represent-ing monetary amounts ($0–$10,000). We had to transform these values to be represented in a 320 x 240 window. It’s nice to work through an example or two to see how this transformation happens, but it makes for tedious programming. Coordinate transformation is an integral and well-studied component of com-puter graphics. It doesn’t take too much mathematical savvy to see that the transformation process always follows the same general pattern. Anything that follows a pattern can be done automatically. In order to save you the trouble of having to explicitly convert back and forth between coordinate systems, the
graphicsmodule provides a simple mechanism to do it for you. When you cre-ate aGraphWin you can specify a coordinate system for the window using the
setCoords method. The method requires four parameters specifying the coor-dinates of the lower-left and upper-right corners, respectively. You can then use this coordinate system to place graphical objects in the window.
To take a simple example, suppose we just want to divide the window into nine equal squares, Tic-Tac-Toe fashion. This could be done without too much trouble using the default 200 x 200 window, but it would require a bit of arith-metic. The problem becomes trivial if we first change the coordinates of the window to run from 0 to 3 in both dimensions.
# create a default 200x200 window win = GraphWin("Tic-Tac-Toe")
# set coordinates to go from (0,0) in the lower left # to (3,3) in the upper right.
win.setCoords(0.0, 0.0, 3.0, 3.0) # Draw vertical lines
Line(Point(1,0), Point(1,3)).draw(win) Line(Point(2,0), Point(2,3)).draw(win) # Draw horizontal lines
Line(Point(0,1), Point(3,1)).draw(win) Line(Point(0,2), Point(3,2)).draw(win)
Another benefit of this approach is that the size of the window can be changed by simply changing the dimensions used when the window is created (e.g. win = GraphWin("Tic-Tac-Toe", 300, 300)). Because the same coordinates span the window (due tosetCoords) the objects will scale appropriately to the new window size. Using “raw” window coordinates would require changes in the definitions of the lines.
We can apply this idea to simplify our graphing future value program. Ba-sically, we want our graphics window to go from 0 through 10 (representing years) in thexdimension and from 0 to 10,000 (representing dollars) in the y
dimension. We could create just such a window like this.
win = GraphWin("Investment Growth Chart", 320, 240) win.setCoords(0.0, 0.0, 10.0, 10000.0)
Then creating a bar for any values of year and principal would be simple. Each bar starts at the given year and a baseline of 0 and grows to the next year and a height equal toprincipal.
bar = Rectangle(Point(year, 0), Point(year+1, principal))
There is a small problem with this scheme. Can you see what I have forgot-ten? The bars will fill the entire window; we haven’t left any room for labels or margins around the edges. This is easily fixed by expanding the coordinates of the window slightly. Since our bars start at 0, we can locate the left side labels at -1. We can add a bit of whitespace around the graph by expanding the co-ordinates slightly beyond that required for our graph. A little experimentation leads to this window definition:
win = GraphWin("Investment Growth Chart", 320, 240) win.setCoords(-1.75,-200, 11.5, 10400)
Here is the program again, using the alternative coordinate system:
# futval_graph2.py from graphics import * def main():
5.6. Choosing Coordinates 145
# Introduction
print "This program plots the growth of a 10-year investment." # Get principal and interest rate
principal = input("Enter the initial principal: ") apr = input("Enter the annualized interest rate: ") # Create a graphics window with labels on left edge win = GraphWin("Investment Growth Chart", 320, 240) win.setBackground("white") win.setCoords(-1.75,-200, 11.5, 10400) Text(Point(-1, 0), ’ 0.0K’).draw(win) Text(Point(-1, 2500), ’ 2.5K’).draw(win) Text(Point(-1, 5000), ’ 5.0K’).draw(win) Text(Point(-1, 7500), ’ 7.5k’).draw(win) Text(Point(-1, 10000), ’10.0K’).draw(win) # Draw bar for initial principal
bar = Rectangle(Point(0, 0), Point(1, principal)) bar.setFill("green")
bar.setWidth(2) bar.draw(win)
# Draw a bar for each subsequent year for year in range(1, 11):
principal = principal * (1 + apr)
bar = Rectangle(Point(year, 0), Point(year+1, principal)) bar.setFill("green")
bar.setWidth(2) bar.draw(win)
raw_input("Press <Enter> to quit.") win.close()
main()
Notice how the cumbersome coordinate calculations have been eliminated. This version also makes it easy to change the size of the GraphWin. Changing the window size to 640 x 480 produces a larger, but correctly drawn bar graph. In
the original program, all of the calculations would have to be redone to accom-modate the new scaling factors in the larger window.
Obviously, the second version of our program is much easier to develop and understand. When you are doing graphics programming, give some consider-ation to choosing a coordinate system that will make your task as simple as possible.
5.7
Interactive Graphics
Graphical interfaces can be used for input as well as output. In a GUI envi-ronment, users typically interact with their applications by clicking on buttons, choosing items from menus, and typing information into on-screen text boxes. These applications use a technique calledevent-driven programming. Basically, the program draws a set of interface elements (often called widgets) on the screen, and then waits for the user to do something.
When the user moves the mouse, clicks a button or types a key on the key-board, this generates anevent. Basically, an event is an object that encapsulates data about what just happened. The event object is then sent off to an appropri-ate part of the program to be processed. For example, a click on a button might produce abutton event. This event would be passed to the button handling code, which would then perform the appropriate action corresponding to that button. Event-driven programming can be tricky for novice programmers, since it’s hard to figure out “who’s in charge” at any given moment. Thegraphicsmodule hides the underlying event-handling mechanisms and provides two simple ways of getting user input in aGraphWin.
5.7.1 Getting Mouse Clicks
We can get graphical information from the user via thegetMousemethod of the
GraphWinclass. WhengetMouseis invoked on aGraphWin, the program pauses and waits for the user to click the mouse somewhere in the graphics window. The spot where the user clicks is returned to the program as aPoint. Here is a bit of code that reports the coordinates of ten successive mouse clicks:
from graphics import * win = GraphWin("Click Me!") for i in range(10):
5.7. Interactive Graphics 147
p = win.getMouse()
print "You clicked (%d, %d)" % (p.getX(), p.getY())
The value returned by getMouse() is a ready-made Point. We can use it like any other point using accessors such asgetXandgetYor other methods such as
drawandmove.
Here is an example of an interactive program that allows the user to draw a triangle by clicking on three points in a graphics window. This example is completely graphical, making use of Text objects as prompts. No interaction with a Python text window is required. If you are programming in a Windows environment, you can name this program using a.pyw extension. Then when the program is run, it will not even display the Python shell window.
# Program: triangle.pyw from graphics import * def main():
win = GraphWin("Draw a Triangle") win.setCoords(0.0, 0.0, 10.0, 10.0)
message = Text(Point(5, 0.5), "Click on three points") message.draw(win)
# Get and draw three vertices of triangle p1 = win.getMouse() p1.draw(win) p2 = win.getMouse() p2.draw(win) p3 = win.getMouse() p3.draw(win)
# Use Polygon object to draw the triangle triangle = Polygon(p1,p2,p3)
triangle.setFill("peachpuff") triangle.setOutline("cyan") triangle.draw(win)
# Wait for another click to exit
message.setText("Click anywhere to quit.") win.getMouse()
The three-click triangle illustrates a couple new features of the graphics
module. There is no triangle class; however there is a general class Polygon
that can be used for any multi-sided, closed shape. The constructor forPolygon
accepts any number of points and creates a polygon by using line segments to connect the points in the order given and to connect the last point back to the first. A triangle is just a three-sided polygon. Once we have three Points p1,
p2, andp3, creating the triangle is a snap.
triangle = Polygon(p1, p2, p3)
You should also study how the Text object is used to provide prompts. A singleTextobject is created and drawn near the beginning of the program.
message = Text(Point(5, 0.5), "Click on three points") message.draw(win)
To change the prompt, we don’t need to create a newText object, we can just change the text that is displayed. This is done near the end of the program with thesetTextmethod.
message.setText("Click anywhere to quit.")
As you can see, thegetMousemethod ofGraphWinprovides a simple way of interacting with the user in a graphics-oriented program.
5.7.2 Handling Textual Input
In the triangle example, all of the input was provided through mouse clicks. The graphicsmodule also includes a simpleEntry object that can be used to get keyboard input in aGraphWin.
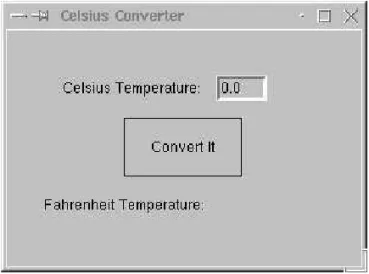
An Entry object draws a box on the screen that can contain text. It un-derstands setText and getText methods just like the Text object does. The difference is that the contents of anEntry can be edited by the user. Here’s a version of the temperature conversion program from Chapter 2 with a graphical user interface:
# convert_gui.pyw
# Program to convert Celsius to Fahrenheit using a simple # graphical interface.
5.7. Interactive Graphics 149
def main():
win = GraphWin("Celsius Converter", 300, 200) win.setCoords(0.0, 0.0, 3.0, 4.0)
# Draw the interface
Text(Point(1,3), " Celsius Temperature:").draw(win) Text(Point(1,1), "Fahrenheit Temperature:").draw(win) input = Entry(Point(2,3), 5)
input.setText("0.0") input.draw(win)
output = Text(Point(2,1),"") output.draw(win)
button = Text(Point(1.5,2.0),"Convert It") button.draw(win)
Rectangle(Point(1,1.5), Point(2,2.5)).draw(win) # wait for a mouse click
win.getMouse() # convert input
celsius = eval(input.getText()) fahrenheit = 9.0/5.0 * celsius + 32 # display output and change button output.setText("%0.1f" % fahrenheit) button.setText("Quit")
# wait for click and then quit win.getMouse()
win.close() main()
When run, this produces a window with an entry box for typing in a Celsius temperature and a “button” for doing the conversion. The button is just for show. The program actually just pauses for a mouse click anywhere in the window. Figure5.9shows how the window looks when the program starts.
Figure5.9: Initial screen for graphical temperature converter.
delete this value and type in another temperature. The program pauses until the user clicks the mouse. Notice that the point where the user clicks is not even saved; the getMouse function is just used to pause the program until the user has a chance to enter a value in the input box.
The program then processes the input in four steps. First, the text in the input box is converted into a number (viaeval). This number is then converted to degrees Fahrenheit. Finally, the resulting number is turned back into a string (via the string formatting operator) for display in theoutputtext area.
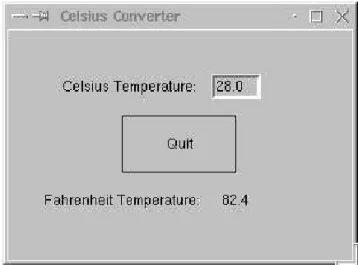
Figure 5.10shows how the window looks after the user has typed an input
and clicked the mouse. Notice that the converted temperature shows up in the output area, and the label on the button has changed to “Quit” to show that clicking again will exit the program. This example could be made much prettier using some of the options in the graphics library for changing the colors, sizes and line widths of the various widgets. The code for the program is deliberately Spartan to illustrate just the essential elements of GUI design.
Although the basic tools getMouseandEntry do not provide a full-fledged GUI environment, we will see in later chapters how these simple mechanisms can support surprisingly rich interactions.
5.8. Graphics Module Reference 151
Figure5.10: Graphical temperature converter after user input.
5.8
Graphics Module Reference
The examples in this chapter have touched on most of the elements in the
graphicsmodule. This section provides a complete reference to the objects and functions provided in the graphics library. The set of objects and functions that are provided by a module is sometimes called an Applications Programming In-terfaceorAPI. Experienced programmers study APIs to learn about new libraries. You should probably read this section over once to see what the graphics library has to offer. After that, you will probably want to refer back to this section often when you are writing your own graphical programs.
5.8.1 GraphWin Objects
A GraphWinobject represents a window on the screen where graphical images may be drawn. A program may define any number ofGraphWins. AGraphWin
understands the following methods:
GraphWin(title, width, height) Constructs a new graphics window for draw-ing on the screen. The parameters are optional, the default title is “Graph-ics Window,” and the default size is 200 x 200.
plot(x, y, color) Draws the pixel at(x, y)in the window. Color is optional, black is the default.
plotPixel(x, y, Color) Draws the pixel at the “raw” position(x, y)ignoring any coordinate transformations set up bysetCoords.
setBackground(color) Sets the window background to the given color. The initial background is gray. See Section 5.8.5 for information on specifying colors.
close() Closes the on-screen window.
getMouse() Pauses for the user to click a mouse in the window and returns where the mouse was clicked as aPointobject.
setCoords(xll, yll, xur, yur) Sets the coordinate system of the window. The lower left corner is(xll, yll) and the upper right corner is(xur, yur). All subsequent drawing will be done with respect to the altered coordinate system (except forplotPixel).
5.8.2 Graphics Objects
The module provides the following classes of drawable objects: Point, Line,
Circle, Oval, Rectangle, Polygon, and Text. All objects are initially created unfilled with a black outline. All graphics objects support the following generic set of methods:
setFill(color) Sets the interior of the object to the given color.
setOutline(color) Sets the outline of the object to the given color.
setWidth(pixels) Sets the width of the outline of the object to this many pix-els. (Does not work forPoint.)
draw(aGraphWin) Draws the object into the givenGraphWin.
undraw() Undraws the object from a graphics window.
move(dx,dy) Moves the objectdx units in the x direction and dy units in the
y direction. If the object is currently drawn, the image is adjusted to the new position.
clone() Returns a duplicate of the object. Clones are always created in an undrawn state. Other than that, they are identical to the cloned object.
5.8. Graphics Module Reference 153
Point Methods
Point(x,y) Constructs a point having the given coordinates.
getX() Returns thexcoordinate of a point.
getY() Returns theycoordinate of a point.
Line Methods
Line(point1, point2) Constructs a line segment frompoint1topoint2.
setArrow(string) Sets the arrowhead status of a line. Arrows may be drawn at either the first point, the last point, or both. Possible values ofstring
are’first’,’last’,’both’, and’none’. The default setting is’none’.
getCenter() Returns a clone of the midpoint of the line segment.
getP1(), getP2() Returns a clone of the corresponding endpoint of the seg-ment.
Circle Methods
Circle(centerPoint, radius) Constructs a circle with given center point and radius.
getCenter() Returns a clone of the center point of the circle.
getRadius() Returns the radius of the circle.
getP1(), getP2() Returns a clone of the corresponding corner of the circle’s bounding box. These are opposite corner points of a square that circum-scribes the circle.
Rectangle Methods
Rectangle(point1, point2) Constructs a rectangle having opposite corners atpoint1andpoint2.
getCenter() Returns a clone of the center point of the rectangle.
getP1(), getP2() Returns a clone of corner points originally used to construct the rectangle.
Oval Methods
Oval(point1, point2) Constructs an oval in the bounding box determined by
point1andpoint2.
getCenter() Returns a clone of the point at the center of the oval.
getP1(), getP2() Returns a clone of the corresponding point used to con-struct the oval.
Polygon Methods
Polygon(point1, point2, point3, ...) Constructs a polygon having the given points as vertices. Also accepts a single parameter that is a list of the ver-tices.
getPoints() Returns a list containing clones of the points used to construct the polygon.
Text Methods
Text(anchorPoint, string) Constructs a text object that displays the given
stringcentered atanchorPoint. The text is displayed horizontally.
setText(string) Sets the text of the object tostring.
getText() Returns the current string.
getAnchor() Returns a clone of the anchor point.
setFace(family) Changes the font face to the given family. Possible values are:’helvetica’,’courier’,’times roman’, and’arial’.
setSize(point) Changes the font size to the givenpointsize. Sizes from 5 to 36 points are legal.
setStyle(style) Changes font to the givenstyle. Possible values are’normal’,
’bold’,’italic’, and’bold italic’.
setTextColor(color) Sets the color of the text to color. Note: setFillhas the same effect.
5.8. Graphics Module Reference 155
5.8.3 Entry Objects
Objects of type Entry are displayed as text entry boxes that can be edited by the user of the program. Entry objects support the generic graphics meth-odsmove(),draw(graphwin), undraw(),setFill(color), and clone(). The
Entryspecific methods are given below.
Entry(centerPoint, width) Constructs anEntryhaving the given center point andwidth. Thewidthis specified in number of characters of text that can be displayed.
getAnchor() Returns a clone of the point where the entry box is centered.
getText() Returns the string of text that is currently in the entry box.
setText(string) Sets the text in the entry box to the given string. Changes the font face to the given family. Possible values are: ’helvetica’,
’courier’,’times roman’, and’arial’.
setSize(point) Changes the font size to the givenpointsize. Sizes from 5 to 36 points are legal.
setStyle(style) Changes font to the givenstyle. Possible values are:’normal’,
’bold’,’italic’, and’bold italic’.
setTextColor(color) Sets the color of the text tocolor.
5.8.4 Displaying Images
The graphics module also provides minimal support for displaying certain image formats into a GraphWin. Most platforms will support JPEG, PPM and GIF im-ages. Display is done with anImageobject. Images support the generic methods
move(dx,dy),draw(graphwin), undraw(), andclone(). Image specific meth-ods are given below.
Image(centerPoint, filename) Constructs an image from contents of the given file, centered at the given center point.
5.8.5 Generating Colors
Colors are indicated by strings. Most normal colors such as ’red’,’purple’,
’green’,’cyan’, etc. should be available. Many colors come in various shades, such as’red1’,’red2’,’red3’, ’red4’, which are increasingly darker shades of red.
The graphics module also provides a function for mixing your own colors nu-merically. The functioncolor rgb(red, green, blue)will return a string rep-resenting a color that is a mixture of the intensities of red, green and blue spec-ified. These should be ints in the range 0–255. Thuscolor rgb(255, 0, 0)is a bright red, whilecolor rgb(130, 0, 130)is a medium magenta.
5.9
Chapter Summary
This chapter introduced computer graphics and object-based programming. Here is a summary of some of the important concepts.
• An object is a computational entity that combines data and operations. Objects know stuff and can do stuff. An object’s data is stored in instance variables, and its operations are called methods.
• Every object is an instance of some class. It is the class that determines what methods an object will have. An instance is created by calling a constructor method.
• An object’s attributes are accessed via dot notation. Generally computa-tions with objects are performed by calling on an object’s methods. Acces-sor methods return information about the instance variables of an object. Mutator methods change the value(s) of instance variables.
• The graphics module supplied with this book provides a number of classes that are useful for graphics programming. A GraphWinis an object that represents a window on the screen for displaying graphics. Various graph-ical objects such asPoint,Line,Circle,Rectangle,Oval,Polygon, and
Text may be drawn in a GraphWin. Users may interact with aGraphWin
by clicking the mouse or typing into anEntrybox.
• An important consideration in graphical programming is the choice of an appropriate coordinate system. The graphics library provides a way of automating certain coordinate transformations.
5.10. Exercises 157
• The situation where two variables refer to the same object is called alias-ing. It can sometimes cause unexpected results. Use of theclonemethod in the graphics library can help prevent these situations.
5.10
Exercises
Review Questions
True/False
1. Usinggraphics.py allows graphics to be drawn into a Python shell win-dow.
2. Traditionally, the upper-left corner of a graphics window has coordinates (0,0).
3. A single point on a graphics screen is called a pixel.
4. A function that creates a new instance of a class is called an accessor. 5. Instance variables are used to store data inside an object.
6. The statementmyShape.move(10,20)movesmyShapeto the point (10,20). 7. Aliasing occurs when two variables refer to the same object.
8. Thecopymethod is provided to make a copy of a graphics object. 9. A graphics window always has the title “Graphics Window.”
10. The method in the graphics library used to get a mouse click isreadMouse.
Multiple Choice
1. A method that returns the value of an object’s instance variable is called a(n)
a) mutator b) function c) constructor d) accessor 2. A method that changes the state of an object is called a(n)
a) stator b) mutator c) constructor d) changor 3. What graphics class would be best for drawing a square?
4. What command would set the coordinates ofwin to go from (0,0) in the lower-left corner to (10,10) in the upper-right?
a)win.setcoords(Point(0,0), Point(10,10))
b)win.setcoords((0,0), (10,10))
c)win.setcoords(0, 0, 10, 10)
d)win.setcoords(Point(10,10), Point(0,0))
5. What expression would create a line from (2,3) to (4,5)? a)Line(2, 3, 4, 5)
b)Line((2,3), (4,5))
c)Line(2, 4, 3, 5)
d)Line(Point(2,3), Point(4,5))
6. What command would be used to draw the graphics objectshapeinto the graphics windowwin?
a)win.draw(shape) b)win.show(shape)
c)shape.draw() d)shape.draw(win)
7. Which of the following computes the horizontal distance between points
p1andp2? a)abs(p1-p2)
b)p2.getX() - p1.getX()
c)abs(p1.getY() - p2.getY())
d)abs(p1.getX() - p2.getX())
8. What kind of object can be used to get text input in a graphics window? a)Text b)Entry c)Input d)Keyboard
9. A user interface organized around visual elements and user actions is called a(n)
a) GUI b) application c) windower d) API 10. What color iscolor rgb(0,255,255)?
a) yellow b) cyan c) magenta d) orange
Discussion
1. Pick an example of an interesting real-world object and describe it as a programming object by listing its data (attributes, what it “knows”) and its methods (behaviors, what it can “do”).
5.10. Exercises 159
2. Describe in your own words the object produced by each of the following operations from the graphics module. Be as precise as you can. Be sure to mention such things as the size, position, and appearance of the various objects. You may include a sketch if that helps.
(a) Point(130,130) (b) c = Circle(Point(30,40),25) c.setFill(’blue’) c.setOutline(’red’) (c) r = Rectangle(Point(20,20), Point(40,40)) r.setFill(color_rgb(0,255,150)) r.setWidth(3) (d) l = Line(Point(100,100), Point(100,200)) l.setOutline(’red4’) l.setArrow(’first’)
(e) Oval(Point(50,50), Point(60,100))
(f) shape = Polygon(Point(5,5), Point(10,10), Point(5,10), Point(10,5)) shape.setFill(’orange’)
(g) t = Text(Point(100,100), "Hello World!") t.setFace("courier")
t.setSize(16)
t.setStyle("italic")
3. Describe what happens when the following interactive graphics program runs:
from graphics import * def main(): win = GraphWin() shape = Circle(Point(50,50), 20) shape.setOutline("red") shape.setFill("red") shape.draw(win) for i in range(10): p = win.getMouse() c = shape.getCenter() dx = p.getX() - c.getX()
dy = p.getY() - c.getY() shape.move(dx,dy)
win.close() main()
Programming Exercises
1. Alter the program from the last discussion question in the following ways: (a) Make it draw squares instead of circles.
(b) Have each successive click draw an additional square on the screen (rather than moving the existing one).
(c) Print a message on the window ”Click again to quit” after the loop, and wait for a final click before closing the window.
2. An archery target consists of a central circle of yellow surrounded by con-centric rings of red, blue, black and white. Each ring has the same “width,” which is the same as the radius of the yellow circle. Write a program that draws such a target. Hint: Objects drawn later will appear on top of ob-jects drawn earlier.
3. Write a program that draws some sort of face.
4. Write a program that draws a winter scene with a Christmas tree and a snowman.
5. Write a program that draws 5 dice on the screen depicting a straight (1, 2, 3, 4, 5 or 2, 3, 4, 5, 6).
6. Modify the graphical future value program so that the input (principal and apr) also are done in a graphical fashion usingEntryobjects.
7. Circle Intersection. Write a program that computes the intersection of a circle with a horizontal line and displays the information textually and graphically.
Input: Radius of the circle and they-intercept of the line.
Output: Draw a circle centered at(0,0)with the given radius in a window with coordinates running from -10,-10 to 10,10.
5.10. Exercises 161
Draw the two points of intersection in red.
Print out thexvalues of the points of intersection.
Formula: x=±p r2−y2
8. Line Segment Information.
This program allows the user to draw a line segment and then displays some graphical and textual information about the line segment.
Input: 2 mouse clicks for the end points of the line segment.
Output: Draw the midpoint of the segment in cyan. Draw the line.
Print the length and the slope of the line.
Formulas: dx=x2−x1 dy=y2−y1 slope=dy/dx length=p dx2+dy2 9. Rectangle Information.
This program displays information about a rectangle drawn by the user.
Input: 2 mouse clicks for the opposite corners of a rectangle.
Output: Draw the rectangle.
Print the perimeter and area of the rectangle.
Formulas: area= (length)(width) perimeter = 2(length+width)
10. Triangle Information.
Same as previous problem, but with 3 clicks for the verticies of a triangle.
Formulas: For perimeter, see length from line problem.
area = p
s(s−a)(s−b)(s−c) where a, b, and c are the lengths of the sides ands= a+2b+c
You are to write a program that allows the user to draw a simple house using five mouse-clicks. The first two clicks will be the opposite corners of the rectangular frame of the house. The third click will indicate the center of the top edge of a rectangular door. The door should have a total width that is 15 of the width of the house frame. The sides of the door should extend from the corners of the top down to the bottom of the frame. The fourth click will indicate the center of a square window. The window is half as wide as the door. The last click will indicate the peak of the roof. The edges of the roof will extend from the point at the peak to the corners of the top edge of the house frame.
1
2 4
3 5
12. Write a program to plot a horizontal bar chart of student exam scores. Your program should get input from a file. The first line of the file contains the count of the number of students in the file, and each subsequent line contains a student’s last name followed by a score in the range 0 to 100. Your program should draw a horizontal rectangle for each student where the length of the bar represents the student’s score. The bars should all line up on their left-hand edges. Hint: use the number of students to determine the size of the window and its coordinates. Bonus: label the bars at the left end with the student name.
Computewell Dibblebit Jones Smith
5.10. Exercises 163
13. Write a program to draw a quiz score histogram. Your program should read data from a file. Each line of the file contains a number in the range 0–10. Your program must count the number of occurrences of each score and then draw a vertical bar chart with a bar for each pos-sible score (0–10) with a height corresponding to the count of that score. For example, if 15 students got an 8, then the height of the bar for 8 should be 15. Hint: use a list that stores the count for each possible score.