Persistent link:
http://hdl.handle.net/2345/413
This work is posted on
eScholarship@BC
,
Boston College University Libraries.
Boston College Electronic Thesis or Dissertation, 2006
Copyright is held by the author, with all rights reserved, unless otherwise noted.
Why Are There Any Public Defined
Contribution Plans?
Why Are There Any Public
Defined Contribution Plans?
Gregory Wiles Boston College Department of Economics
Senior Thesis Advisor: Alicia Munnell
Why Are There Any Public Defined Contribution Plans? Gregory Wiles Boston College Department of Economics Senior Thesis April 2006 ABSTRACT
Retirement plans for state employees have over $2 trillion in assets, a significant portion of the U.S. retirement market. In the last 10 years, seven states have transitioned their employee retirement plans from traditional annuity-providing defined benefit pensions to individual account-style defined contribution plans. While private-sector employers save money in transitioning to a defined contribution plan, states actually lose money when switching. Why state governments choose to sponsor retirement plans that cost both the state and its employees money is the central question of this study. Several financial and demographic variables are considered; the only variable that cannot be ruled out is political ideology. The probit panel regression finds that states with Republican-controlled governments are far more likely to switch to a defined contribution plan than states with mixed or Democrat-controlled governments. This conclusion illuminates the central importance of unions in the political process of public plan decision-making and reveals the importance of potential economics losses that result from sponsoring defined contribution plans.
Gregory A. Wiles Boston College (617) 656-3018 wilesg@bc.edu
In 1911 the Commonwealth of Massachusetts established the first pension plan for state employees. Public employees in the Commonwealth contributed up to 5 percent of their salaries to the state plan in order to receive a generous monthly benefit after retirement Massachusetts state workers were eligible for retirement at age 60, with mandatory retirement at 70. In the subsequent three decades, all 50 states established pension plans for their state workers, most modeled after the Massachusetts pension. These state retirement plans became increasingly necessary after the passage of the Social Security Act of 1935 which provided a base of
retirement for most private sector workers, but did not cover state and local government workers. Today over 16 million people in the United States are covered by a state retirement plan, and the assets in state plans total more than $2 trillion (Figures 1 and 2). Most of these plans are defined benefit (DB) plans, which are managed by the state and provide a lifetime annuity at retirement. In recent years, however, some states have converted their primary pension to a defined contribution (DC) plan. In DC plans, employees contribute a certain amount from each paycheck to an individual account and receive the balance (plus interest) at retirement in a lump sum payment. In the private sector, DC plans in the form of the 401(k) plan have come to dominate the retirement market. Public plans, by contrast, have been slow to adopt DC plans for their workers, with only 8 states offering DC plans.
This paper seeks to isolate the significant factors that have led states recently to adopt DC plans in place of their traditional defined benefit plans. Although much work has been done analyzing the rise of the 401(k) plan in the private sector, no studies address the rise of the DC plan in the public sector. This paper is organized as follows. Section I reviews the different forms of retirement plans. Section II provides a summary of the experience of the private sector and implications for public plans. Section III presents a theory of public plan defined
contribution transition. The data are reviewed in Section IV, while Section V presents empirical results. Section VI analyzes the results and Section VII concludes.
Section I: Retirement Plans
Pensions are a promise by an employer to continue to pay an employee after retirement in exchange for a share of the employee’s wages during his working years. Like any economic relationship, pensions are beneficial to both parties. Employees are able to retire from the workforce at a reasonable age with a secure retirement income for the remainder of their life. Employers, for their part, gain some control over the labor force. By linking retirement benefits to years of service, employers can compel workers to remain with the employer for long periods of time, cutting down costs associated with job turnover. These fundamental theoretical aspects of pensions are incorporated into the defined benefit (DB) retirement plan.
Defined Benefit Plans
Defined benefit plans, as their name suggests, pay a benefit to employees at retirement, typically in the form of a lifetime annuity. The formula for calculating the annuity varies widely across plans, but most DB plans use the “percentage of final average salary for each year of service” method. So if the benefit formula percentage is, say, 2 percent, then workers with thirty years of service would receive 60 percent (thirty years at 2 percent) of their final average salary for as long as they lived. Final average salary is defined as an average of the last three or five years of employment. Vesting requirements, the length of time an employee must work in order to earn the legal right to a retirement benefit under the plan, generally range from 5 to 10 years. Many plans also have minimum age and service requirements (e.g., sixty years of age and twenty years of service) to collect full accrued benefits. Employers are responsible for funding the plan
by making pre-tax contributions to a trust fund. The employer manages the fund, directs the investment of the assets, and bears the financial risk.
Plans of this type at the state level differ in many respects from their private sector counterparts. First, while in the private sector employers exclusively contribute to the plan, public sector plans are mostly contributory. Generally, contributory state defined benefit plans split the pre-tax contributions between the employee and the employer. Second, approximately 20 percent of state employees are not covered by Social Security.1 As mentioned, the 1935 Social Security Act did not require state and local employees to join the system for fear of
infringing upon the Constitutional honoring of states’ rights. Over time most states allowed their employees to participate in the national system, yet some still resist fearing the transitional costs.2 Workers covered by plans that do not have Social Security coverage generally receive more generous benefits from the state plan. These benefits are about 20 percent higher than those plans with Social Security coverage, compensating employees for the lost benefits. Third, benefits within state plans are often differentiated by occupation type. Police officers and firefighters are permitted to retire at a younger age and receive more generous benefits, presumably to compensate for the more risky and labor-intensive characteristics of their professions. Teachers also tend to receive more lucrative annuities. Judges and legislators are also differentiated from general state employees, given the transitory nature of their jobs. Many states go as far as separating the trust funds of each of these groups into specialized plans; others simply group them into the whole. Finally, labor unions tend to play a significant role in plan
1 Ford (2005)
2 Studies conducted in the 1980s and 90s estimated the average cost increase assuming that state governments
reduced their benefits to the point where a combined Social Security/public program would preserve an average worker’s first year benefits. The studies showed an increase in cost of about 5 to 6 percent of new employee payrolls – massive costs for any employer. For a description of how and why this transition imposes significant costs, see Munnell (2005).
design at the state and local levels. Many public professions are highly unionized, so state
governments bargain with the unions over benefits more so than companies in the private sector. Public pensions are also considered more generous than DB plans in the private sector. A U.S. Department of Labor survey showed that public employers contribute on average $1.97 per hour worked to employees’ defined benefit plans as opposed to only $.41 in the private sector.3 These numbers hold many caveats,4 but nevertheless reveal the central importance of DB plans to compensation for public employees. An important reason why public plans can be more generous is that they are not subject to the requirements under ERISA, the Employee Retirement Income Security Act of 1974. ERISA placed several restrictions on DB plan governance in the private sector, driving up administrative costs significantly for these types of plans. State plans were not required to implement many of the costly changes required under ERISA, keeping them relatively cheap to run. In fact, the cost of administering a public-sector defined benefit plan is decidedly less than a defined contribution plan.5
Defined Contribution Plans
In contrast to defined benefit plans, defined contribution plans are more like savings accounts. Employees, and often employers, make a defined contribution to the account. The contribution is a percentage of the employee’s earnings. These contributions are invested, usually at the direction of the employee, in mutual funds, stocks, and bonds. Defined
contribution plans are designed to be mobile, unlike defined benefit plans. Employees can take their accumulated assets with them from to job to job until retirement. The accumulated funds
3 McDonnell (2005)
4 First, DB participation in the private sector is significantly lower than in the public sector, accounting for at least
half of the difference. Second, the composition of the workforce in the private and public samples is far different. The high education and risk levels in public sector jobs such as police officers and correctional employees
necessitate higher compensation. These types of occupations are concentrated in government sectors.
are disbursed to the employee at retirement in the form of a lump sum. Employees can also roll over the sum into an Individual Retirement Account (IRA). The defining characteristic of DC plans is that the employee directs the fund, invests the assets, and bears the risk of financial loss.
Defined contribution plans have some advantages over traditional DB plans, with an important exception in the public sector. First defined contribution plans in the private and public sectors allow pre-tax contributions to the plan, making them tax-deferred savings vehicles for employees. Second, DC plans provide freedom and flexibility to workers. DB plans require a vesting period of five to ten years, whereas public DC plans have no service requirement. Workers are free to move to different jobs in different sectors while still preserving their accrued retirement benefits. However restrictions on rollovers restrict the movement of public workers with certain types of plans. Some plans cannot be rolled over into 401(k)s or other forms of individual retirement accounts.6 When funds are not rolled over, they become less effective at generating retirement income.
Cash Balance Plans
Between the extremes of DB and DC plans lay a variety of “hybrid” plans which combine aspects of both. Cash balance plans are by far the most popular hybrid. Much like traditional defined benefit plans, employers contribute to the plan, direct the investments, and bear the risk. From the point of view of the employee, however, cash balance plans look much like DC plans. The employer contributes about 4 or 5 percent of the worker’s earnings to a “notional” account, providing an interest credit over time equal to the risk-free level of interest.7 Employees receive regular statements detailing the balance of their account and can withdraw the balance when they leave the company.
6 Fore (2001)
Hybrid plans are appealing to employees because they offer the portability of DC plans with the guarantee of a defined benefit at retirement if the worker remains at the company for many years. Employers prefer hybrid plans to traditional defined benefit plans because they do not bear the financial risk of annuitization.8 Also, it is easier to convert a defined benefit to a hybrid than to a defined contribution plan. Hybrids are also popular in the private sector because they provide the protection of government pension insurance via the Pension Benefit Guarantee Corporation. Hybrids have remained rather unpopular in the public sector, although a few states have experimented with cash balance-type plans.
Section II: The Switch from DB to DC
Defined benefit plans were the rule for retirement plans in 1970. Since then, the private sector has witnessed a massive shift from defined benefit plans to defined contribution plans. The landscape for retirement plans has changed drastically, with significant implications for America’s workforce. While the public sector just begins to experience these changes, the lessons of private companies have interesting consequences for the future of public pensions.
DB Plan Financing
First, a review of pension financing is useful. Employer (and occasionally employee) contributions to a defined benefit plan join a pool of assets that are invested in a variety of financial instruments including stocks and bonds. The assets are managed by the plan’s administrators in order to fund future obligations, known as liabilities. In order to measure obligations and calculate the level of contributions necessary to prefund benefits over time, plans hire actuaries to conduct valuations of the plan. Actuaries combine information on past and anticipated age, service, mortality, and projected salaries of the plan’s membership with
demographic assumptions, such as morality, disability, and probabilities of retirement to produce mathematical models that reflect patterns of the plan’s beneficiaries. Incorporating economic assumptions including inflation, wage increases, and long-term rates of return, the actuaries derive a measure of the plan’s long-term liabilities.9 Their calculations allow employers to estimate the contributions required to fund the plan’s liabilities in a systematic manner over time. Since the assumptions used in pension financing are often subjective, methods vary widely across plans. Moreover, plans in the private sector usually make different liability calculations for the same plan depending upon the purpose, whether for internal use, tax reporting, or
financial accounting statements. State and local plans on the other hand make one calculation for each plan, making comparisons relatively simpler.10 The valuation of assets is slightly more basic, using the market value of the plan’s assets. However, because the value of assets fluctuates wildly over time (stocks, for instance, are highly volatile), the asset measure is often smoothed over a three or five-year averaging period.
Pension plans are required by law to calculate the value of the assets and the value of accrued liabilities in the plan on a periodic basis, computed using the method described above. The difference between the actuarial value of assets and the actuarial accrued liability is known as the unfunded actuarial accrued liability (UAAL). The UAAL provides a monetary measure of the gap between plan funding and the plan’s future pension obligations. If the UAAL becomes too large, the plan may need to raise contributions to meet its future obligations. Another
measure of this concept is the “funding ratio,” calculated by dividing the actuarial value of assets by the actuarial accrued liabilities. “Underfunded” plans have a ratio less than one, while
“overfunded” plans have a ratio greater than one.
9 Mitchell, et al. (2001)
The underfunding of pension plans is the primary financial risk that plan sponsors incur under the DB system. The source of this risk is that financial instruments, most notably stocks, underperform. When the actuarial value of assets decreases significantly, it is difficult for assets to catch up to the rising value of liabilities. The other risk is historically low interest rates. The actuarial value of liabilities is the present discounted value of all the future years of benefit payments. When the discount rate, which incorporates the current level of interest rates, is very low, the value of future liabilities appears much larger. When stock values fall along with interest rates, as was the situation in the early part of this decade, the UAAL increases
substantially. This “perfect storm” led to the closure of dozens of private sector pension plans in the past five years.
The Private Sector
In 1980, there were 148,096 defined benefit plans in the United States with over 30 million participants. By 2000, the number of DB plans had decreased by almost 70 percent while the number of active participants fell to just over 22 million. Meanwhile, the number of defined contribution plan participants rose to a level of 52 million in 2001 (Figure 3). The startling shift in the private sector away from DB pensions and toward individual 401(k) account-style DC plans can be explained by several legal and economic changes in the last 30 years.
First, defined benefit plans quickly became burdensome for employers after the passage of ERISA in 1974. The law imposed strict minimum standards for participation, vesting, and funding that resulted in increased costs for administering the plans. In addition, the new Pension Benefit Guarantee Corporation (PBGC) required that plan sponsors pay premiums to pay for government pension insurance. In addition to ERISA, Congress passed significant legislation
throughout the 1980s that raised the costs of administering DB plans in the hope that these plans would be run more fairly. The cumulative impact of the legislation caused administrative costs as a percentage of payroll to nearly triple for DB plans over the period 1981-96.11 These developments led to a virtual halt in new plan formations by 1990 and an increase in terminations thereafter.
The increase in defined contribution plan formation in the form of the 401(k) was aided principally by the presence of thrift and profit-sharing plans in private corporations. When the IRS issued clarifying regulations regarding the 401(k) plan in 1980, many workers covered by a DB plan also had a supplementary thrift plan. By replacing thrift plans, which allow workers to make after-tax contributions, with tax-deferred 401(k)s, employees saw their contribution levels remain constant while their take-home pay increased. Likewise, employers with profit-sharing plans were able to use the 401(k)’s voluntary participation aspect to decrease the amount of profits distributed to their workers. Thus 401(k) plans grew up alongside traditional pensions. The termination of large DB plans did not become commonplace until the 21st century. Instead, most workers at large companies came to be active participants in both a DB pension plan and a 401(k), while workers at new firms became exclusive participants in 401(k) plans.
The 401(k) was also aided by the United States’ changing labor market. The 80s and 90s saw large, unionized, manufacturing jobs give way to small service jobs. The service industry is composed of companies that come and go with a very mobile workforce. While defined benefit plans are well suited for large employers with long-service employees, they are costly and impractical for small service firms. Most small firms therefore formed 401(k) plans for their employees instead of costly DB plans. Employees welcomed the advent of 401(k) plans, which allowed for young mobile workers to take their 401(k) accumulations with them as they moved
from job to job. Workers also gained control over their own retirement planning. From the employer’s perspective, 401(k) plans allowed them to avoid the plethora of financial risks
associated with managing a defined benefit plan. Today defined contribution plans dominate the private sector retirement market, while defined benefit plans are increasingly terminated or fail under financial strain.
401(k) Plans and Retirement Income
A natural question to ask regarding the triumph of the 401(k) over the traditional pension is whether or not the popular DC plans provide the same level of retirement income as DB plans. In fact, a recent comprehensive study has revealed that the current design of 401(k) plans yields income at retirement far below what defined benefit pensions provide. The reason for this outcome, the authors posit, is that workers are ill-equipped to handle the responsibility for their own retirement.12
Hypothetically, a worker who contributes consistently to a 401(k) plan over the course of their lifetime would accumulate more money at retirement than someone who works for an employer their entire working life with a defined benefit plan. For some reason, however, the data do not show this relationship. In a simulation, a typical worker with a 401(k) should
accumulate about $170,000 by age fifty. But figures from the Federal Reserve Bank’s Survey of Consumer Finances show the average 401(k) balance at this age to be only $49,000.13 Why are
401(k) balances for older workers so low?
First, about a quarter of eligible employees do not participate in 401(k) plans. Lack of participation is a significant impediment to retirement accumulations in the private sector (but is not a problem in the public sector, as public workers are required to join). Second, employees do
12 Munnell and Sundén (2004) 13 Munnell and Sundén (2006)
not contribute the optimal amount to maximize retirement income. Ideally, workers should contribute the amount that takes full advantage of the employer match, which few actually do. Third, workers make poor investment decisions. Participants should be heavily invested in equities at younger ages, eventually rebalancing toward bonds as they age. Data show that participants invest unwisely, resulting in lower account balances. Fourth, participants in 401(k) plans at large companies keep a very large percentage of their assets in their company’s stock. At plans with 5000 or more participants, employees hold an average of 34 percent of their assets in company stock.14 This level of investment in one stock is very imprudent, remembering that Enron employees held on average 60 percent of the company’s stock in their 401(k). Fifth, employees often borrow from their 401(k) to finance large purchases or fail to rollover their balances when they move jobs. These “leakages” from 401(k) plans have by far the largest impact upon account balances at retirement; workers have a hard time saying no to money now. Finally, 401(k) plans, like nearly all DC plans, provide a lump sum payment when the participant retires. Few choose to purchase an annuity with the lump sum payment. Unlike defined benefit plans, which provide a steady monthly payment until death, 401(k) plans cut the worker a large paycheck that is often spent too quickly. The conclusion is that 401(k) plans, despite the benefits they provide, yield on average a retirement income less than that of a typical defined benefit pension.
State Plans
Defined benefit plans still dominate the retirement market for state workers. The key to understanding the divergent paths of the private and public retirement markets in the past 30 years are the minute yet significant differences between the two sectors. The most important
difference is the financial administration of defined benefit plans. In the private sector,
employees do not contribute to DB plans, while in state and local plans nearly all DB plans are contributory. When transitioning to a DC plan, the contributory nature of a public DB plan can significantly affect the costs of transition.
This difference is best explained using a simulation. Table 1 shows the costs to a private firm of a worker who earns $100 in wages each week. If the firm runs a DB plan, it contributes 9 percent of the employee’s wages ($9) to the DB trust fund, while the employee contributes nothing. Thus the employee receives $100 in net wages and $9 in retirement plan contributions, earning total compensation of $109. Now say the employer chooses to transition to a DC plan. Assume that the employer maintains the same level of contributions to the plan so as to preserve, theoretically, the same level of benefits to its employees. In the private sector, the average employee contribution to a 401(k) plan is 6 percent of salary, while the average employer match is 3 percent. Therefore contributions to the retirement plan are equal under the DB and DC plans, 9 percent. But the employee’s net wages drop to $94 ($100 – $6) while his total
compensation falls to $103. Ignoring administrative costs and the minor effect of taxation, the employer saves 6 percent of payroll by transitioning to a DB plan. While the up-front
transitional costs may be large, in the long run transitioning to a DC plan in the private sector is very financially beneficial to private firms. This reduction in costs for employee compensation helps to explain the large shift away from DB plans in the private sector.
The public sector’s experience is illustrated in Table 2. In generous state pension plans, the average employee and employer contribution is about 7 percent, for total contributions of 14 percent. A state employee’s net wages are therefore $93, while her total compensation is $107. When the state transitions to a DC plan, assuming contributions remain constant, nothing
changes in terms of contributions or total compensation. In fact from the point of view of the worker and the employer, the financing of DB and DC plans is identical. The assumption that contributions remain constant is based upon the experience of nearly every state plan that has transitioned in the past decade (Table 3).
If administrative costs are considered, the transition to a DC plan actually proves to be more expensive. The administrative costs imposed on private DB plans by ERISA and further federal regulations do not apply to state-run plans. Furthermore, since the PGBC does not insure public plans, the states do not have to pay expensive premiums to be covered by the federal pension insurance. This freedom from federal obligation, combined with the economies of scale achieved by very large state pension funds, keeps the costs of running public DB plans very low. A study of large state plans by the National Association of State Retirement Administrators (NASRA) found average administrative costs to be 0.25 percent of assets.15 The cost of administering DC plans is comparably more expensive. DC plans use mutual or bond funds as investment options, which have expense ratios of about 1 - 2 percent of assets. Defined
contribution administrative costs in the public sector are therefore upwards of 1.5 – 2.5 percent of assets. This difference in cost, say 1.5 percent of assets, can be very significant. Over a 30-year period with a constant return of 7 percent, a fund with added costs of 1.5 percent of assets will have accumulated 35 percent less assets than one without such costs.
Studies of specific public plans confirm the higher costs of public DC plans. The Illinois Municipal Retirement Fund estimated that a DC plan would decrease the total amount of assets in the plan by 2 percent per year as a result of added administrative costs.16 In a legislative
report done in 1999 on the costs of switching Florida’s pension to a DC, analysts found that the
15 NASRA (2005)
long-term costs of such a transition would average about 1.5 percent of assets per year. The study found that while state employers save costs on survivor and disability benefits when switching to a DC plan, the additional administrative costs tend to overwhelm the savings.17 States that have switched to a DC plan deduct these administrative costs up front, usually from the employer contributions (Table 3). Ultimately the increased administrative costs either cost the state more money or result in lower contributions and therefore lower benefits at retirement for employees
Another important difference between the private and public sectors is the composition of the labor force. While the private sector became a mobile, service-based economy, the public sector’s workforce changed little in the past 30 years. The median job tenure for state
government employees is 6.4 years compared with 3.5 in private nonagricultural jobs.18 Government workers tend to stay with their employer for much longer than their private sector counterparts. Hence many more public workers are able to vest in a defined benefit plan than those in private occupations. The presence of defined contribution plans for public jobs are not seen as necessary as 401(k) plans are for the mobile, short-tenured private sector.
Unionization also plays a far more significant role in government jobs than in the private sector. While less than 10 percent of the private workforce is unionized, about 30 percent of state workers participate in a union. Unlike the metamorphosis undergone by the private world, state employees generally work for their employer for a very long period of time while many still participate in a union. Most economists believe this characteristic is a result of the distribution of occupations within public jobs. To what degree the continued sponsorship of defined benefit plans has continued to promote these employee characteristics remains a matter of debate.
17 Trager, et. Al. (2001)
All 50 states offer a supplemental defined contribution plan to their public workers. The 457(b) plan is the most popular supplemental plan because it offers more flexibility and its contribution limit is well-suited for supplementary income. (Figure 1) However states that wish to make their primary retirement plan a DC plan opt for a general defined contribution plan as defined under section 401(a) of the IRS tax code. Taking advantage of exceptions within section 401(a) for government plans, state defined contribution plans are technically profit-sharing plans for a non-for profit employer. Notwithstanding these technical differences, state primary defined contribution plans are very similar to private sector 401(k) plans.19
The adoption of defined contribution plans by state governments has been a recent and rapid phenomenon; states that have begun a DC plan are summarized in Table 4. Prior to 1995, only two states sponsored defined contribution plans for their state employees. Nebraska began a DC plan in 1964 for its state employees while West Virginia sponsored a DC plan for state teachers in 1991. Both plans were recently closed. Michigan became the first and only state to sponsor a primary 401(k) plan in 1997; all new employees are required to join the state’s 401(k). South Carolina, Montana, Florida, Ohio, and most recently Colorado and Alaska have adopted defined contribution plans for their general state employees. Table 4 shows the size and funding ratios of the states’ pension plans prior to adoption of a DC plan. Additionally, Indiana, Oregon, and Washington sponsor cash balance-type hybrid plans for their employees, but because of the complicated nature of such plans I do not consider them in this study.
Section III: Theory
Clearly the private-sector explanation for why defined contribution plans have taken over does not fit the unique mold of the public realm. State employees are unionized and relatively
19 The 403(b) plan is another plan that many public employees participate in. However these plans are typically run
immobile, while state DC plans are comparatively more expensive than traditional DB plans. Yet some combination of factors must be able to explain why seven states in the last ten years have elected to favor an account-style defined contribution plan over the traditional pension. The following three “explanatory groups” form the underlying theory of my empirical analysis.
Plan Financials
Why a state would elect to sponsor a DC plan when it tends to raise the costs of
administering the plan seems to make little sense. Yet although administrative costs rise when implementing a DC plan, the state divests itself of the risks associated with running a defined benefit plan. Contributions to the new plan grow at a steady, predictable rate and the risk of poor investment returns is subsequently placed upon the employee. The state must make a decision whether or not the additional administrative costs are worth the decreased risk. States with underfunded plans may react to the plan’s inadequate funding status by considering a switch to a DC plan. Although the state will eliminate any future risk of running a large unfunded liability, the new plan will do nothing to shore up the plan’s current funding status. Considering the opposite scenario, when state plans are fully funded or overfunded, the financial decision appears to be far simpler. The state is able to unload the defined benefit risks while paying for the added administrative costs of the DC plan with the excess funding of the DB plan. The State of Florida found itself in this situation in 1999, making the decision to switch far easier and clear-cut. Studies of the financial impact of switching plans have found that, ceteris paribus, making the
transition is easier when a plan has adequate funding.20
Theoretically, we would expect a state with an overfunded plan to be more likely to sponsor a defined contribution plan than a state with an underfunded plan. In order to test this
hypothesis, measures of the plan’s financial status are necessary. The size of a plan’s unfunded liability would seem the ideal measure, but plans vary wildly in size. The funding ratio of a state pension plan provides the best measure of a plan’s funding relative to its size.
Plan Governance
Aspects of a DB plan’s governance and administration may also explain why a state would choose to favor a DC plan. First, less progressive states with low tax rates would find it more difficult to raise revenue to plug a funding gap. Also, if pressures from unions are
unusually strong in some states, it would be very difficult to change the plan’s benefit structure in the hope of reducing future liabilities.
The ability of a state to raise revenue when necessary can be measured in several
different ways. Perhaps the most accurate measure of a state’s ability to raise revenue is its fiscal capacity. To calculate a measure of fiscal capacity, one first estimates the per capita yield that a
hypothetical, uniform representative tax system would produce in each state. Then, using data on state tax collections for various goods and services and state rules on deductions and exemptions, the fiscal capacity calculates how far each state is from the “ideal” tax system. Theoretically, this process is able to judge when governments don’t tax certain items because they are compelled to, not because they want to.21 For example, Alaska and Nevada have very high fiscal capacities because they are easily able to tax plentiful oil and gambling, respectively. Mississippi, in contrast, has a very poor population and very few taxable products. The
drawback of the fiscal capacity measure is that the output of the calculation is not a nominal value. The computation produces an index with an average of 100, and then proceeds to rank
21 Tannenwald (2002)
states on the basis of their ability to raise revenue. Additionally, the constant revisions in methodology do not make different years accurately comparable.
Another measure of the ability to raise revenue is a state’s bond rating. Moody’s
provides credit ratings for all 50 states, based upon past and present fiscal conditions. Although most states are required by their constitutions to run a balanced budget, unforeseen fiscal shocks can cause large budget deficits, in turn lowering the state’s bond rating. Unfortunately, since states do not default on their debt, no state has a rating lower than A-, with most states having ratings of AA or AAA. The limited variation in state bond ratings thus prevents this potentially useful measure from providing much pertinent information about states’ capacity to raise revenue.
A good numeric calculation of a state’s ability to raise revenue is the ratio of state tax collections to personal income. This relationship describes the amount a state collects in taxes in relation to the income of the state’s residents. Presumably, a state that has a high tax revenue-to-income ratio would find it easier to tax its residents further, given the already very progressive nature of the tax system. Thus high revenue-to-income states would be less likely to transition to a DC plan given the ability they have to “fix” an underfunded plan in their state. Although by no means as ideal of a measure of a state’s ability to raise revenue as fiscal capacity, the tax
revenue-to-income ratio at least provides an adequate measure of a state’s burden of taxes on its residents.
Another way to view limitations on plan governance is the influence labor unions have upon plan administrators. Unions play a far bigger role in the public sector than in the corporate world. A large percentage of state employees belong to a union, providing strong bargaining power. Unlike in the private sector, unions for public workers do not sponsor retirement plans
(nearly all state employees are required to participate in the state’s plan), so state employee unions devote many resources toward keeping retiree benefits strong. State plans are
administered by state retirement boards, but all major plan changes must be approved by the legislature and governor. Therefore, if a state wants to reduce its future liabilities by reducing benefits, the legislature will likely come under much pressure from public employee unions.22 To maintain some control over plan financing, some state legislatures maintain control over cost-of-living adjustments, raising them on an ad-hoc basis rather than automatically. Fearing public backlash–unions do not make for good public enemies–most elected officials are reluctant to reduce state worker benefits. If the percentage of state workers that is unionized is very high in a state, the pressure to maintain benefits could be strong. Of course most unions also oppose the transition to DC plans, for many of the reasons already discussed. So the effect of unions may or may not be significant in the story of the switch to DC plans.
Political Ideology
A final motivation for switching a state’s primary retirement plan from a defined benefit to a DC plan is political ideology. The state legislature and governor have final administrative power over a state’s retirement plan, with control over fundamental plan characteristics. Any change in contributions, benefits, cost-of-living adjustments, or plan design must be approved via the legislative process. The political aspect of decision-making in public plans is markedly different than the administration of pensions in the private sector, where company managers and trustees control the plan. The explanation of why private plans switched from DB to DC centers around a corporation’s primary concern–the maximization of profit by minimizing cost. So
22 See Steffen (2001)
when considering the motivation of state plans in transitioning to a DC plan, the role of political ideology is a crucial variable.
The influence of political parties in economic decision-making at the state level was shown by Poterba (1994) in a study of state fiscal crises. Poterba found that when a single party controlled the state legislature and governorship, deficit adjustment was much faster than when party control was divided. This study confirmed the political theory of Alesina and Rosenthal (1994), which explains how decision-making is far more streamlined in governments where the legislative and executive branches are controlled by the same political party. Poterba could not, however, prove that one particular party (Republican or Democrat) had any substantial effect over the other with regard to deficit adjustment.
Because of the importance of the legislature and governorship in the decision to transition to a defined contribution plan, the influence of party control should be a very important variable. Furthermore, the variable can show if a particular party, when in control of a state government, tends to push through changes to state employee pensions. The control of state government is also very volatile; although state legislatures rarely change hands, the party of the governor tends to vary widely every election cycle.
Section IV: Data
Annual data on the financial status of state pension plans are very difficult to obtain. Although private plans are required by federal law to conduct periodic actuarial valuations, some states do not conduct these on a regular annual basis. Moreover, public plans often try to keep historical valuations as hidden as possible, especially if unfunded liabilities show an upward trend. Some summary public datasets do exist with this information, but they are sparse and often replete with missing data values. Prior to 2001, the Public Pension Coordinating Council
(PPCC) published data from its biannual Survey of State and Local Employee Retirement Systems. These data, known as the PENDAT files, provide financial data and plan
characteristics of nearly all state employee plans for the years 1995, 1997, 1999, and 2001. The PPCC ended its survey in 2001, but the Public Fund Survey took its place in the same year. A
joint venture of the National Association of State Retirement Administrators and the National Council on Teacher Retirement, the Public Fund Survey is an annual compilation of state plan
financial data, beginning in 2001. Although the plans surveyed by the PENDAT data and the Public Fund are not perfectly comparable, the common survey year of 2001 allows for
comparisons between the two.
I compile data biannually from 1995 to 2003 from the two summary surveys. A complication arises in that some states have different plans for their general employees, state police officers, teachers, judges, and elected officials. To try to keep comparisons as
homogenous as possible, I utilize the pension plan for general state employees for each state. These sometimes include teachers and police officers, but in other cases do not. This yields 49 observations per year for 5 time periods, a total of 245 observations (Nebraska, because it is the only state that started the period with a DC plans for its general state employees, was excluded from the sample). As mentioned, the data from PENDAT and the Public Fund are incomplete, and missing values were imputed where they could be found from state-provided publications. Still, nine values for state pension liabilities and assets are missing from the unbalanced panel from five states.23
The revenue/income ratio, representing the ability of a state to raise tax revenue, is calculated using publicly available data from the U.S. Government. The revenue numerator is the total tax collections for each state in fiscal years 1995-2003 from the U.S. Bureau of the
Census’ State Government Tax Collection Survey. The income denominator is from the Bureau
of Economic Analysis’ State Personal Income data. The level of unionization of government employees in each state is calculated using the Current Population Survey’s Annual
Demographic March Supplement.
Data on legislative body and governorship control come from the Council of State Governments. Since election years and fiscal years do not match up, and given that the composition of legislatures may change within a two-year election cycle, I do the best job possible of representing the political situation in each state at the end of fiscal years 1995, 1997, etc.24 To construct the dummy variables, a 1 is assigned to a state where one party controls both houses of the legislature and the governorship, and a 0 otherwise. This is the “Government Control” variable. To capture specific party effects, I construct another dummy variable with a 1 assigned to a state where the Republican Party controls the state legislature, and 0 otherwise (the “Republican” variable). The interaction of these two dummies, the “Party Control” variable, values 1 when the Republican Party controls the government and 0 otherwise. These variables should capture the effect of partisan control in state governments.
The final variable is the dependent dummy variable “switch.” The “switch” variable takes on a value of 1 if a state decides, in the following two years, to transition to a DC pension plan. The “switch” variable marks the period when a state government passes legislation to transition the state plan to a DC plan, not when the plan is actually implemented. There are 7 occurrences of the “switch” variable in the 8-year panel.
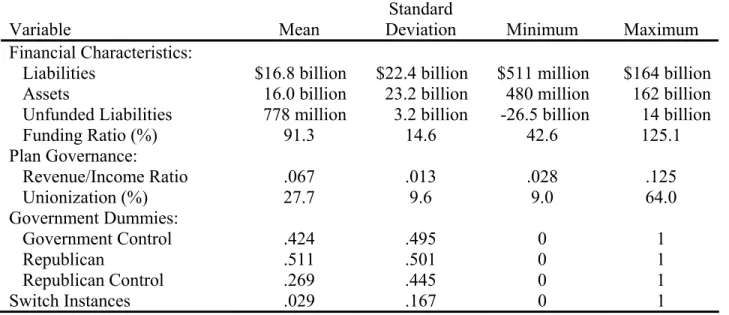
Summary statistics are presented in Table 5. The average amount of assets in state plans over the sample period is $16 billion, with a funding ratio of 91 percent. The average
24 The State of Nebraska does not have a bicameral legislature, another reason why excluding Nebraska from the
unionization level among public employees is 28 percent, with a reasonable amount of variation among states. The revenue/income ratio also shows relatively significant variation, with an average of about .07. When the sample is split between observations that transitioned to a DC plan and those that did not (Table 6), the differences seem rather minimal. The funding ratios and plan flexibility variables in both groups are virtually identical. States that transitioned to DC plans in the sample were larger than the average, with $23.4 billion in assets. The most
significant differences between the two groups are the political variables, with all seven states with DC plans having Republican-controlled legislatures at the time of transition. We therefore can expect the political variables to be significant in the overall decision to switch.
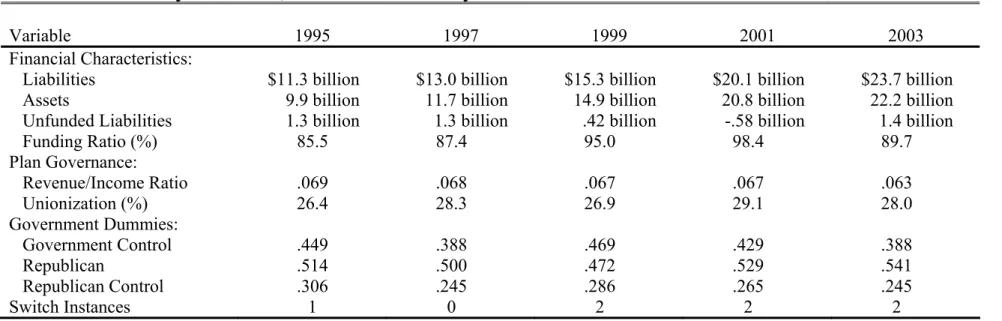
The observations are broken down over time in Table 7. The trend shows significant growth in the level of assets and liabilities in the state plans over time. The year 2001 is of particular interest, when the average level of unfunded liabilities for all the state plans is actually negative.25 These variations over time are clearly a reflection of the boom in capital markets in the late 1990’s, an upward trend in the funding ratio that was clearly reversed by the end of fiscal year 2003 after the market bubble burst. The variation in all other independent variables over time is minimal, as would be expected.
Section V: Empirical Estimation
Because all but one occurrence of switching occurred after fiscal year 1999, I begin with a simple cross-sectional regression with base year 1999. The “switch” variable takes a value of 1 if a state transitioned to a DC plan anytime after 1999. The equation is a probit model with the following form:
Pr(Swtich) = β0 + β1Ratioi1999 + β2Unionizationi1999 + β3Gov_Controli1999 + ei (1)
25 The funding ratio for 2001 is still below 100 as a result of the use of means in the sample statistics calculation,
The results of the regression are reported in Table 8. Since there are only 6 observations of the dependent variable, the number of explanatory variables needs to be kept at a minimum to ensure accurate standard errors. Therefore I include one variable from each “explanatory group.” Clearly, since none of the variables in regression (1) are significant at any level, other
explanatory variables should be substituted within the groups. For regression (2), I substitute the government control variable with the party control variable. This equation yields a coefficient on party control that is significant at the 10 percent level. I further replace the unionization variable with the revenue/income measure in regression (3), yielding a slightly significant coefficient for revenue/income. The third regression seems to be the best regression with the available variables. It indicates that Republican Party control of state legislatures in 1999 is a significant variable in a state’s decision to transition a DC plan in the following 6 years. The regression also indicates that states with high tax collections relative to income are less likely to transition to DC plans, confirming theoretical expectations.
The simple regression presents several problems, both practical and technical. First, some of the variables change significantly over time. The assets of a state’s plan in 1999 may not be able to predict why a state decides to transition to a DC plan in 2005. This problem is especially acute when considering partisan control of state governments. Also, the limitation on the number of variables that can be used with the regression make the equation prone to omitted variable bias. Moreover, the data may be subject to selectivity bias since the sample is non-random and a few states are omitted due to lack of data. Luckily, all of these problems can be solved by utilizing panel data.
Using an unbalanced panel over 5 time periods, biannual data from 1995-2003, I estimate a random-effects probit regression of the following form:
Pr(Swtich) = β0 + β1Ratioit + β2Unionizationit + β3Gov_Controlit + ei (4)
The results of this log likelihood regression are reported in Table 9. The data show that the government control variable is significant. Replacing the government control variable with the party control variable as before, regression (5) shows that the party control variable is extremely significant (at the 1 percent level). Attempting to find a significant variable on the plan
flexibility side, I once again replace the unionization variable with the revenue/income ratio, arriving at the final regression:
Pr(Swtich) = β0 + β1Ratioit + β2Revenue/Incomeit + β3Party_Controlit + ei (6)
The last equation shows that the only significant variable is the party control variable. The ratio variable, which is the best measure of plan financial status, is not significant. Substituting the measure of unfunded liabilities produces equally insignificant results, besides ignoring the relative size of the plans.
Section VI: Analysis
The results of the empirical estimation are very interesting and perhaps unexpected. One would predict that the financial status of a defined benefit plan would have the most impact upon a state’s decision to transition its pension to a DC plan. Yet the model above indicates that plan financial status has no significant impact upon a state’s decision to switch. This could be the result of the offsetting of financial motivations in different states. States with overfunded plans find it cheap and therefore opportunistic to transition to a DC plan, while underfunded states may elect to begin a DC plan simply to rid themselves of any future added liabilities and risk. To try to account for these divergent causes, I calculate an “absolute” ratio, the absolute value of the difference from 100 of a state’s funding ratio. Alas, this measure also proves highly
insignificant. No matter how the plan financials are analyzed, they do not hold any explanatory power in the probit regression.
If plan financials do not explain why states switch to a DC plan, then tangential effects from the administration of the plan must have some impact. The ability to raise revenue in order to increase contributions to a plan is crucial to plugging funding gaps. We expect states with a high tax burden, indicated by a high tax revenue/income ratio, to be able to fix an underfunded plan more easily, and therefore less likely to transition to a DC plan for its employees. The coefficient on the revenue/income variable in fact confirms this hypothesis, but ultimately proves insignificant. The level of unionization in a state looks to be even less important in the decision. This result could be expected, however, since unions oppose changing DB benefits as well as transitioning to a DC plan, motivations that would cancel out any observed effect.
The best explanation for the transition to DC plans in state employee pensions lies in the political process itself. Recall that a state plan can change form only through the legislative process and executive consent. The explanatory variables of plan financials and plan governance are only important in that they effect the decision of legislators and governors to actively change the plan. Thus the first two “explanatory groups” attempt to explain the motivation of elected officials to legislate DC plans into law (just as ERISA and employee demographics in the private sector explain why corporate executives choose to sponsor 401(k) plans). But ultimately, all of the possible explanations are not significant in the decision-making process. What is significant is that which is unexplainable.
The regression indicates that Republican-controlled governments are far more likely to begin DC plans for state employees. In fact, of the seven states that have transitioned, all had
Republican-controlled legislatures and only one did not have a Republican governor.26 This trend, as the regression proves mathematically, is certainly not a coincidence. That one party’s political ideology is the primary factor behind transitioning to a DC plan however is not
surprising. Research has shown that states have nothing to gain financially, and in fact lose money in the long run when transitioning to a DC plan. Economic theory elucidates that a self-interested entity, such as a state government in this case, does not choose a course of action unless it leads to a net gain, in either utility or profit. Theory shows and estimation proves that financial considerations play no significant part in the decision; that transitioning to a DC plan leads to a net monetary loss does not seem to matter to the decision-makers. What, then, do legislators and governors gain?
The best answer to this question is political capital, so termed. State legislators and governors belonging to the Republican Party gain some sort of utility from passing through laws that convert defined benefit plans to defined contribution plans. Unfortunately, data analysis is unable to deduce the utility that elected officials gain from passing such legislation. Yet some shared ideology must exist between members of the Republican Party that prompts them to found defined contribution plans for state employees in states whose governments it controls. The precise platform of the Republican Party in the past decade is beyond the scope of this study, yet recent developments in national politics do shed some light on the ideology that drives these pension plan conversions. After his 2004 election victory, Republican President George W. Bush proposed individual accounts for the defined benefit pay-as-you-go Social Security system, a move very similar to converting DB plans to DC plans. The ideology behind this potentially costly move was the continuation of an “ownership society” into the retirement income realm.
26 South Carolina
Perhaps this overarching ideology can explain why Republican-controlled governments have implemented DC plans in state governments across the country.
The implications of this result are substantial. All available research indicates that individual account retirement plans yield lower-than-expected returns at retirement. Unions and most public employees oppose defined contribution plans for this very reason. The loss of disability and survivor benefits is particularly troubling to state employees. If a political party is imposing defined contribution plans on state employees for political gain instead for more relevant financial reasons, the economic losses could be considerable.
States that have moved away from defined contribution plans for their state employees are a perfect example of these economic losses. In the past five years, two states have closed DC plans for their public employees: Nebraska and West Virginia (Table 1). Nebraska’s decision was based upon decades’ worth of experience of individual accounts for state workers. A 2000 study of benefit adequacy found that Nebraska’s state workers earned about four percentage points a year less than defined benefit pensions, and two percentage points below what is necessary for an adequate retirement.27 The state therefore closed its defined contribution plan to new employees in 2002 and created a cash-balance plan that better guarantees future
retirement income. Likewise, pressure from teachers’ unions forced the West Virginia
legislature to freeze the only defined contribution plan for teachers in the U.S. on July 1, 2005. Unions and lawmakers cited the stock market slump and poor investment decisions by
employees.28
Politically speaking, the experience of states moving away from DC plans provides mixed evidence. Nebraska’s 49-member unicameral non-partisan senate is unable to provide any
27 Buck Consultants (2000) 28 Messina (2005)
insight into the political process of pension legislation. West Virginia, by contrast, has a
legislature dominated by the Democratic Party as well as a Democratic governor. One can only speculate about the impact that these political divisions had upon the decision to shift away from DC plans, but the influence of unions on West Virginia’s Democratic legislature certainly seems clear. Likewise, the recent pension debate in California illustrates the influence of unions on Democratic legislators.
In 2004 Republican governor Arnold Schwarzenegger proposed converting the California Public Employee Retirement System (CalPERS), the nation’s largest defined benefit plan, into a defined contribution plan. The ballot initiative drew massive opposition from unions such as the California Teachers Association, Service Employees International Union, and the California Labor Federation, who worried about the security of retirement income that individual accounts would provide their members.29 After months of political wrangling, the Democratic California legislature killed the DC initiative. The CalPERS battle is a very important example of the influence of unions in the political process, especially upon Democrats.
The regression performed in this analysis is not able to explicitly capture the effect of unions on defined contribution initiatives that were not passed into law, like in California.
Clearly unions remain the largest barrier to enacting DC plans in state employee pensions. Yet the West Virginia and California examples indicate that the presence of a Democrat-controlled legislature may be necessary for the objections of labor unions to be heard. It is no secret that the Democratic Party largely supports and draws support from organized labor. So if Democrats do not have a majority in any branch of state government, then union objections may not be sufficient to block any defined contribution legislation. The party control variable in the
29 Chan (2005)
regression can therefore be interpreted as a proxy for lack of sufficient union political power. In this way, the political variables may in fact be a better measure of unionization.
Section VII: Conclusion
The days of generous pensions for public employees may be near an end. As more states shift their primary retirement plan to a defined contribution plan, public employees will lose the guaranteed annuity they expect when taking on a government job. The move to DC plans has been a generally positive one for the private sector, resulting in reduced costs for employers and more portable retirement accumulations for the mobile, service-based private workforce of the 21st century. The public workforce however is very different from the private world, as
employees stay with the state for nearly twice as long as their private sector counterparts and unions play a large role in bargaining with state agencies and legislatures. Moreover, in nearly all state plans the government saves no money in transitioning from a DB to a DC plan, and in fact loses money in the switch. And when considering finally the less-than-ideal retirement income received by owners of DC plans, the public sector switch to account-style plans imposes significant economic losses on both employers and employees.
If states choose to make uneconomic decisions in order to shift financial risk from themselves to the employees, the decision would seem rational, much like the unloading of risk by firms in the private sector. The regression however shows that plan financial status plays no part in the decision to switch. Furthermore, the ability of a state to change the benefit structure or funding of a defunct defined benefit plan has no effect on the decision to transition. The only possible reason that state governments would make the costly decision to switch is ideology–the unexplainable factor. Republican ideology is pushing DC plans through state legislatures while Democrats and their union supporters attempt to block the plans for public workers. In the end,
the decision to sponsor a DC plan for public employees appears to have more to do with politics than economics.
The limitations of data prevent the author from entirely ruling out plan funding status as a potential motivation for transitioning to a DC plan. Since every state makes its own liability calculation with a different set of assumptions for each state, comparability is not perfect. If a uniform algorithm could be developed to equalize liability calculations across states, a nation-wide comparison would be more accurate.
Also, further research should be conducted on the idea of ideology. Although the data show that the Republican Party is promoting DC plans in states, the national political party is not uniform in its platform across the U.S. Republicans in different states view policy much
differently; being able to capture this difference in ideology would allow readers of this study to draw more specific conclusions about who is pushing DC plans in certain states and why.
REFERENCES
Brainard, Keith. 2001-05. Public Fund Survey. National Association of State Retirement
Administrators. http://www.publicfundsurvey.org/
Buck Consultants. 2000. Benefit Review Study of the Nebraska Retirement Systems. Denver:
Buck Consultants, August.
Bureau of Economic Analysis. 2005. State and Local Personal Income Tables. http://www.bea.gov/bea/regional/spi/
Chan, Gilbert. 2005. “CalPERS leads fight on pension proposal.” Sacramento Bee, January 21.
Clark, Robert L., Lee A. Craig, and Jack W. Wilson. 2003. A History of Public Sector Pensions.
Philadelphia: University of Pennsylvania Press.
Council of State Governments. 1995-2004. The Book of the States. Lexington, KY: Council of
State Governments.
Ennis, Knupp & Associates. 1999. Florida State Board of Administration Investment Review First Quarter 1999. Chicago: Ennis, Knupp & Associates.
Fore, Douglas. 2001. “Going Private in the Public Sector: The Transition from Defined Benefit to Defined Contribution Pension Plans” In Pensions in the Public Sector, eds. Olivia S.
Mitchell and Edwin C. Hustead, 267-87. Philadelphia: University of Pennsylvania Press. Ford, William. 2005. 2004 Comparative Study of Major Public Employee Retirement Systems.
Madison, WI: Wisconsin Legislative Council.
Hustead, Edwin C. 1998. “Trends in Retirement Income Plan Administrative Expenses.” In Living with Defined Contribution Plans: Remaking Responsibility, eds. Olivia S. Mitchell and Sylvester J. Schieber, 167-77. Philadelphia: University of Pennsylvania Press for the Pension Research Council.
Illinois Municipal Retirement Fund. 1999. “The Defined Benefit versus Defined Contribution Debate: The $250 million Question.” Oak Brook, Ill.
Investment Company Institute. 2005. “Mutual Funds and the U.S. Retirement Market in 2004.”
Fundamentals 14 (4), August.
McDonnell, Ken. 2005. “Benefit Cost Comparisons Between State and Local Governments and Private-Sector Employers.” EBRI Notes 26 (4). Washington, D.C.: Employee Benefit
Research Institute, (April).
Morgantown, WV, August 9.
Mitchell, Olivia S., David McCarthy, Stanley C. Wisniewski, and Paul Zorn. 2001.
“Developments in State and Local Pension Plans.” In Pensions in the Public Sector, eds.
Olivia S. Mitchell and Edwin C. Hustead, 11-40. Philadelphia: University of Pennsylvania Press.
Munnell, Alicia and Annika Sundén. 2004. Coming Up Short: The Challenge of 401(k) Plans.
Washington, D.C.: The Brookings Institution.
Munnell, Alicia H. 2005. “Mandatory Social Security Coverage of State and Local Workers: A Perennial Hot Button.” Issue in Brief,No. 32. Chestnut Hill, MA: Center for Retirement
Research at Boston College, (June).
Munnell, Alicia and Annika Sundén. 2006. “401(k) Plans are Still Coming Up Short.” Issue in Brief,No. 43. Chestnut Hill, MA: Center for Retirement Research at Boston College,
(March).
Munell, Alicia H., Steven A. Sass, and Mauricio Soto. 2005. “Yikes! How to Think About Risk?” Issue in Brief,No. 27. Chestnut Hill, MA: Center for Retirement Research at
Boston College, (January).
National Association of State Retirement Administrators. 2005. “Myths and Misperceptions of Defined Benefit and Defined Contribution Plans.” NASRA White Paper. www.nasra.org
Poterba, James M. 1994. “State Responses to Fiscal Crises: The Effects of Budgetary Institutions and Politics.” Journal of Political Economy 102(4), 799-821.
Profit Sharing/401(k) Council of America. 2005. Forty-eighth Annual Survey of Profit Sharing and 401(k) Plans. Chicago.
Steffen, Karen. 2001. “State Employee Plans.” In Pensions in the Public Sector, eds. Olivia S.
Mitchell and Edwin C. Hustead, 41-65. Philadelphia: University of Pennsylvania Press. Tannenwald, Bob. 2002. “Interstate Fiscal Disparity in 1997.” New England Economic Review,
Third Quarter, 17-33.
Trager, Kenneth, James Francis, and Kevin SigRist. 2001. “Florida’s Public Pension Reform Debate.” In Pensions in the Public Sector, eds. Olivia S. Mitchell and Edwin C. Hustead,
288-312. Philadelphia: University of Pennsylvania Press.
U.S. Bureau of the Census. 1995-2003. State Government Tax Collections. Washington, D.C.:
U.S. Census Bureau Governments Division. http://www.census.gov/govs/www/statetax.html
Supplement: March.
U.S. Bureau of the Census. 1995-2003. State and Local Government Employee Retirement Systems. Washington, D.C.: U.S. Census Bureau Governments Division.
U.S. Department of Labor. 2004. Abstract of 1999 Form 5500 Annual Reports. Private Pension
Plan Bulletin.
U.S. Department of Labor. 2004. “Employee Tenure.” Employment and Earnings. From the
January 2004 supplement to the Current Population Survey.
U.S. Department of Labor. 2005. Abstract of 2000 Form 5500 Annual Reports. Private Pension
Plan Bulletin.
Zorn, Paul. 1995, 97, 99, 2001. Survey of State and Local Government Retirement Systems: Survey Report for Members of the Public Pension Coordinating Council. Chicago:
Table 1: Hypothetical Costs of
Private
DB and DC Retirement Plans
Defined Benefit Defined ContributionPay $100 $100 Employee Contributions 0 6 Employer Contributions 9 3 Total Contributions 9 9 Net Wages 100 94 Total Compensation 109 103
Table 2: Hypothetical Costs of
Public
DB and DC Retirement Plans
Defined Benefit Defined ContributionPay $100 $100 Employee Contributions 7 7 Employer Contributions 7 7 Total Contributions 14 14 Net Wages 93 93 Total Compensation 107 107
Table 3: Retirement Plan Contribution Rates for States with a DB and DC Plan
Defined Benefit Defined Contribution
State Employer Employee Employer Employee
Michigan 8.75% None 4%, match up to 3% 3% +
South Carolina 8.05% 6.5% 8.05% (3.05% for costs) 6.5%
Montana 6.9% 6.9% 6.9% (2.71% for costs) 4.19%
Florida 6.67% None 6.67% by employer, 9% total into
account paid for by $12 billion surplus
None
Ohio 13.31% 8.5% 13.31% (4.81% to health plan) 8.5%, less admin. fee
Colorado 10.15% 8% 10.15% 8%
Alaska 6.75% 6.75% 10.15% (5.15% for costs) 8%
Table 4: Summary of Primary Defined Contribution Plans for State Employees
State Date of Establishment Type Size of State DB Assets Funding Ratio (%) Closed?
Nebraska January 1, 1964 DC $707 million (DC: 12/31/02) N/A Y (1/1/03)
West Virginia June 30, 1991 (Teachers) DC $1.4 billion (DC: 7/1/04) N/A Y (6/30/05)
Michigan March 31, 1997 401(k) $8.8 billion (7/1/97) 109.0 N
South Carolina December 1, 2000 DC $17.3 billion (7/1/00) 89.0 N
Montana July 1, 2002 DC $3.1 billion (6/30/02) 100.0 N
Florida July 1, 2002 DC $99.4 billion (7/1/02) 115.0 N
Ohio January 1, 2003 DC $43.7 billion (7/1/02) 85.9 N
Colorado January 1, 2006 DC $28.6 billion (12/31/04) 70.1 N
Alaska July 1, 2006 DC $8.0 billion (6/30/04) 119.7 N
Table 5: Summary Statistics
Sample Statistics (N=236 observations)
Variable Mean
Standard
Deviation Minimum Maximum
Financial Characteristics:
Liabilities $16.8 billion $22.4 billion $511 million $164 billion Assets 16.0 billion 23.2 billion 480 million 162 billion Unfunded Liabilities 778 million 3.2 billion -26.5 billion 14 billion
Funding Ratio (%) 91.3 14.6 42.6 125.1 Plan Governance: Revenue/Income Ratio .067 .013 .028 .125 Unionization (%) 27.7 9.6 9.0 64.0 Government Dummies: Government Control .424 .495 0 1 Republican .511 .501 0 1 Republican Control .269 .445 0 1 Switch Instances .029 .167 0 1
Table 6: Summary Statistics, Variable Means by “Switch”
Switched Did not SwitchVariable (7 obs.) (229 obs.)
Financial Characteristics:
Liabilities $26.3 billion $16.5 billion
Assets 23.4 billion 15.8 billion
Unfunded Liabilities 2.9 billion .71 billion
Funding Ratio (%) 86.7 91.4 Plan Governance: Revenue/Income Ratio .060 .067 Unionization (%) 25.0 27.8 Government Dummies: Government Control .857 .412 Republican 1 .491 Republican Control .857 .252