Research Article
DEVELOPMENT AND VALIDATION OF A STABILITY INDICATING HPLC METHOD FOR
ANALYSIS OF PEFLOXACIN IN BULK DRUG AND TABLET DOSAGE FORM
VISHWANATH AGRAHARI
1*, MEENAKSHI BAJPAI
2, SANJU NANDA
31*College of Pharmaceutical Sciences, RKGIT, Ghaziabad-201003, Uttar Pradesh, India, 2Faculty of Pharmacy, Uttarakhand Technical
University, Dehradun, India, 3Department of Pharmaceutical Sciences, M.D. University, Rohtak-124001, Haryana, India.
Email:[email protected]
Received: 14 Jan 2013, Revised and Accepted: 28 Feb 2013 ABSTRACT
Objective: A simple, economic, selective, precise, and stability-indicating HPLC method has been developed and validated for analysis of Pefloxacin mesylate (PEF), both in bulk drug and in tablet dosage form.
Methods: Reversed-phase chromatography was performed on a C18 column with methanol-buffer (30:70 % v/v), as mobile phase at a flow rate of
1.0 mL/ min. Detection was performed at 277 nm and a sharp peak was obtained at a retention time of 5.1min. The degradation behaviour of drug was investigated under various stress degradation (hydrolytic, oxidative, photolytic and thermal) conditions recommended by international Conference of Harmonisation (ICH).
Results: Linear regression analysis data for the calibration plot showed there was a good linear relationship between response and concentration in the range 1.0–100 μg/ mL. The regression coefficient was 0.9996 and the linear regression equation was y = 203.32x + 10.69. Pefloxacin was found to degrade significantly in acidic conditions, oxidative stress and in presence of light. Mild degradation of the drug occurred in alkaline conditions. The drug was stable to dry heat. The method was validated for accuracy, precision, reproducibility, specificity, robustness, detection and quantification limits, in accordance with ICH guidelines.
Conclusion: Statistical analysis proved the method was precise, reproducible, selective, specific and accurate for analysis of PEF. The wide linearity range, sensitivity, accuracy, short retention time, and simple mobile phase imply the method is suitable for routine quantification of PEF with high precision and accuracy.
Keywords: RP-HPLC, Stress degradation, ICH guidelines, Validation.
INTRODUCTION
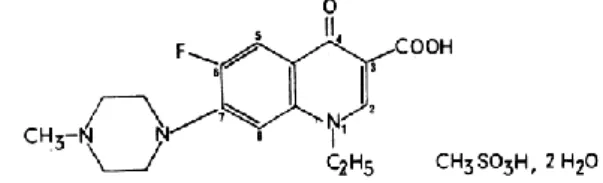
Fig. 1: Structure of Pefloxacin mesylate
Pefloxacin mesylate is described chemically as 1-ethyl-6-fluoro-7-(4-methylpiperazinyl-1)-4-oxo-1, 4-dihydro quinoline-3-carboxylic acid methanesulphonate Fig. 1. Its empirical formula is C18H24FN3O6S, 2H2O
and molecular weight is 465.5. Pefloxacin is a fluorinated quinolone with an extended anti-microbial spectrum against the majority of Gram negative and microbes (Martindale, 2002,[1]). Quinolones comprise a carboxylic group in position 3, and a carbonyl group in position 4, hence they are often referred to as 4-quinolones. Their anti- bacterial activity is greatly increased by the addition of 6-fluoro and 7-piperazinyl groups to the molecule and named fluoroquinolones. It possesses some favorable pharmacokinetic properties, such as complete absorption after oral administration, long half-life (10-12 hr) permitting infrequent dosage and rapid penetration into the intra-cellular and extracellular spaces. It is metabolized in the liver to an N-oxide derivative desmethyl-pefloxacin (norfloxacin), and excreted in the urine.
Suitable and sensitive analytical methods for determination of drug are essential for successful evaluation in their dosage form. Several analytical methods for quantitative determination of pefloxacin in pharmaceutical formulations and in biological fluids are described in the literature, such as Ni et al [2]. Basavaiah et al [3] and Mostafa et al [4], [5] studies include spectrophotometeric method for the determination of pefloxacin in pharmaceutical preparations and human plasma samples. Sun et al [6], Fierens et al [7] and Flurer [8] used capillary electrophoresis method for the estimation of pefloxacin. Several HPLC methods have been reported for assay of pefloxacin in biological fluids [9-11] and in pharmaceutical
preparations [12,13]. Salem et al [14] determined certain fluoroquinolones in pharmaceutical dosage forms and in biological Fluids. Beltagi [15] developed a fully validated square wave cathodic adsorptive stripping voltametric procedure for the determination of the pefloxacin drug in bulk form, tablets and human serum. Basavaiah et al [16] performed quantitative determination of pefloxacin mesylate by residual-base neutralisation method. The principal objective of this study was to develop a new, simple, economical, precise and stability indicating high performance liquid chromatographic (HPLC) method with a wide linear range and good sensitivity for assay of pefloxacin in the bulk drug and tablet dosage form using UV detection. The method was validated in accordance with International Conference on Harmonization (ICH) guidelines [17]. MATERIALS AND METHODS
Chemicals
Pefloxacin was procured from Sigma-Aldrich. HPLC grade methanol was purchased from Sigma Aldrich chemicals, India, HPLC grade Acetonitrile and buffer were purchased from Qualigens (India). High-purity water was prepared using Millipore water purification system. Other chemicals and reagents were of AR grade. Commercial tablets containing Pefloxacin (Pif Tab-400mg, Unichem) were procured from the local chemist shop.
Determination of appropriate UV wavelength
The appropriate wavelength for the detection of drug in mobile phase was determined by wavelength scanning over the range of 200-400 nm with a Shimadzu UV-1700 double beam spectrophotometer.
Instruments and Chromatographic conditions
Chromatography was performed under ambient conditions, with Adept series of Cecil HPLC Instruments comprising Adept CE 4100 dual piston pump and the Adept CE 4201 UV-Visible variable wavelength detector with 8μL x 10mm flow-cell for added flexibility.
The instrumentation was controlled by use of PowerStream data processing software and interface unit, CE 4901. The system is supplied complete with column and valve mounting panel, Rheodyne injection valve with 20μL loop. Compounds were separated on Ascentis C18 (Supelco) reversed-phase column with
dimensions of 15 cm × 4.6 mm, 5-μm. Stress studies under hydrolytic conditions were performed using water bath. Photolytic experiments were performed using a UV chamber. Hot air oven was used to study the effect of dry heat. A variety of mobile phases were investigated in the development of an HPLC method suitable for analysis of PEF in the bulk drug and in formulation. These included methanol–water, acetonitrile–water, methanol–phosphate buffer and acetonitrile–phosphate buffer in different ratio. The suitability of the mobile phase was decided on the basis of the sensitivity of the assay, suitability for stability studies, time required for the analysis, ease of preparation, and use of readily available cost-effective solvents. The same solvent mixture was used for extraction of the drug from the formulation containing excipients. The solvents were mixed, filtered through a membrane filter of 0.45micron pore and degassed in ultrasonic bath prior to use. The filtered mobile phase is delivered at 1.0 ml/min for column equilibration and the baseline was monitored continuously during this process.
Preparation of solutions Standard solution
A stock solution of PEF (100 μg/mL) was prepared by dissolving 10 mg drug in 10 mL mobile phase then transferring 1.0 mL of this solution to a 10-mL volumetric flask and diluting to volume. The mixture was sonicated for 30 min or until the standard dissolved completely. Appropriate dilutions of this stock solution were prepared using mobile phase to obtain solutions of known concentrations to be used for linearity studies and assay purposes. Sample preparation
Twenty tablets, each containing 400 mg pefloxacin were accurately weighed and finely powdered. A quantity of powder equivalent to 10 mg PEF was weighed and transferred to a 10 ml volumetric flask; 5 ml of mobile phase was added, shaken thoroughly to dissolve, was brought to volume, mixed well and centrifuged. 0.1 ml of supernatant was diluted to get the 10 μg/mL concentration. This diluted solution was filtered through a syringe filter (0.45μm) and 20 μl was injected into the HPLC column.
Degradation studies
Drug at a concentration of 1 mg/ml was used in all degradation studies. For hydrolytic degradation studies in acidic medium, drug solution was heated in 1.0 N HCl at 800C for 24h. The studies in
alkaline conditions were done in 1.0 N NaOH and the solution was heated at 800C for 24 h. For study in neutral conditions, drug was
dissolved in water and the solution was heated at 800C for 24 h.
Oxidative studies was performed in 10% H2O2 at room temperature
for a period of 24 h. For photolytic studies the aqueous solution of drug was kept in a UV chamber at shorter wavelength for duration of 4h. Susceptibility of the drug to dry heat was studied by exposing the solid drug to 500C for 7 days.
Method Validation Linearity
Calibration plots were constructed for standard solutions of drug by plotting the concentration of compound versus peak area response. Standard solutions containing 1, 2, 5, 10, 20, 40, 60, 80 and 100 μg/mL were prepared from the stock solution and filtered through a 0.22 µm membrane filter.The detection wavelength was 277 nm. 20 μl of prepared dilutions were injected in triplicate into the HPLC column. The linearity was evaluated by linear regression method. Accuracy, as Recovery
Accuracy was determined by the standard addition method. Previously analyzed samples of PEF (10 μg/ mL) were spiked with 0, 50, 100, and 150% extra PEF standard and the mixtures were
(%), and standard error of mean (SEM) were calculated for each concentration.
Precision
Precision of the HPLC method was determined by repeatability and intermediate precision, in accordance with ICH recommendations. Repeatability of sample injection was determined as intra-day variation and intermediate precision was determined by measurement of day variation. For both intra-day and inter-day variation, solutions of PEF at four different concentrations (5, 10, 15, and 20 μg/ mL) were determined in triplicate.
Specificity and selectivity
In order to test the selectivity of the present developed method for the analysis of formulated products, Pif Tab (400mg) were analyzed. The identification was performed by comparing the retention time of major peaks in the chromatogram of the assay solution with those in the chromatogram of the standard solution.
Robustness
The robustness of the HPLC method was determined by analysis of samples under a variety of conditions such as small but deliberate changes in the percentage of mobile phase methanol, in the pH and in the mobile phase flow rate. The effect on retention time, peak parameters and percent recoveries were studied.
RESULTS AND DISCUSSION
Determination of suitable wavelength
In order to investigate the appropriate wavelength the drug solution in mobile phase was scanned in the range of 200-400 nm. The maximum absorbance occurs at about 277 nm. Therefore, it was concluded that 277 nm is the most appropriate wavelength for analyzing the drug.
Method development and optimization
The isocratic-mode method with UV detection was developed for the determination of active ingredient, pefloxacin. The system suitability studies were carried out as specified in ICH. These parameters include column efficiency (N), retention time (Rt), tailing factor (T),
and capacity factor (k'). No internal standard was used because no extraction or separation step was involved. Of several solvents and solvent mixtures investigated, methanol-buffer (30:70 % v/v) was found to furnish sharp, well-defined peaks with very good symmetry (1.1) and low retention time 5.1min. Phosphate buffer pH was maintained at 2.8 with the help of phosphoric acid.
Degradation behaviour of pefloxacin: HPLC studies of samples obtained on stress testing of pefloxacin under different conditions using methanol-buffer (30:70 % v/v) as the mobile solvent system suggested the following degradation behaviour.
Hydrolytic studies
In acidic condition it was observed that around 28% of the drug degraded on heating it in 1.0 N HCl for 24 h at 800C but there was no
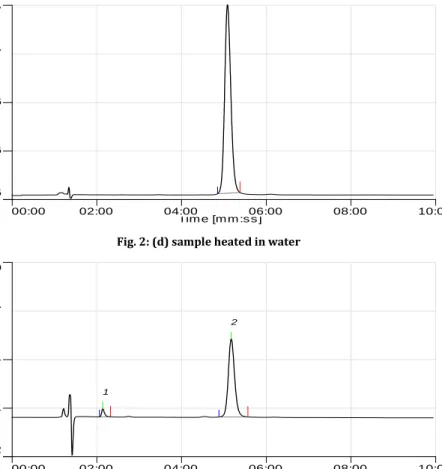
corresponding formation of degradation products (Fig. 2b) as compared to standard solution of the drug (Fig. 2a). This indicated that the drug degraded to nonchromophoric compounds. The results obtained on degradation of pefloxacin in alkaline condition was found to be 11% degradation (Fig. 2c). In neutral condition, only 1.5 % degradation of the drug was seen after heating the drug for 24 h at 800C (Fig. 2d).
Oxidative studies
Almost 48-50% drug degradation was observed on exposure to 10% H2O2 at room temperature for a period of 24 h. A small degradation
product peak at around 2.1 min was seen (Fig. 2e). Photolytic studies
Pefloxacin was found to be highly susceptible to light. About 40-42% degradation of the drug was seen after keeping the aqueous solution of drug in a UV chamber for duration of 4h at shorter wavelength mode (Fig. 2f).
Thermal stress
Pefloxacin was found to be stable to dry heat as negligible (<1%) degradation was seen after exposing the solid drug to 500C for 7 days (Fig. 2g).
Si
gn
al
[mV]
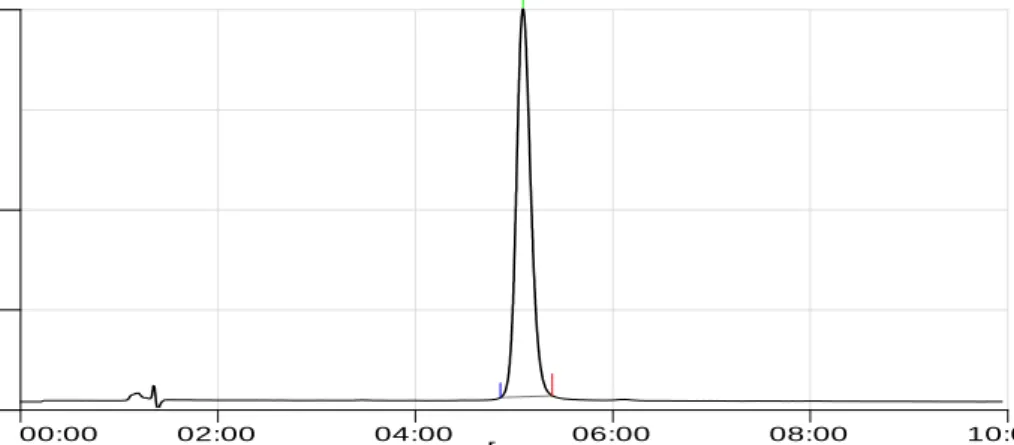
Tim e [m m :s s ] -5 46 98 149 200 00:00 02:00 04:00 06:00 08:00 10:00 1Fig. 2: (a) Standard solution of Pefloxacin
Si
g
n
a
l [
mV]
Time [mm :s s] -52 11 74 137 200 00:00 02:00 04:00 06:00 08:00 10:00 1Fig. 2: (b) sample degraded in 1 N HCl
Si
gn
al
[mV]
Tim e [m m :s s ] -51 12 75 137 200 00:00 02:00 04:00 06:00 08:00 10:00 1Si gn al [mV] Tim e [m m :s s ] -5 46 96 147 197 00:00 02:00 04:00 06:00 08:00 10:00
Fig. 2: (d) sample heated in water
Si gn al [mV] Tim e [m m :s s ] -52 11 74 137 200 00:00 02:00 04:00 06:00 08:00 10:00 1 2
Fig. 2: (e) sample subjected to oxidative degradation
Si gn al [mV] Tim e [m m :s s ] -3 27 57 86 116 00:00 02:00 04:00 06:00 08:00 10:00 1
Fig. 2: (f) sample subjected to photolytic degradation
Si gn al [mV] Tim e [m m :s s ] -5 46 96 147 197 00:00 02:00 04:00 06:00 08:00 10:00 1
Method Validation Linearity
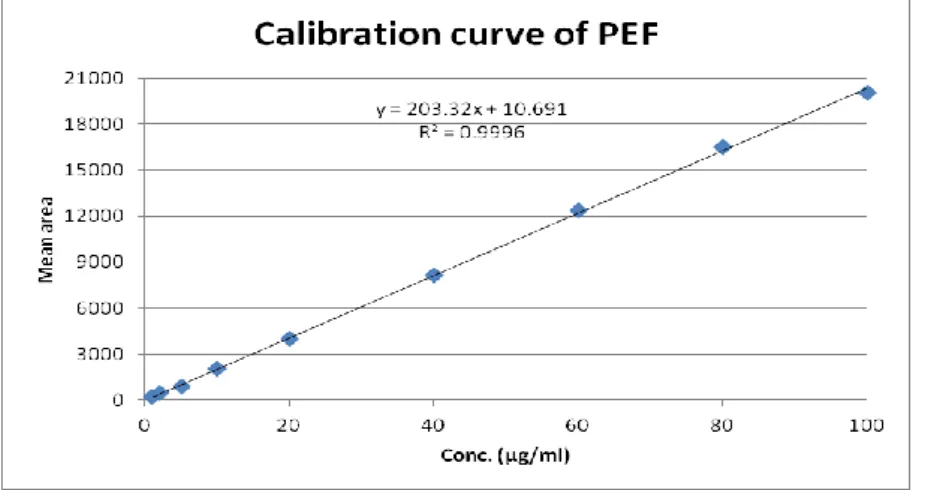
The calibration plot of peak area against concentration was linear in the range investigated (1.0 to 100 μg/ mL) Fig.3. Calibration data, with their relative standard deviations (RSD), standard error and 95% confidence intervals are listed in Table 1. The low value of RSD and standard error show the method is precise. The linear regression data for the calibration plot are indicative of a good linear relationship between peak area and concentration over a wide range. The linear regression equation was y = 203.32x + 10.691 and the regression coefficient was 0.9996.
Accuracy, as Recovery
The recovery of the method, determined by spiking a previously analyzed test samples of PEF (10 μg/ mL) with additional standard drug solution, was 99.93 to 100.83%. The values of recovery (%), RSD (%) and SEM listed in Table 2 indicate the method is accurate. Precision
The results obtained for repeatability studies and for intermediate precision are presented in Table 3. Method precision has a relative standard deviation (RSD) below 1.35% for repeatability and 1.47% for intermediate precision, which comply with the acceptance criteria proposed (RSD: not more than 2.0%).
Fig. 3: Calibration curve of Pefloxacin in mobile phase Table 1: calibration data of PEF
Conc. (μg/ml)) Mean area ± SD (n = 3) RSD (%) Standard error 95% Confidence Interval lower upper 1 226.25 ±2.71 1.19 1.56 219.27 232.73 2 444.1 ± 3.72 0.84 2.15 434.86 453.34 5 895.17 ± 9.68 1.08 5.59 871.12 919.22 10 2085.07 ± 11.86 0.57 6.85 2055.61 2114.53 20 3994.5 ± 20.75 0.52 11.98 3942.95 4046.05 40 8151.86 ± 32.78 0.40 18.92 8070.43 8233.29 60 12373.17 ± 120.92 0.98 69.81 12072.79 12673.55 80 16507.53 ± 114.34 0.69 66.02 16223.49 16791.57 100 20075.66 ± 207.77 1.03 119.96 19559.53 20591.79
Table 2: Accuracy of the method (n=3)
Amount (%) of drug added to analyte Theoretical content (μg/ml) Conc. Found (μg/ml) ± SD Recovery (%) RSD (%) SEM
0 10 10.02 ± 0.07 100.22 0.73 0.04
50 15 15.12 ± 0.19 100.83 1.25 0.11
100 20 20.02 ± 0.08 100.09 0.42 0.05
150 25 24.98 ± 0.17 99.93 0.67 0.1
Table 3: Precision of the method
Conc. (μg/ml) Repeatability (intra-day precision) Intermediate precision(inter-day)
Mean area (n = 3) SD (σ) RSD (%) SEM Mean area (n = 3) SD (σ) RSD (%) SEM
5 904.67 12.22 1.35 7.06 895.33 13.2 1.47 7.62
10 2012.33 18.61 0.92 10.74 2009.67 19.6 0.98 11.32
15 2977.67 25.97 0.87 14.99 2968.67 24.79 0.83 14.31
20 4001.33 32.13 0.8 18.55 4006.33 33.56 0.84 19.38
Specificity and selectivity
The HPLC chromatograms recorded for the mixture of drug excipients revealed almost no peaks within a retention time range of 10 min. None of the peaks appear at the retention time of pefloxacin. A representative chromatogram of pefloxacin (10 μg/ mL) is shown in Fig.2.a.
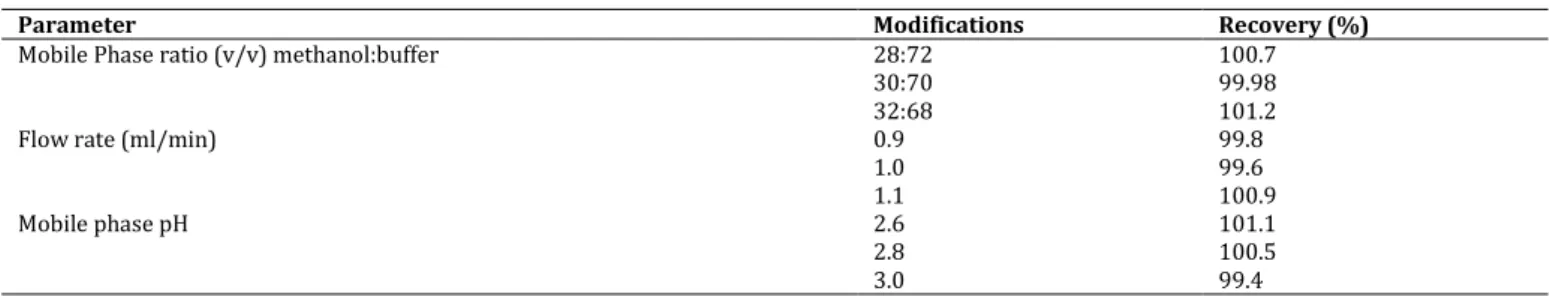
Robustness
The result of the robustness of the assay method is demonstrated in Table 4. Method robustness checked after deliberations of mobile phase composition, pH and flow shows that the changes of the operational parameters do not lead to essential changes of the performance of the chromatographic
system. The tailing factor for pefloxacin always ranged from 0.9 to 1.1. The percent recoveries were good under most conditions and did not show a significant change when the critical
parameters were modified. Considering the result of modifications in the system suitability parameters, it would be concluded that the method conditions are robust.
Table 4: Influence of changes in experimental parameters on the performance of chromatographic system
Parameter Modifications Recovery (%)
Mobile Phase ratio (v/v) methanol:buffer 28:72 100.7
30:70 99.98
32:68 101.2
Flow rate (ml/min) 0.9 99.8
1.0 99.6 1.1 100.9 Mobile phase pH 2.6 101.1 2.8 100.5 3.0 99.4 CONCLUSION
The separation was achieved by using an Adept Cecil HPLC System consisting of analytical column Princeton C18 (5μm; 250x4.6mm) along with CE 4201 UV-Visible variable wavelength detector with 8μL x 10mm flow-cell. Initial trial experiments were conducted, with a view to select a suitable solvent system for the accurate estimation of the drug. These included methanol–water, acetonitrile-water and acetonitrile–buffer in different ratio. A mobile phase system comprising of methanol-buffer (30:70 % v/v) was found to be optimum. Phosphate buffer was selected and pH maintained at 2.8 with the help of phosphoric acid. Detector response was observed at 277nm. The flow rate of 1.0 ml/min gave an optimal peak shape and was selected. Retention time was observed at 5.1 min. The method has been found to be better because of its wide range of linearity, use of an economical and readily available mobile phase, UV detection, lack of extraction procedures, low tR, no internal standard. REFERENCE
1. Martindale, 2002. The Extra Pharmacopoeia, 33rd ed., Royal
Pharmaceutical Society, London.
2. Ni Y, Wang Y, Kokot S. Multicomponent kinetic spectrophotometric determination of pefloxacin and norfloxacin in pharmaceutical preparations and human plasma samples with the aid of chemometrics. Spectrochimica Acta Part A: Molecular and Biomolecular Spectroscopy 2008; 70:1049-1059.
3. Basavaiah K, Prameela HC, Somashekar BC. Spectrophotometric determination of pefloxacin mesylate in pharmaceuticals. Acta Pharm 2007; 57:221-230.
4. Mostafa S, El-Sadek M, Alla EA.Spectrophotometric determination of enrofloxacin and pefloxacin through ionpair complex formation. J Pharm Biomed Anal, 2002; 28:173-180. 5. Mostafa, S., M. El-Sadek and.E. Awadalla, Spectrophotometric
determination of ciprofloxacin, enrofloxacin and pefloxacin through charge transfer complex formation. J Phar Biomed Anal., 2002; 27: 133-142.
6. Sun SW, Chen LY. Quantitative determination of gatifloxacin, levofloxacin, lomefloxacin and pefloxacin. J Chromatogr A 1997; 766:215–224.
7. Fierens C, Hillaert S, Van den Bossche W. The qualitative and quantitative determination of quinolones of first and second
generation by capillary electrophoresis. J Pharm Biomed Anal 2000; 22:763-772.
8. Flurer CL. Analysis of antibiotics by capillary electrophoresis. Electrophoresis 1997; 18:24-27.
9. Shahnaz Gauhar, Syed Ayub Ali, Harris Shoaib, Syed Baqir Shyum Naqvi, Iyad Naeem Muhammad, Development and Validation of a HPLC Method for Determination of Pefloxacin in Tablet and Human Plasma. Iran J Basic Med Sci, 2009; Vol.12 (1), 33-42.
10. Montay G, Blain Y, Roquet F, Le Hir A. High-performance liquid chromatography of pefloxacin and its main active metabolites in biological fluids. J Chromatogr 1983; 272:359-365.
11. Abanmi N, Zaghloul I, EI Sayed N, Al-Khamis KI. Determination of pefloxacin and its main active metabolite in human serum by high performance liquid chromatography. Ther. Drug Monit. 1996; 18:158-163.
12. Santoro MI, Kassab NM, Singh AK, Kedor-Hackmam ER. Quantitative determination of gatifloxacin, levofloxacin, lomefloxacin and pefloxacin fluoroquinolonic antibiotics in pharmaceutical preparations by HPLC. J Pharm Biomed Anal 2006; 40:179-184.
13. Sanzgiri D, Knaub SR, Riley CM. Quantitative determination of gatifloxacin, levofloxacin, lomefloxacin and pefloxacin fluoroquinolonic antibiotics in pharmaceutical preparations by HPLC. Anal Profiles Drug Subst Excipients 1994; 23:325–369. 14. Salem H., Khater W. and Fada L., Atomic Absorption
Spectrometric Determination of Certain Fluoroquinolones in Pharmaceutical Dosage Forms and in Biological Fluids. American Journal of Pharmacology and Toxicology, 2007; 2 (2): 65-74.
15. Beltagi AM. Determination of the antibiotic drug pefloxacin in bulk form, tablets and human serum using square wave cathodic adsorptive stripping voltammetry. J Pharm Biomed Anal 2003; 31:1079-1088.
16. Basavaiah K and Prameela H, Quantitative determination of pefloxacin mesylate by residual-base neutralisation method. J.Serb.Chem.Soc. 2004, 69(5) 403–410.
17. ICH Harmonised Tripartite Guideline- Validation of Analytical Procedures: Text and Methodology Q2 (R1) Nov 2005.