CloudSimSDN: Modeling and Simulation of
Software-Defined Cloud Data Centers
Jungmin Son∗, Amir Vahid Dastjerdi∗, Rodrigo N. Calheiros∗, Xiaohui Ji∗, Young Yoon†, and Rajkumar Buyya∗ ∗Cloud Computing andDistributed Systems (CLOUDS) Laboratory
Department of Computing and Information Systems The University of Melbourne, Australia
Email:{jungmins@student, amir.vahid@, rnc@, xiaohuij@student, rbuyya@}unimelb.edu.au †Samsung Electronics, South Korea
Email: [email protected]
Abstract—Software-Defined Networking not only addresses the shortcoming of traditional network technologies in deal-ing with frequent and immediate changes in cloud data cen-ters but also made network resource management open and innovation-friendly. To further accelerate the innovation pace, accessible and easy-to-learn testbeds are required which estimate and measure the performance of network and host capacity provisioning approaches simultaneously within a data center. This is a challenging task and is often costly if accomplished in a physical environment. Thus, a lightweight and scalable simulation environment is necessary to evaluate the network allocation capacity policies while avoiding such a complicated and expensive facility. This paper introduces CloudSimSDN, a simulation framework for SDN-enabled cloud environments based on CloudSim. This paper develops and presents the overall architecture and features of the framework and provides several use cases. Moreover, we empirically validate the accuracy and effectiveness of CloudSimSDN through a number of simulations of a cloud-based three-tier web application.
I. INTRODUCTION
Cloud computing [1] has provided economies of scale through cost-effective and elastic IT service paradigm. Service providers harness its benefits such as pay-as-you-use pricing model, elasticity and scalability to improve their quality of service and to reduce their cost. In cloud environments, elastic-ity and scalabilelastic-ity can be achieved by dynamically increasing or decreasing virtualized infrastructure resources, e.g. virtual machines (VMs). In fact, virtualization has increased the capacity and efficiency of cloud data centers to an extent with which traditional network paradigms cannot provide.
The demand for scalable and cost-efficient computer net-works with the support for multi-tenancy has led to the rise of Software-Defined Networking (SDN). SDN is a new way of centrally managing network switches with ability of fine-grained traffic management. SDN enables network elements to be dynamically programmable and controllable through a central controller. This is made possible in SDN by moving the data forwarding plane away from the data control plane. Controllers in SDN can oversee the entire network and thus efficiently perform dynamic bandwidth allocation per flow, faster recovery, and traffic consolidation, all of which can be exploited to improve QoS and energy efficiency [2][3].
In addition, the major promise of SDN is to accelerate the innovation pace in networking protocols, traffic management, virtualization, and software by opening up networking research to universities and research centers. The move started by the introduction of OpenFlow [4], a de facto standard interface for SDN controllers which is a result of the collaboration between a number of universities. OpenFlow describes an open interaction protocol in SDN that allows the controller to communicate with the forwarding plane and make dynamic changes to the network. This real-time responsiveness to traffic demands is an effective feature to deal with the dynamic nature of cloud data centers.
To further foster innovation and development, we require tools and toolkits that provide a testbed for experimenting with OpenFlow and Software-Defined Networking systems within a cloud data center. To this end, Mininet [5] is developed to emulate the network topology of OpenFlow switches. Thus, it enables testing different SDN-based traffic management poli-cies in controller. Nevertheless, Mininet concentrates solely on network resources and does not provide any environment to test other cloud resource management techniques such as VM placement along with network resources consolidation.To address this shortcoming, we introduce CloudSimSDN that enables the simulation of policies for the joint allocation of compute and network resources.
CloudSimSDN is a new simulation tool built on top of CloudSim [6] that has been briefly discussed in the context of Software-Defined Clouds [7] where resources are dynamically managed and configured in a data center via a centralized con-troller. In this paper, we discuss the essence of CloudSimSDN and present a detailed description of its design and implemen-tation. The framework is designed and built in such a way that is capable of evaluating resource management policies applicable to SDN-enabled cloud data centers. It simulates cloud data center, physical machines, switches, network links, and virtual topologies to measure both performance metrics to guarantee QoS and energy consumption to assure environment conservation and cost-reduction. In addition to those features, CloudSimSDN provides a Graphical User Interface (GUI) that simplifies the simulation configuration and reduces the
learning curve.
The CloudSimSDN accuracy is validated and its effec-tiveness is tested through a number of experiments. The experiments do not intend to provide a novel algorithm for traffic prioritization or host-network resource management but to prove the effectiveness of the simulator in a number of use case scenarios.
The remainder of the paper is organized as follows. In Section II, we describe the related works and highlight the uniqueness of our simulator. In Section III, we emphasize the requirements of the simulation, then Section IV provides the description of overall framework design and its components in detail. The validation process of the simulator is explained in Section V, followed by an evaluation with use case scenarios for three-tier applications in Section VI. Finally, the paper is concluded with a list of future directions.
II. RELATEDWORK
Recently, many cloud environment simulation tools were proposed to enable reproducible and controlled evaluation of new algorithms for management of cloud resources and applications. CloudSim [6] is a discrete event-based cloud simulator implemented in Java, enabling the simulation of data centers with a number of hosts. VMs can be placed in a host in accordance to VM placement policy. After creating VMs, workloads can be submitted and executed in VMs. Additional elements can be implemented and added to the simulator to operate with other entities by receiving and sending events. CloudSim does not support network evaluation in details.
NetworkCloudSim [8] simulates applications with commu-nication tasks in CloudSim. In this work, network elements such as switches and links are implemented and added in CloudSim and used to estimate network transmission time. However, they focused on modeling and simulating message-passing applications in a data center that does not include SDN and its dynamically configurable features. We emphasize sup-port of SDN features such as dynamic network configuration and adjustable bandwidth allocation.
The iCanCloud simulator [9] is a solution aiming at the simulation of large scale cloud experiments. It focuses on enabling a cost-performance analysis of applications executing on the cloud. Network simulation is enabled by the INET framework, which enables the simulation of network infras-tructures including devices (such as routes and switches) and protocols (such as TCP and UDP) [9]. It does not support the modeling and simulation of SDN controllers and related features.
GreenCloud [10] is a cloud simulator focusing on energy-efficiency research. It extends the NS2 simulator [11], and is able also estimate not only power consumption of computing resources but also from network resources. As for the previous cases, it cannot model and simulate features of SDN.
SPECI [12] is a simulator that focuses on modeling and simulating the data center middleware and failures in the underlying infrastructure. It focuses on analyzing the perfor-mance of the middleware under different network conditions.
It does not support modeling of cloud applications or SDN features.
RC2Sim [13] is a tool for experimentation and functionality tests of cloud management software via simulation and emu-lation in a single host. Network is simulated via a module that calculates expected data transfer times given a user-supplied cloud network topology. Unlike the previous sim-ulators, RC2Sim targets analysis of control commands to the cloud infrastructure (such as request for VM creation) rather than analysis of the performance of cloud applications using different policies and cloud environments.
Mininet [5] is a widely used SDN emulation tool to test SDN controllers. It emulates hundreds of nodes with different network topologies in a Linux machine using virtualization techniques provided by the Linux operating system, which presents more accurate results reflecting delays and congestion at the OS level. An external OpenFlow controller can be attached and tested in Mininet. Similarly, Linux programs can be executed in a virtual node. However, Mininet, similar to NS-3[14], is not capable of testing cloud-specific features such as VM placement policies, workload schedulers, etc.
Teixeira et al. [15] introduced a framework to test SDN cloud-data center controllers using Mininet and POX, a Python controller for OpenFlow SDN standard [16]. They used Mininet to manage network topologies and data traffics and POX to implement the controller of the framework. Thus, it can provide practical results and provide software that is ready-to-use in a real SDN environment. However, it does not allow simulation of cloud-specific features such as different configuration of VM types and application execution.
III. SOFTWARE-DEFINEDCLOUDDATACENTER SIMULATION: GOALS ANDREQUIREMENTS
Simulation is a valuable tool for initial research of new policies and techniques in distributed systems, as it enables re-producible experimentation in a controlled environment, which is hard to achieve in real cloud infrastructures. Simulation enables quick evaluation of strategies in different scenarios, which can be applied as an initial filter against approaches that underperform compared to existing approaches. As noted earlier, simulation tools exist to enable evaluation of policies for cloud infrastructures, although without support for SDN and all its benefits. Tools exist also that can simulate the effect of SDN controllers on response time of network packets, but without supporting cloud features.
As cloud infrastructures can benefit considerably from SDN and its capabilities, a tool that enables design and test of controller policies and its effect in cloud infrastructures is desirable, and this is the objective of the tool proposed in this paper. Thus, to achieve our goals of reproducible and controlled experimentation of Software-Defined Cloud data centers, we identified the following requirements:
• Capacity to represent core data center computing
ele-ments;
• Capacity to simulate flows and different policies that can be implemented per flow in the infrastructure;
CloudSimSDN
User code and scenario User Interface
Virtual Topology Configuration Workload Files Physical Topology Configuration User Requirements Cloud Scenario Simulation Specification
User or Data center broker Scheduling Policy
Virtual Machine Virtual Channel Virtual Topology Processing Execution VM Services Transmission Execution VM Management Network Management Network Provisioning VM Provisioning Resource Provisioning CPU Allocation Memory Allocation Storage Allocation Bandwidth Allocation Channel Allocation Resource Allocation
Host Switch Link
Data Center Cloud Resources
CloudSim Discrete Event Simulation Core
Processing Transmission Request
Workload
VM Placement policy Network policy
Graphical User Interface ...
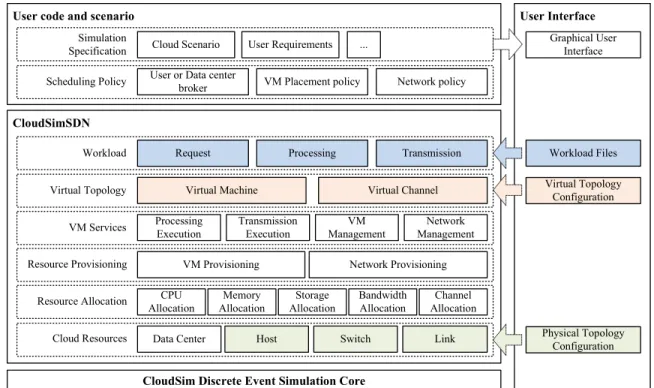
Fig. 1. CloudSimSDN architecture.
• Support for flexible description of virtual networks that can be deployed on top of the simulated physical network;
• Flexible model of applications, enabling representation of both data transfer and computational needs of the application;
• Support for reuse of network descriptions (network topologies and data flows), possible via some standard file output format; and
• Intuitive graphical user interface (GUI) for design of
physical and virtual topologies.
The above requirements drove the design and development of our framework, which we detail in the next section.
IV. FRAMEWORKDESIGN
Our SDN simulator, CloudSimSDN, is built on top of the CloudSim toolkit [6]. It leverages CloudSim’s capabil-ities of modeling computational elements of data centers and CloudSim’s simulation engine. To enable modeling and simulation of SDN, we added a number of components to simulate network traffic and SDN controller behaviors.
Figure 1 shows the architecture of CloudSimSDN. Users of our framework supply user code and scenarios. Physical and virtual topology configurations can be supplied either as JSON files or as program codes (which are written in Java). Another approach for user input is a GUI that translates requirements into physical and virtual topology configurations.
Besides infrastructure description, end-users’ requests de-scription, which compose the input workload for the simula-tion, are supplied in CSV files. Each workload should specify the submission time along with a list of job processing size
and traffic data size. In addition to workload and topology configurations, scheduling policies should be provided, such as VM placement algorithm and network policies. Brokers can be programmed to simulate the behavior of end-users or data centers. Regarding these policies, a user can either utilize built-in policies or can develop their own (by extend-ing abstract classes). The aforementioned user input feed to topmost elements of the architecture, namelyVirtual Topology andWorkload.
VM Servicesare in charge of managing VMs and network, by calculating application execution and packet transmission time between VMs. The next layer, Resource Provisioning, is composed of two modules. VM Provisioning is a core module to provision VMs within data center according to VM placement policy specified by simulator users. Network provisioning is performed according to the network policies in use in the simulation. The next layer,Resource Allocation, contains modules that allocate resources specified in the bot-tommost layer of the architecture,Cloud Resources.
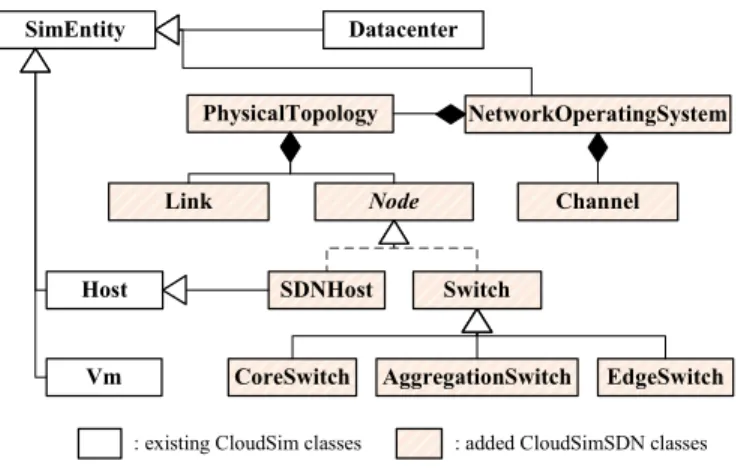
Figure 2 contains a simplified class diagram for the main classes of our approach. These classes are discussed in the rest of this section.
A. CloudSim core logic
The original CloudSim core logic is used to simulate the basic compute elements that compose the cloud infrastructure. On CloudSim, physical hosts can be defined with specific configurations and VMs are placed on the host that meets resource requirements such as CPU power, memory, and storage size. CloudSim simulates a range of elements of the
SimEntity Datacenter
Node
SDNHost Switch
CoreSwitch AggregationSwitch EdgeSwitch Channel Link
NetworkOperatingSystem PhysicalTopology
Vm
: existing CloudSim classes : added CloudSimSDN classes
Host
Fig. 2. CloudSimSDN Class Diagram.
cloud architecture, including data center, physical host, VM, VM scheduler, workload scheduler, etc. Although network bandwidth is one parameter of the configuration for physical machines and VMs, bandwidth in CloudSim is used only as a constraint for VM scheduler, and thus the proposed extension is necessary for modeling of SDN features for networking provisioning.
B. Abstracting physical and virtual topology
The physical topology includes hosts, switches, and links. VMs are placed in physical hosts, and network packets are transferred between hosts via switches. Hosts are specified with their computational power, memory, and storage size. Links connect a host to a switch or connect switches with specified bandwidth.
Similarly, virtual topology includes VMs and virtual links. VMs are described with the required computational power, memory, and storage size. Virtual links connect VMs with optional bandwidth amount. If the bandwidth is not specified in a virtual link, then the simulator assumes that communi-cation between them occurs without bandwidth reservation. Case users specify virtual links between two points, band-width reservation between the points need to be enforced. Because the path connecting such two points could be chosen among different paths of the physical topology, the problem of mapping the virtual topology on the physical one needs to be solved with some objective in mind (such as minimizing the average path length or minimizing the number of network devices involved in the solution). This problem is known as Virtual Network Embedding(VNE) problem. There are various researches conducted to solve the VNE problem [17], which can be implemented and tested in our simulator.
C. Network modules
To simulate packet transfer between VMs, we developed a Switch class performing SDN-enabled switch function man-aged by a controller. Forwarding rules are installed by the controller’s Network Operating System, and can be dynami-cally changed depending on the network traffic. The virtual links connecting switches and/or VMs are represented with a
Channelclass that defines the physical path capacity of such channels. The class holds a list of physical network elements, such as switches and hosts, along with physical links between those elements.
Once a network packet is generated from a VM and sent to the underlying host, it is forwarded to the destination host using a channel through forwarding routes. By default, a channel is shared by all packets if they are sent from the same source VM to the same destination VM. Since different virtual channels could share the same physical link, each physical link also maintains the list of channels passing through the link itself. If a new channel is created and added to the link, the link updates the shared bandwidth of all channels which passes through the link.
By using theNetwork Operating System, it is also able to create a dedicated channel for a specific traffic flow. As SDN allows the controller to differentiate network flows depending on the type of traffic, our framework also can create a channel for a specific flow with dedicated bandwidth allocation. In this case, an extra channel is created in addition to the default channel, and the packets with specific flow id are forwarded using the new channel.
Network Operating Systemclass represents the central con-troller managing the overall network behavior of the simu-lation. It monitors all the network’s channels and packets, and decides how to reconfigure each network element. User-defined network policies can be developed by extending this class. It also calculates the estimated arrival time for each packet based on the allocated bandwidth for each channel and the number of packets sharing the same channel. If there is more than one channel sharing a link, each channel size is also included in the bandwidth calculation.
Functions and behaviors supported by SDN are imple-mented in the Network Operating Systemclass. For example, if dynamic bandwidth allocation is necessary to be simulated, policies specifying how to allocate bandwidth to each flow are implemented in this class.
D. Calculating packet transmission time
Simulation of network requires that the transmission time for data transferred between hosts is calculated. Calculation is straightforward if the data is transmitted for one hop that is not shared with other hosts. However, it is more complicated to estimate travel time when the packet needs to be transferred to the host via multiple hops where some are shared by other hosts. In fact, data is fragmented into several packets involved in multiple fragmentation process on each network layer depending on protocols. The fragmentation processes are complicated and varied on different protocols.
Therefore we simplify the transmission process model and the estimation of transmission time. We introduce the class Channel, an end-to-end edge from sender to receiver consisting of multiple links. It is a path for data packets that are going through a series of queues of ports in different switches. The class Link is a physical medium between ports of switches
Activity Request 1 1 1 1 1 -payload 1 1 * Processing Transmission Package Cloudlet
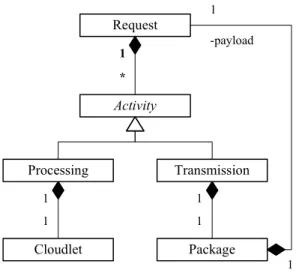
Fig. 3. User request modeling.
or hosts. The class Transmission refers the transferring data between two hosts which travels through the channel.
In each link, bandwidth is first allocated to the priority channel if SDN is configured to allocate a specific amount of bandwidth to the channel. Afterwards, the remaining band-width is equally shared by the channels passing through the link. Thus, allocated bandwidth BWc,l for a channelc in the link l is defined as BWc,l = BWN l
l , where the link (l) has
available bandwidth (BWl) shared by the number of channels (Nl).
As a channel is composed of multiple links, the transmission speed of the channel basically depends on the least bandwidth among the links. Even if some links have higher bandwidth, there would be a bottleneck when packets pass through a link with lower bandwidth. Thus, for the time period ∆t, when no channel has been added or removed, the amount of data Dc transferred from sender to receiver on a channelc can be calculated with Equation 1:
Dc= ∆t×M in(BWc,l) (1) When a new channel is added, Network Operating System informs all links where the new channel passes through, and existing channels are updated with a new lower bandwidth value. Channels and links are also updated when a data transmission is finished and the allocated channel is deleted. In this case, the remaining channels will have more bandwidth as there is one less channel using the link. Updated bandwidth values are used to calculate the size of data transferred for the next time period.
E. Abstracting user requests
In practice, a job associated with network transport can be abstracted as a combination of computation processing interleaved with packet transfers. For example, in a web service model, when a request is received at the front-end server, e.g. web server, the front-end server computes the
request and creates another request to the mid-tier server, e.g. application server. In the same way, when the mid-tier server receives a request, it processes the request, and sends another request to the back-end server, e.g. database server.
In order to model a request containing both workloads and network transmissions, three classes are implemented: Re-quest,ProcessingandTransmission(see Figure 3).Requesthas a list of eitherProcessing or Transmission, while Processing contains a computation workload (Cloudlet) and Transmission has a network transmission requirement (Package). Several Processing and Transmission objects can compose a Request which should appear in order. If Transmission is appeared after Processing in the Request, the Request is sent to the next VM that is supposed to execute the following Processing. For easy use, list of requests can be input in a CSV format in which has multiple pairs of Processing and Transmission.
In order to estimate network transfer time for each packet, we introduce a Queue in nodes for each flow. For example, if a flow is set up between two hosts, the queue should be set up in the sender’s host as well as in all switches that packets go through.
F. GUI modules
On top of CloudSimSDN application logic, we also devel-oped a GUI to enable visualization of the simulation input and output. The GUI facilitates description of both physical and virtual topology by drawing elements such as hosts, switches, VMs, and links. The topologies can be saved and loaded in JSON file format. It also supports direct execution of the simulation using the loaded topologies and workload files.
The GUI module consists of three layers: Framework layer, Business layer, and Interface layer. The Framework layer consists of the core graphic modules to draw the graphical user interface and the programming interface to supply the topologies to the underlying application logic. The Business layer is in charge of connecting the core logic to the Interface layer. GraphView is the core part of the Business layer where network topologies can be drawn by using the graph visualization library, i.e. Java Swing.SDNExecutionperforms CloudSimSDN simulation and presents the output. On top of it, the Interface layer is used to interact with users by defining user-friendly interface.
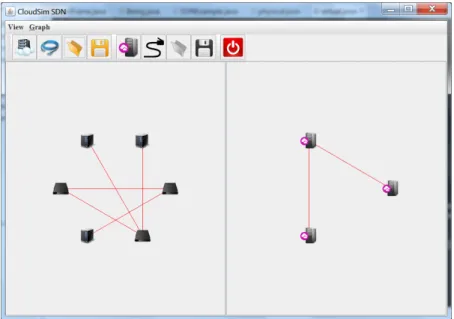
A screenshot of the GUI is shown in Figure 4. In the center two main panels are to visulize the physical and logical topologies. The tool bar above the main panels has several buttons to be selected to draw vertices and edges for each topology as well as to import and export to files. Management functions are also executable through the GUI, such as starting simulation execution, and showing the simulation result.
V. VALIDATION
Validation of CloudSimSDN is a focal point when it comes to the applicability of the simulation. In order to validate CloudSimSDN, we have conducted a series of experiments that compare CloudSimSDN and Mininet with the same workload. As noted earlier, Mininet is a network emulator
Fig. 4. Screenshot of the graphical user interface of CloudSimSDN in the network topology design mode. The left panel contains the physical network topology while the right panel contains the virtual topology.
for the creation of virtual network using the Linux kernel and measurement of data transmission time sent via OS protocol stack. Since it uses the actual Linux kernel for the network emulation, Mininet generates more realistic results, and is widely used to measure SDN-based traffic management policies in controller. Our goal is to first build scenarios with different data sizes and different shortest paths between hosts (including different network elements). Next, for each scenario we analyze how close is the data transfer time between hosts in CloudSimSDN and Mininet which can demonstrate the accuracy of the CloudSimSDN.
A. Mininet setup
Environment for Mininet experiments is set up in Python using Mininet Python API [18]. Network topology in Mininet is created by adding and configuring hosts, switches, and links, and then each host is scheduled to start data transmission at the same time with other hosts simultaneously. To achieve it, we developed: 1) monitoring agents to measure data transmission time between hosts; 2) Sender agents that generate dummy data with specified size and send it to the receiver agent. Before data transmission begins, the program waits until the given time to make sure all senders start transmission at the same time. When the receiver agent on the other side finishes receiving all data, it sends back an acknowledgement. Once done, the monitoring agent calculates the transmission time. Time clocks of the emulated hosts within Mininet are synchronized as they share the same system clock.
B. Testbed configuration
We created a tree topology of depth 2 with four hosts (see Figure 5). The root is a core switch which has two edge switches as child nodes. The leaves are four physical machines connected to the edge switches. Although a tree topology
Core Switch
Edge Switch Edge Switch
Physical machine Physical machine
Controller
VM1 VM2
Physical machine Physical machine
VM3 VM4
Fig. 5. Physical topology configuration for the validation test.
can be effortlessly configured, it can support a number of scenarios, e.g. data sending from VM1 to VM2 passes through only an edge switch, while data from VM2 to VM3 passes through the entire network. In addition, we created one VM in each physical machine in CloudSimSDN because Mininet does not allow VM simulation. Hence, each VM represents a physical machine in Mininet. The configured link speed between core and edge switches, and between edge switches and hosts, are shown in Table I.
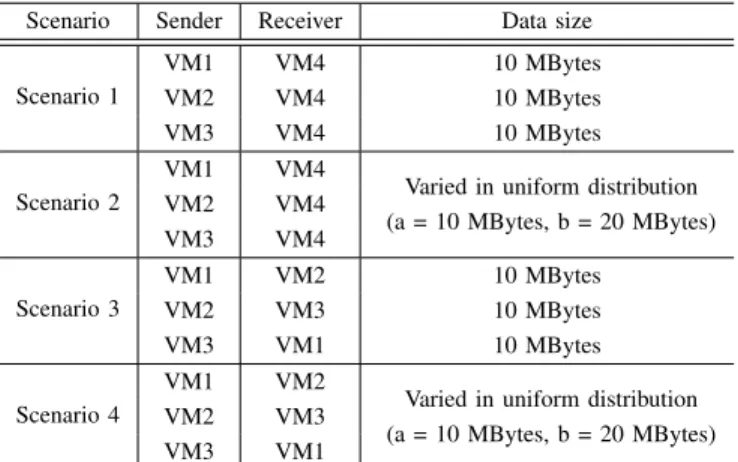
In each scenario in Table II, each host is configured to send data with different sizes to the other hosts at the same time, which makes links be shared among multiple connections. As
TABLE I
LINK CONFIGURATION FOR THE VALIDATION EXPERIMENTS.
Link Bandwidth
Core↔Edge switches 10 Mbps
(1.25 MBytes/sec)
Edge switches↔Hosts 10 Mbps
(1.25 MBytes/sec)
TABLE II
VARIOUS SCENARIOS FOR VALIDATION.
Scenario Sender Receiver Data size
Scenario 1 VM1 VM4 10 MBytes VM2 VM4 10 MBytes VM3 VM4 10 MBytes Scenario 2 VM1 VM4
Varied in uniform distribution (a = 10 MBytes, b = 20 MBytes) VM2 VM4 VM3 VM4 Scenario 3 VM1 VM2 10 MBytes VM2 VM3 10 MBytes VM3 VM1 10 MBytes Scenario 4 VM1 VM2
Varied in uniform distribution (a = 10 MBytes, b = 20 MBytes)
VM2 VM3
VM3 VM1
shown in Table II, scenarios differ in the path that the data travels. All transmissions are set up to start at the same time, hence if the data size is not the same, some transmissions finish earlier than other transmissions, and then the links, which are shared by terminated transmission, will have more bandwidth for the rest of connections.
C. Validation results
Figure 6 shows the measured transmission time in CloudSimSDN and Mininet for the four scenarios described in Table II. In Scenario 1 for the fixed data size, the difference between CloudSimSDN and Mininet is at most 2.5%. When we have variable data size and the same path in Scenario 2, for the majority of cases (for each of which data size is randomly generated based on the distribution described in Table II) the differences is below 4.6%. In Scenario 3, where the path includes more network elements, the difference slightly increased compared to Scenario 1. For the case of Scenario 4, with the same path as Scenario 3 and variable data size, there is only a narrow increase in the difference. This is because factors that affect the network performance, such as TCP window size, OS layer delay, fragmentation latency, etc., are abstracted away from the simulation model. However, this slight loss of accuracy comes with extra advantage of enabling larger-scale evaluation (as our framework does not limit the number of simulated hosts) and also representation of the whole software stack (including the application running on the cloud platform) in the evaluation scenario, as we demonstrate in the next section.
0 0.5 1 1.5 2 2.5 3 VM1→VM4 VM2→VM4 VM3→VM4 T rans m iss ion T im e (se cond s) CloudSimSDN Mininet (a) Scenario 1 0 1 2 3 4 5 C ase 1 C ase 2 Case 3 C ase 4 C ase 5 C ase 6 C ase 7 C ase 8 C ase 9 C ase10 C ase11 C ase12 Case 13 C ase14 C ase15 T ransm issi on T im e (se con d s) VM1→VM4 VM1→VM4 VM2→VM4 VM2→VM4 VM3→VM4 VM3→VM4 CloudSimSDN Mininet (b) Scenario 2 0 0.2 0.4 0.6 0.8 1 VM1→VM2 VM2→VM3 VM3→VM1 T ransm ission T im e ( se con d s) CloudSimSDN Mininet (c) Scenario 3 0 0.5 1 1.5 2 C ase1 C ase2 Case 3 C ase4 C ase5 C ase6 C ase7 C ase8 C ase9 C ase 10 C ase 11 C ase 12 Case 13 C ase 14 C ase 15 T rans m issi on T im e (se cond s) VM1→VM2 VM1→VM2 VM2→VM3 VM2→VM3 VM3→VM1 VM3→VM1 CloudSimSDN Mininet (d) Scenario 4
Fig. 6. Comparison of CloudSimSDN with Mininet for average transmission time for each scenario.
VI. USECASEEVALUATION
We focus on two use cases (built in the context of multi-tier web applications) to demonstrate the simulator capabilities
TABLE III
VMCONFIGURATIONS USED FOR JOINT HOST-NETWORK ENERGY
EFFICIENT RESOURCE ALLOCATION USE CASE.
VM Type Cores MIPS Bandwidth
Web Server 2 2000 100 Mbps App Server 8 1500 100 Mbps DB Server 8 2400 100 Mbps Proxy 8 2000 500 Mbps Firewall 8 3000 500 Mbps TABLE IV
ENERGY CONSUMPTION AND THE MAXIMUM NUMBER OF
SIMULTANEOUSLY UTILIZED HOSTS FOR DIFFERENTVMPLACEMENT
POLICIES.
Algorithm Energy consumption (Wh) Max Nodes
Hosts Switches Total Hosts Switches
Worst Fit (A) 2,396,380 112,492 2,508,871 100 11
Best Fit (B) 1,848,038 92,493 1,940,532 30 4 Energy saving (A-B) 548,341 (23%) 19,999 (18%) 568,340 (23%) -
-and to highlight the advantages of adopting SDN in data centers. The use cases are joint host-network energy efficient resource allocation and traffic prioritization to improve QoS of priority users. Note that such evaluation can only be done with CloudSimSDN (not Mininet) as our simulator supports both compute and network simulations.
A. Joint host-network energy efficient resource allocation The first use case evaluates the energy savings in SDN-enabled cloud data center via VM consolidation. If resources are consolidated, unused hosts and switches can be switched off by the controller, which maximizes energy efficiency. In this experiment, we tested different VM placement policies and estimated the energy consumption of hosts and switches. For the test, a data center with 100 hosts and 11 switches is created in CloudSimSDN. Each host is configured with 16 processing cores, and each of them has a capacity of 4000 MIPS. The link bandwidths of host-network connections are set to 1 Gbps.
500 VM creation requests are generated based on randomly selected VM types specified in Table III, and each request has different start time and lifetime following exponential distri-bution and Pareto distridistri-bution respectively [19]. The network workload is also created for the execution time of VMs to ensure switches are working throughout the VM lifetime. We assumed that VMs are fully utilized and continuously generate network traffic.
We evaluated two commonly used heuristics for VM place-ment: Best Fit and Worst Fit. The Best Fit policy selects a host whose resources are the most utilized but still available to accommodate allocation requests. In this approach, VMs tend to be consolidated to a smaller number of hosts, and network traffic between hosts can be reduced as more VMs are placed within a host. In contrast, the Worst Fit algorithm selects the
Host 1 Host 8 Host 91 Host 100 Host 2
...
. . .
. . .
...
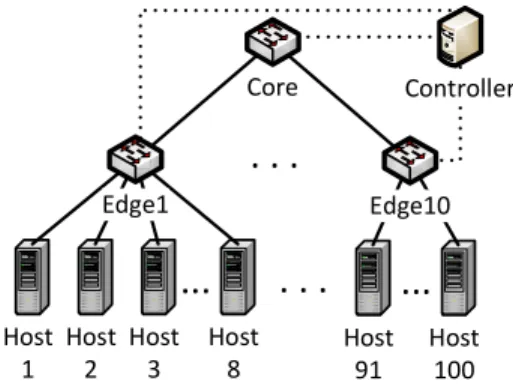
Host 3 Edge10 Core Edge1 ControllerFig. 7. Physical topology for traffic prioritization use case evaluation.
TABLE V
VMCONFIGURATIONS FOR TRAFFIC PRIORITIZATION USE CASE.
VM Type Cores MIPS
Web Server 2 2000
App Server 2 1500
DB Server 8 2400
freest host which has the maximum available resources, in which VMs can maximize their computational power. To find the most or the least utilized host, we used a normalized unit to combine CPU requirements (total MIPS) and bandwidth constraints, since the two dimensional requirements should be considered at the same time. Power consumption for hosts and switches are modeled based on the works by Pelley at al. [20] and Wang et al. [21], respectively.
We compared the result of the two algorithms in terms of two metrics: energy consumption of hosts and switches, and the maximum number of simultaneously utilized nodes. As shown in Table IV, the result depicts that overall 23% of energy consumption of the data center can be saved when the Best Fit is applied for VM placement. Although this result is mainly attributed to the hosts that saved 23% of their power consumption in Best Fit, consolidation of network traffic and deactivation of idle switches also saved 18% of energy usage from switches.
B. Traffic prioritization
In traditional cloud data center networks, prioritizing net-work traffic based on the user type was difficult due to complexity and overhead of configuring network elements in such a dynamic environments. However, it is viable in SDN-enabled cloud data center to allocate bandwidth to premium users. This is because the controller is fully aware of network topology and traffic and is capable of controlling queues in SDN switches and dynamically assigning flows to network paths. In this use case, we demonstrate how CloudSimSDN effectively models this capability of SDN.
In simulation, we modeled a data center with depth 3 tree topology and 100 hosts (see Figure 7). That is, one core switch connected to 10 edge switches, and each edge switch connected to 10 hosts. Each host is configured with 16
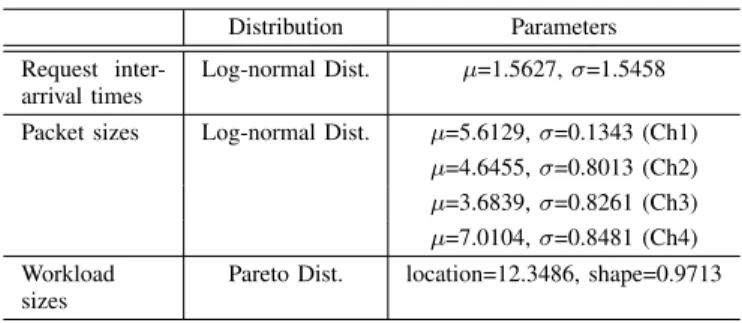
TABLE VI
CHARACTERISTICS OF REQUESTS USED FOR TRAFFIC PRIORITIZATION
EVALUATION. REQUESTS ARE BASED ON THE MODEL PROPOSED BY
ERSOZ ET AL. [22].
Distribution Parameters
Request inter-arrival times
Log-normal Dist. µ=1.5627,σ=1.5458
Packet sizes Log-normal Dist. µ=5.6129,σ=0.1343 (Ch1)
µ=4.6455,σ=0.8013 (Ch2)
µ=3.6839,σ=0.8261 (Ch3)
µ=7.0104,σ=0.8481 (Ch4)
Workload sizes
Pareto Dist. location=12.3486, shape=0.9713
processing cores and 8000 MIPS processing capacity. Physical links are configured with 1Gbps (125 MBytes/sec) bandwidth and 0.5 msec latency.
There are 50 different customers using the cloud infras-tructure in total, 10 users among them are premium users. Each user has an application running on three VMs: Web Server, App Server, and DB Server. Configuration of each VM is shown in Table V. As this experiment aims at evaluating application processing and network performance, the sizes of RAM and storage are not considered as constraints. In the sim-ulation environment, the controller can create separate virtual channels for different data flows. The idea is to allow priority traffic to consume more bandwidth than normal traffic. Thus, virtual channels between VMs are dynamically segmented into two different channels: priority channel and standard channel. By default, without traffic prioritization (when SDC is not used) a standard channel is used to transfer data between VMs regardless user priority where the bandwidth is evenly shared among all packets in the same channel. In contrast, by enabling traffic prioritization feature, a specific amount of bandwidth is exclusively and dynamically allocated for the priority channel, and thus such a bandwidth becomes unavailable for other channels.
For each user, different workloads are generated synthet-ically based on a typical web service model [22]. Table VI shows the characteristics of synthetic data used for the eval-uation. Each request consists of five application processing and four data transmissions in between. At first, processing is done in the Web Server, and then the request is passed to App Server via network transmission. Similarly, App Server has processing and requests data to DB Server. DB Server processes data and return to App Server. Finally, Web Server receives processed data from App Server and responds to the end-user.
When traffic prioritization is enabled, for each priority chan-nel we exclusively provide minimum of 333 Mbps bandwidth. If the bandwidth demand from priority channels exceeds the link capacity, it is equally shared among the priority channels, and no bandwidth is allocated to the standard channels. To make the experiment simple, traffic prioritization is simplified in the simulation without considering sophisticated traffic
0
1
2
3
4
5
A
v
er
a
g
e
R
es
p
o
n
se
T
im
e
(s
ec
o
n
d
s)
w/o prioritization w/ prioritization
(a) Average response time for premium users.
1.636 1.929 1.325 2.009 0 0.5 1 1.5 2 2.5 Premium Users Normal Users A v er a g e R e sp o n se T im e (s ec o n d s)
w/o prioritization w/ prioritization
(b) Average response time for different user types.
Fig. 8. Effect of traffic prioritization.
shaping methods. We measured the response time for each request from submission at the Web Server until return to the end-user.
Figure 8a shows detailed performance improvement for each premium user when traffic prioritization is enabled. While response times for Premium User 5 to 10 have remained almost same, Premium User 1 to 4 experienced improvement in application performance. The reason is when the Premium User 1 to 4 are entered, the system experienced higher load and therefore assigning the exclusive bandwidth to the flow of priority requests decreased the response time. This dynamic allocation of bandwidth per-flow is an important feature of SDN to control the QoS in data centers.
In addition, as shown in Figure 8b, average application response time for premium users decreased from 1.636 to 1.325 seconds when traffic prioritization is enabled, in which performance is improved by 19.0% on average. On the other hand, overall response time for normal users is slightly in-creased from 1.929 to 2.009 seconds.
Via this use case, we show how cloud providers can use SDN flow management capability to offer services with various QoS levels. As demonstrated, there is a certain amount of bandwidth reserved for the priority channel that allows priority requests to be served in much shorter time. However, still policies need to be developed to dynamically derive this certain amount of bandwidth based on the changes in the workload, the user QoS requirements (maximum response
time), and the priorities of users.
VII. CONCLUSIONS ANDFUTUREWORK
To accommodate the increasing demand for cloud computing-related services, there is an increasing need of scalable and cost-efficient data center computer networks sup-porting multi-tenancy. Software-Defined Networking enables such features in cloud data centers by allowing network ele-ments to be dynamically controlled through the programmable controller that can overlook the entire network.
Given that the infrastructures where SDN operates are large-scale, methods that enable evaluation of SDN configurations before the controller configurations are crucial, and it can be achieved via simulation. To this purpose, we introduced in this paper the design and implementation of a simulation framework for Software-Defined Cloud infrastructures. The SDN controller is programmable in the simulator, as well as VM management policies and workload scheduling algorithms can be tested in the same framework.
We described our framework design and its components in detail. Validation experiments showed that our simulator is comparable to Mininet in terms of accuracy, and provides the extra features of supporting the arbitrary number of simulated hosts and the simulation of the whole cloud software stack up to the application layer. We also discussed two use cases demonstrating the potential of joint host and network energy-efficient resource allocation and three-tier application, to pri-oritize data traffic depending on the user type.
As future work, we will combine a practical SDN emulator that supports direct plug-in of OpenFlow SDN controller, e.g. Mininet, with our framework to improve the ease of testing and the accuracy of the network model. We will also add support for modeling and simulation of middleboxes and Virtualized Network Functions.
ACKNOWLEDGEMENTS
Authors would like to thank Nikolay Grozev for his com-ments on improving the paper. This work is partially supported by a Future Fellowship from the Australian Research Council (ARC) and the Samsung Global Research Outreach (GRO) Program.
REFERENCES
[1] R. Buyya, C. S. Yeo, S. Venugopal, J. Broberg, and I. Brandic, “Cloud computing and emerging it platforms: Vision, hype, and reality for
delivering computing as the 5th utility,” Future Generation computer
systems, vol. 25, no. 6, pp. 599–616, 2009.
[2] H. Jin, T. Cheocherngngarn, D. Levy, A. Smith, D. Pan, J. Liu, and N. Pissinou, “Joint host-network optimization for energy-efficient data
center networking,” inProceedings of the 2013 IEEE 27th International
Symposium on Parallel Distributed Processing (IPDPS), May 2013, pp. 623–634.
[3] K. Zheng, X. Wang, L. Li, and X. Wang, “Joint power optimization
of data center network and servers with correlation analysis,” in 2014
IEEE Conference on Computer Communikations, INFOCOM 2014, Toronto, Canada, April 27 - May 2, 2014, 2014, pp. 2598–2606. [Online]. Available: http://dx.doi.org/10.1109/INFOCOM.2014.6848207 [4] N. McKeown, T. Anderson, H. Balakrishnan, G. Parulkar, L. Peterson, J. Rexford, S. Shenker, and J. Turner, “Openflow: enabling innovation in
campus networks,”ACM SIGCOMM Computer Communication Review,
vol. 38, no. 2, pp. 69–74, 2008.
[5] B. Lantz, B. Heller, and N. McKeown, “A network in a laptop: Rapid
prototyping for software-defined networks,” inProceedings of the 9th
ACM SIGCOMM Workshop on Hot Topics in Networks, ser. Hotnets-IX. New York, NY, USA: ACM, 2010, pp. 19:1–19:6. [Online]. Available: http://doi.acm.org/10.1145/1868447.1868466
[6] R. N. Calheiros, R. Ranjan, A. Beloglazov, C. A. De Rose, and R. Buyya, “Cloudsim: a toolkit for modeling and simulation of cloud computing
environments and evaluation of resource provisioning algorithms,”
Soft-ware: Practice and Experience, vol. 41, no. 1, pp. 23–50, 2011. [7] R. Buyya, R. N. Calheiros, J. Son, A. V. Dastjerdi, and Y. Yoon,
“Software-defined cloud computing: Architectural elements and open
challenges,” in Proceedings of the 3rd International Conference on
Advances in Computing, Communications and Informatics (ICACCI 2014), IEEE. IEEE Press, 2014.
[8] S. K. Garg and R. Buyya, “Networkcloudsim: Modelling parallel
applications in cloud simulations,” in Proceedings of the 2011 Fourth
IEEE International Conference on Utility and Cloud Computing (UCC
’11). Washington, DC, USA: IEEE Computer Society, 2011, pp.
105–113. [Online]. Available: http://dx.doi.org/10.1109/UCC.2011.24 [9] A. N´u˜nez, J. L. V´azquez-Poletti, A. C. Caminero, G. G. Casta˜n´e,
J. Carretero, and I. M. Llorente, “iCanCloud: A flexible and scalable
cloud infrastructure simulator,” Journal of Grid Computing, vol. 10,
no. 1, pp. 185–209, Mar. 2012.
[10] D. Kliazovich, P. Bouvry, and S. U. Khan, “GreenCloud: a packet-level
simulator of energy-aware cloud computing data centers,” Journal of
Supercomputing, vol. 62, no. 3, pp. 1263–1283, Dec. 2012. [11] “The network simulator ns-2,” http://www.isi.edu/nsnam/ns/, 1989. [12] I. Sriram, “SPECI, a simulation tool exploring cloud-scale data
cen-tres,” in Proceedings of the First International Conference on Cloud
Computing Technology and Science (CloudCom), ser. Lecture Notes in
Computer Science. Springer, 2009, vol. 5931, pp. 381–392.
[13] D. Citron and A. Zlotnick, “Testing large-scale cloud management,”IBM
Journal of Research and Development, vol. 55, no. 6, Nov. 2011. [14] “The network simulator ns-3,” http://www.nsnam.org/.
[15] J. Teixeira, G. Antichi, D. Adami, A. Del Chiaro, S. Giordano, and A. Santos, “Datacenter in a box: Test your sdn cloud-datacenter
con-troller at home,” inProceedings of the 2013 Second European Workshop
on Software Defined Networks (EWSDN), Oct 2013, pp. 99–104.
[16] NOXRepo.org. About pox. [Online]. Available:
http://www.noxrepo.org/pox/about-pox/
[17] A. Fischer, J. Botero, M. Till Beck, H. de Meer, and X. Hesselbach,
“Virtual network embedding: A survey,”Communications Surveys
Tuto-rials, IEEE, vol. 15, no. 4, pp. 1888–1906, Fourth 2013.
[18] Mininet Team. Mininet python api reference manual. [Online]. Available: http://mininet.org/api/annotated.html
[19] K. Mills, J. Filliben, and C. Dabrowski, “Comparing vm-placement
algorithms for on-demand clouds,” in Proceedings of the 2011 IEEE
Third International Conference on Cloud Computing Technology and Science (CloudCom), Nov 2011, pp. 91–98.
[20] S. Pelley, D. Meisner, T. F. Wenisch, and J. W. VanGilder,
“Understand-ing and abstract“Understand-ing total data center power,” inWorkshop on
Energy-Efficient Design, 2009.
[21] X. Wang, Y. Yao, X. Wang, K. Lu, and Q. Cao, “Carpo:
Correlation-aware power optimization in data center networks,” inProceedings of
the 2012 IEEE INFOCOM, March 2012, pp. 1125–1133.
[22] D. Ersoz, M. S. Yousif, and C. R. Das, “Characterizing network traffic
in a cluster-based, multi-tier data center,” in Proceedings of the 27th
International Conference on Distributed Computing Systems, 2007. ICDCS’07. IEEE, 2007, pp. 59–59.