Drought under global warming:
a review
Aiguo Dai
∗This article reviews recent literature on drought of the last millennium, followed by an update on global aridity changes from 1950 to 2008. Projected future aridity is presented based on recent studies and our analysis of model simulations. Dry periods lasting for years to decades have occurred many times during the last millennium over, for example, North America, West Africa, and East Asia. These droughts were likely triggered by anomalous tropical sea surface temperatures (SSTs), with La Ni ˜na-like SST anomalies leading to drought in North America, and El-Ni ˜no-like SSTs causing drought in East China. Over Africa, the southward shift of the warmest SSTs in the Atlantic and warming in the Indian Ocean are responsible for the recent Sahel droughts. Local feedbacks may enhance and prolong drought. Global aridity has increased substantially since the 1970s due to recent drying over Africa, southern Europe, East and South Asia, and eastern Australia. Although El Ni ˜no-Southern Oscillation (ENSO), tropical Atlantic SSTs, and Asian monsoons have played a large role in the recent drying, recent warming has increased atmospheric moisture demand and likely altered atmospheric circulation patterns, both contributing to the drying. Climate models project increased aridity in the 21st century over most of Africa, southern Europe and the Middle East, most of the Americas, Australia, and Southeast Asia. Regions like the United States have avoided prolonged droughts during the last 50 years due to natural climate variations, but might see persistent droughts in the next 20–50 years. Future efforts to predict drought will depend on models’ ability to predict tropical SSTs. 2010 John Wiley & Sons, Ltd.WIREs Clim Change2011 2 45–65 DOI: 10.1002/wcc.81
WHAT IS DROUGHT?
D
rought is a recurring extreme climate event over land characterized by below-normal precipitation over a period of months to years. Drought is a temporary dry period, in contrast to the permanent aridity in arid areas. Drought occurs over most parts of the world, even in wet and humid regions. This is because drought is defined as a dry spell relative to its local normal condition. On the other hand, arid areas are prone to drought because their rainfall amount critically depends on a few rainfall events.1Drought is often classified into three types2,3:
(1)Meteorological drought is a period of months to years with below-normal precipitation. It is often accompanied with above-normal temperatures, and
∗Correspondence to: [email protected]
National Center for Atmospheric Research, Boulder, CO, USA
DOI: 10.1002/wcc.81
precedes and causes other types of droughts. Mete-orological drought is caused by persistent anomalies (e.g., high pressure) in large-scale atmospheric circula-tion patterns, which are often triggered by anomalous tropical sea surface temperatures (SSTs) or other remote conditions.4–6Local feedbacks such as reduced evaporation and humidity associated with dry soils and high temperatures often enhance the atmospheric anomalies.7(2)Agricultural droughtis a period with
dry soils that results from below-average precipitation, intense but less frequent rain events, or above-normal evaporation, all of which lead to reduced crop pro-duction and plant growth. (3)Hydrological drought occurs when river streamflow and water storages in aquifers, lakes, or reservoirs fall below long-term mean levels. Hydrological drought develops more slowly because it involves stored water that is depleted but not replenished. A lack of precipitation often trig-gers agricultural and hydrological droughts, but other factors, including more intense but less frequent pre-cipitation, poor water management, and erosion, can
also cause or enhance these droughts. For example, overgrazing led to elevated erosion and dust storms that amplified the Dust Bowl drought of the 1930s over the Great Plains in North America.8
Few extreme events are as economically and ecologically disruptive as drought, which affects mil-lions of people in the world each year.3 Severe drought conditions can profoundly impact agricul-ture, water resources, tourism, ecosystems, and basic human welfare. Over the United States, drought causes $6–8 billion per year in damages on average, but as much as $40 billion in 1988.9 Drought-related
dis-asters in the 1980s killed over half a million people in Africa.10 The effect of drought varies with coping
capabilities. For example, people living in regions with advanced irrigation systems, such as those in devel-oped countries, can mitigate the impacts of drought much better than farmers in Africa and other develop-ing countries who often have limited tools to combat droughts and other natural disasters. As global warm-ing continues, the limited capabilities in developwarm-ing countries will become an increasingly important issue in global efforts to mitigate the negative impact of climate change.
HOW DO WE QUANTIFY DROUGHT?
In this section, I describe the indices commonly used to monitor and quantify drought. Drought is characterized by three main aspects2: intensity, duration, and spatial coverage. Intensity is the degree of the precipitation, soil moisture, or water storage deficit; it may include consideration of the severity of the associated impacts. Drought typically lasts for several months to a few years, but extreme drought can persist for several years, or even decades for so-called mega-drought.11 The latter is linked to SSTdecadal variations in the low-latitude Pacific and Indian Oceans12,13and the North Atlantic Ocean.14–16
Severe, prolonged droughts may be punctuated by short-term wet spells. Mild droughts may occur over a small region (e.g., a few counties), but severe ones can cover most of a continent, such as the Dust Bowl drought in the 1930s over North America.5,8
In modeling studies,4–6 simple precipitation anomalies, preferably normalized by standard devi-ation (SD) over regions with large gradients, are often used to represent dry and wet conditions. Although precipitation is often the dominant factor determin-ing the aridity of a region, local droughts and wet spells are determined by the cumulative effect of the imbalance between atmospheric water supply (i.e., precipitation or P) and demand (i.e., potential evap-otranspiration or PE). The former (P) is controlled
largely by atmospheric processes, whereas the latter (PE) is determined by near-surface net radiation, wind speed, and humidity.17
To better monitor and quantify drought, various drought indices have been developed.10,18–21 Table 1
compares the most commonly used drought indices. A drought index usually measures the departure from the local normal condition in a moisture variable based on its historical distribution. For meteorological drought, precipitation is the primary variable in computing the indices, with secondary contributions from surface air temperature to account for the effect of evaporation in some of the indices, such as the Palmer Drought Severity Index (PDSI). For agricultural drought, soil moisture content (not always measured) is often used, whereas streamflow is commonly used in measuring hydrological drought. Keyantash and Dracup20
evalu-ated the performance of a number of commonly used drought indices based on data from two local climate zones in Oregon, USA, and suggested that the rainfall deciles (RD), computed soil moisture (CSM), and total water deficit are the top performing indices for mete-orological, agricultural, and hydrological drought, respectively.
The PDSI is the most prominent index of mete-orological drought used in the United States.19It also
has been used to quantify long-term changes in aridity over global land in the 20th35,36and 21st37,38century,
and in tree-ring based reconstructions of drought.39,40 The PDSI was created by Palmer22 with the intent to measure the cumulative departure in surface water balance. It incorporates antecedent and current mois-ture supply (precipitation) and demand (PE) into a hydrological accounting system. Although the PDSI is a standardized measure, ranging from about−10 (dry) to+10 (wet), of the surface moisture condition that allows comparisons across space and time, the normal climate conditions tend to yield more severe PDSI in the Great Plains than other US regions.41
To improve the spatial comparability, one may re-normalize local PDSI to have a standard deviation (SD) similar to that in the central United States, where the Palmer model was calibrated,22 or use the
self-calibrated PDSI,42 which re-calibrates to local
conditions and appears to be a superior drought index.43,44 The PDSI is also imprecise in its
treat-ment of all precipitation as immediately available rainfall (i.e., no delayed runoff from melting snow), its lack of impact of vegetation or frozen soils on evaporation, the non-locally calibrated coefficients,24 and some other processes.23 For example, Hobbins et al.45 found that the PE estimate using the Thorn-thwaite equation46 in the original Palmer model
TABLE 1 Comparison of Commonly-used Drought Indices (see R efs 20, 21 for m ore details) Type Index N ame C alculation Drought Classificatio n Strength Wea kness References an d A pplied A rea Meteorologicaldrought Palmer Drought Severity Index (PDSI) Ba sed on a 2-la yer bucket-type wa ter balance m odel, the PDSI measures the depa rture of moisture ba la nce from a normal condition − 4 . 0 or less: extreme drought; − 3 . 0t o − 3 . 99: severe drought; − 2 . 0t o − 2 . 99: moderate drought; − 1 . 0t o − 1 . 99: mild drought; − 0 . 5t o − 0 . 99 :inc ipient dry spell; 0.49 to − 0 . 49: near normal Considers both w ater supply (precipita tion) an d dema nd (potential evap otra nspira tion) Does not work well over mountainous and snow cov ered area s; m ay require re-norma liz at ion Refs 22–24; mostl y the U ni ted States, but also globe Standardized Prec ipita tion Index (SPI) Fi tting an d tra nsforming a long-term precipitation record into a normal distribution with respect to the SPI, whi ch has zer o mean and uni t SD . − 2 or less: extremely dry; − 1 . 5t o − 1 . 99: severel y dry; − 1 . 0t o − 1 . 49: modera tely dry; − 0 . 99 to 0.99: near normal Can be computed for dif ferent time scales; symmetric for both dry and wet spells; rela tes to proba bility Requires long-term prec ipita tion da ta ;no consideration of evaporation Refs 25, 26; any area by drought planners Ra infa ll Dec iles (RD) Ranking rainfall in the past 3 m onths against the climatological record of 3-month ra infa ll, whic h is div ided into 10 qua ntiles or dec iles dec iles 1–2 (lowest 20 % ): muc h below normal; deciles 3–4: below normal; dec iles 5–6 :n ea r norma l Prov ides a sta tistica lmea sure of precipitation; performed well in limited tests Requires long-term prec ipita tion da ta ;no consideration of evaporation Ref 27; Austral ia AgriculturalDrought Computed Soil Moisture (CSM) Soil moisture content is computed by a la nd surfa ce m odel forced with observed precipitation, temperature and other atmospheric forcing Drought may be defined based on the percentiles of the CSM, e.g., ≤ 20th percentile: very dry; 20–40%: dry; 40–60%: near normal Considers antecedent conditions Requires atmospheric forcing da ta an d a la nd surfa ce model Refs 28–30; the U nited Sta tes, globe Pa lmer Moisture Anomaly Index ( Z -index ) The Z -index is the m oisture anomaly for the current month in the Palmer model Percentiles of the Z -index ma y be used to define drought Rapid response to current prec ipita tion defic it Does not consider antecedent conditions Refs 22, 24; the U nited Sta tes HydrologicalDrought Total w ater deficit ( S ) S = D × M ,w he re D is the dura tion during which the strea m flow is below the normal level and M is the av era ge depa rture of strea m flow from the long-term mea n during period D S may need normalization in defining drought Simple ca lc ula tion No sub-basin information, no standard drought classification Ref 31; the U nited Sta tes Palmer Hydrological Drought Index (PHDI) Computed using the same Palmer model as for the PDSI, but w ith a more stringent criterion for the termination of the drought or wet spell Va lues simila r to PDSI, but w ith smoother variations Use of a wat er bal ance model to account for the ef fect of both prec ipita tion and tempera ture Does not work well over mountainous and snow cov ered area s; m ay require re-norma liz at ion Ref 22; mostly the U nited Sta tes Surface W ater Supply Index (SWSI) C al cul at ed by ri ver basi n based on snowpack, streamflow, precipitation, and reservoir storage Norma liz ed va lues simila r to PDSI Considers snowpack and wa ter stora ge Basin-dependent formulations Refs 32, 33; the w estern Uni ted States RegionalD rought Drought Area Index (DAI) Percentage of a given region under drought condition based on a drought intensity index Drought is defined based on a sepa ra te index Quantifies drought areal extent Does not provide the mean intensity of drought over the region Ref 34; anywhere Drought Severity Index (DSI) Area-weighted m ean of a drought intensity index over the drought area in a giv en region Drought is defined based on a sepa ra te index Qua ntifies drought sev erity over a region Does not provide drought areal extent Ref 35; anywhere
the Thornthwaite PE is based only on temperature and latitude. This error can be minimized, how-ever, by using the Penman-Monteith (PM) equation,37 which accounts for the effects of radiation, humidity, and wind speed and works best over Australia in a comparison of various PE formulations by Donohue et al.47
Despite these caveats, PDSI values are signifi-cantly correlated with measured soil moisture content in the warm season and streamflow over many regions over the world,36 and thus can be used as a drought
index over the low and middle latitudes. Further-more, the PDSI uses both precipitation and surface air temperature as input, in contrast to many other drought indices that are based on precipitation alone20 (Table 1). This allows the PDSI to account for the basic effect of surface warming, such as that occurred during the 20th century36 and may occur in the 21st
century,38 on droughts and wet spells. The effect of
surface temperature, which accounts for 10–30% of PDSI’s variance, comes through PE. As precipitation and surface air temperature are the only two climate variables with long historical records, the PDSI makes full use of these data and can be readily calculated for the last hundred years or so for most land areas.36
For model-projected 21st century climate with large warming, drought indices that consider pre-cipitation only and do not account for changes in atmospheric demand for moisture due to increased radiative heating and surface warming may not work well. Even for the indices that consider the whole sur-face water budget, such as the PDSI, the interpretation of their values for the future climate may need to be revised. This is because all the drought indices have been defined and calibrated for the current climate. But with the large warming trend in the 21stcentury,
the future PDSI is greatly out of the range for the current climate (cf. section on How Will Droughts Change in Coming Decades?).
HOW ARE DROUGHTS CHANGING
AROUND THE WORLD?
In this section, I first provide a historical perspective by examining how drought has varied over many regions of the world during the last millennium, and then present aridity changes since 1950, when instrumental records are relatively abundant and rapid warming has occurred, especially since the late 1970s. I then discuss the causes of the recent aridity changes, especially their relationship with greenhouse gas (GHG) induced global warming.
Long-term Historical Perspective
Drought is a normal part of climate variations. Tree-ring and other proxy data, together with instrumental records, have revealed that large-scale droughts have occurred many times during the past 1000 years over many parts of the world, includ-ing North America,40,48–50 Mexico,16,51 Asia,52–64
Africa,65,66 and Australia.67,68 For example, succes-sive ‘‘megadroughts’’, unprecedented in persistence (20–40 year) yet similar in severity and spatial distri-bution to the major droughts experienced in modern-day’s North America, occurred during a 400-year-long period in the early to middle part of the second mil-lennium AD over western North America (Figure 1; Ref 49). Compared with these multi-decadal droughts, the modern-day droughts in the 1930s and 1950s had similar intensity but shorter durations. It is suggested13,49that these medieval megadroughts were
3 2 0 1000 1200 1400 1600 1800 2000 1 −1 −2 −3 Year (A.D.) PDSI over West N. America
FIGURE 1|Time series of the tree-ring reconstructed PDSI (<−1 for drought) averaged over western North America (25◦–50◦N, 95◦–125◦W)
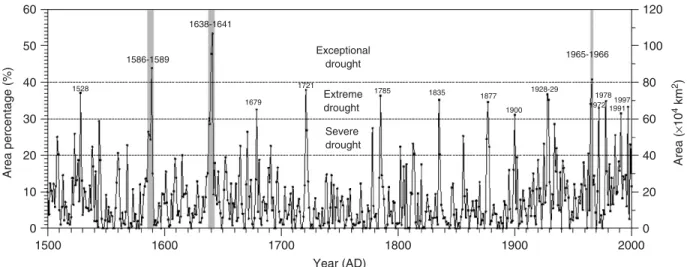
60 50 40 30 20 10 0 60 40 80 120 100 20 0 1700 1800 1900 2000 1600 1500 Year (AD) Area percentage (%) Area ( × 10 4 km 2) 1528 1679 1721 1785 1835 1877 1900 1928-29 1978 197219911997 1965-1966 1586-1589 1638-1641 Exceptional drought Extreme drought Severe drought
FIGURE 2|Time series of percentage area (left ordinate) and actual area (right ordinate) over eastern China (22◦–40◦N, 105◦–122◦E) in very dry
conditions (severe drought or worse) during the last five centuries, created using GIS technique based on the network of the drought/flood index in China of Zhang et al.55Severe, extreme, and exceptional drought years stand out, with area percentages reaching 20, 30 and 40%, respectively.
(Reprinted with permission from Ref 74. Copyright 2007 Springer.)
likely triggered by multi-decadal La Ni ˜na-like SST patterns in the tropical Pacific Ocean, as is the case for the 19th and 20th centuries,69–72 including the
Dust Bowl drought of the 1930s5when elevated dust
loading may also have enhanced the drought.8 The La Ni ˜na-like SST patterns in the tropical Pacific may also cause drought conditions in other parts of the extra-tropics.72,73Other studies14,16also suggest a
sig-nificant role of the Atlantic multi-decadal Oscillation (AMO) in causing prolonged droughts over the United States and Mexico, although the AMO’s role is found to through its modulation of El Ni ˜no-Southern Oscil-lation’s (ENSO) influence in model simulations.15
Over East China, historical records revealed that large-scale droughts occurred many times during the last 500 years, with more widespread droughts dur-ing 1500–1730 and 1900 to present and fewer ones from 1730 to 190074(Figure 2). The severe droughts in East China, such as those occurred in 1586–1589, 1638–1641, and 1965–1966, usually develop first in North China (34◦–40◦N), and then either expand southward or move to the Yangtze River Valley (27◦–34◦N) and the northern part of the southeast-ern coastal area (22◦–27◦N).74,75 Similar southward
migration (at ∼3◦ latitude/decade) of multi-year dry and wet anomalies was also found in the western United States where the anomalies first developed in the higher latitudes of the western United States75 A weakened summer monsoon and an anomalous west- and north-ward displacement of the western Pacific Subtropical High are linked to severe droughts in East China.74,76 It is also suggested that large vol-canic eruptions might be a trigger for severe droughts
in East China,74 and El Ni ˜no-like warming in the
tropical Pacific could lead to weakened summer mon-soons and thus drier conditions in East China.77 Although Zhang et al.59 did not find a consistent
association between aridity and temperature anoma-lies during the past millennium over the Yangtze Delta region, the apparent trend toward more widespread dry conditions since the early 20thcentury over entire
East China (Figure 2) is of great concern.
West Africa, where the severe and widespread Sahel droughts of the 1970s and 1980s (Figure 3) devastated the local population, has been the subject of a very large number of studies.78–81Proxy data for
African lake levels (Figure 4) indicate that very dry and wet periods occurred in the early and late part of the 19thcentury, respectively, over West and East Africa. The recent Sahel drought is not unusual in the context of the past three millennia,66 which indicates that
natural monsoon variations in West Africa are capable of causing severe droughts in the future. Many studies have shown that the recent Sahel droughts resulted primarily from a southward shift of the warmest SSTs and the associated inter-tropical convergence zone (ITCZ) in the tropical Atlantic,4,82–84 and the steady warming in the Indian Ocean, which enhances subsidence over West Africa through Rossby waves.85,86 Reduced vegetation cover and surface
evaporation may have provided a positive feedback that enhances and prolongs the droughts.84,87–89
Global Aridity Changes Since 1950
Instrumental records of precipitation, streamflow, cloudiness, surface radiation, humidity, winds, and
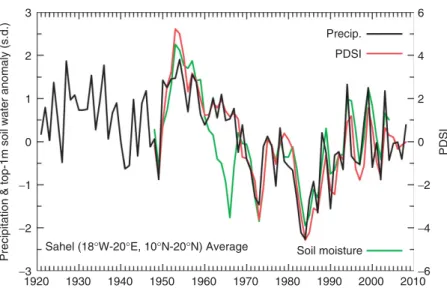
FIGURE 3|Annual time series averaged over the Sahel (18◦W–20◦E, 10◦N–20◦N, land only) for observed precipitation from 1921 to 2008 (black), Palmer Drought Severity Index (PDSI) (red) and CLM3-simulated top-1 m soil moisture content (green). The precipitation and soil moisture are shown as normalized anomalies in units of standard deviation (SD). 3 6 4 2 0 2 1 0 1920 1930 1940 1950 1960 1970 1980 1990 2000 2010 −1 −2 −2 −4 −6 −3 Year PDSI
Sahel (18°W-20°E, 10°N-20°N) Average Soil moisture Precip. PDSI
Precipitation & top-1m soil water anomaly (s.d.)
other drought-relevant variables are sparse before around 1950 over most of the globe. The period since 1950 also has experienced rapid increases in global surface temperature and atmospheric CO2and
other GHGs.90Thus, aridity changes since 1950 may provide insights on whether drought will become more frequent and widespread under global warming in the coming decades, although natural variations such as those revealed by proxy data (section Long-term Historical Perspective) are needed in assessing long-term trends. Many studies have examined recent hydroclimate trends over various regions,67,91–94and
some studies30,95 applied land model-simulated soil
moisture, forced by observation-based atmospheric forcing, to characterize historical droughts.
In this section, an update and synthesis are given of the global analyses of precipitation,96–98PDSI,35,36
streamflow,99 and model-simulated soil moisture29,93
to depict aridity changes from 1950 to 2008 over global land. The use of multiple variables in the anal-ysis should alleviate the deficiencies associated with individual drought indices and provide increased con-fidence. Here, land precipitation data were derived by merging the monthly anomaly data from Dai et al.96 for the period before 1948, Chen et al.97 for 1948–1978, and Huffman et al.98for 1979 to present.
The merging was done through re-scaling the different data sets to have the same mean of Ref 98 over a com-mon data period (1979–1996). Surface air tempera-ture data used for the PDSI calculation were derived, as in Dai et al.,36 by combining the HadCRUT3
anomalies100,101 and CRU climatology, both from
http://www.cru.uea.ac.uk/cru/data/temperature/. We also examined the newly released GPCC v4 gridded land precipitation data from 1901 to 2007 (ftp://ftp-anon.dwd.de/pub/data/gpcc/html/fulldata download.
html) and found that for the period since around 1950, the GPCC v4 showed changes similar to our merged precipitation data, but for 1901–1949 the GPCC v4 showed different change patterns that are inconsis-tent with previous analyses.96 Unlike Dai et al.,96 the GPCC v4 product has data over areas without rain-gauges nearby, often filled with climatological values that make it difficult to assess which regions had no observations and thus should be skipped in the analysis.
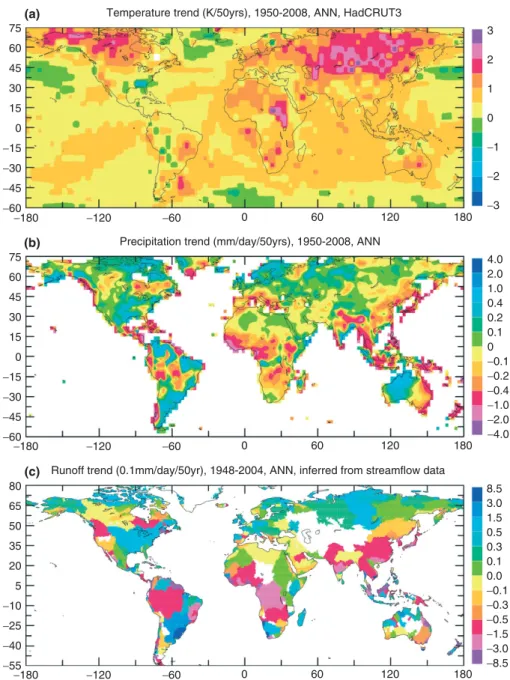
Figure 5 shows the trend maps for annual surface air temperature, precipitation, and runoff (inferred from streamflow records) since around 1950. From 1950 to 2008, most land areas have warmed up by 1–3◦C, with the largest warming over northern Asia and northern North America (Figure 5(a)). During the same period, precipitation decreased over most of Africa, southern Europe, South and East Asia, eastern Australia, Central America, central Pacific coasts of North America, and some parts of South America (Figure 5(b)). As a result, runoff over river basins in these regions has decreased (Figure 5(c)). The broadly consistent trend patterns between the independent records of precipitation and streamflow suggest that the broad patterns exhibited by the precipitation data (Figure 5(b)) are likely reliable. The precipitation change patterns are also consistent with satellite-observed vegetation changes, for example, over Australia since the 1980s.102
To account for the basic effect of temperature on surface water balance, monthly PDSI from 1850 to 2008 was calculated using the precipitation and temperature data used in Figure 5 with the Thornthwaite (an update to Dai et al.,36 referred
to as PDSI) and Penman-Monteith [Eq. (4.2.14) of Shuttleworth17; referred to as PDSI pm] equation
285 283 281 279 8 6 4 2 0 10 −10 0 1900 1895 1890 1885 14 12 10 10 5 4 3 2 1 0 472 468 464 624 623 622 621 934 926 918 1800 1820 1840 1860 1880 1900 1920 1940 1960 1980 0 20S 15S 12S 8S 5S 2S 0 3N 5N 15N 1 2 3 EQ 4 5 6 7 8 9 10 1) Chad 2) Stefanie 3) Turkana 4) Naivasha 5) Victoria 6) Tanganyika 7) Rukwa 8) Malawi 9) Chilwa 10) Ngami Lake Chad Lake Stefanie Lake Turkana Lake Naivasha Lake Victoria Lake Tanganyika Lake Rukwa Lake Malawi Lake Chilwa Lake Ngami
FIGURE 4|Historical fluctuations in African lake levels since 1800 (higher values for wet periods). Except for Lake Ngami, solid lines indicate
modern measurements, short dashed lines indicate historical information, and long dashed lines indicate general trends. (Reprinted with permission from Ref 79. Copyright 2001 Springer.)
for PE, separately. In addition, the self-calibrated PDSI of Wells et al.42 with the Penman-Monteith PE (sc PDSI pm) was also calculated. Besides the precipitation and temperature data, additional forcing data of surface specific humidity, wind speed, and air pressure from the NCEP/NCAR reanalysis were used, together with cloud cover from surface observations103 and surface net solar radiation from
the Community Land Model version 3 (CLM3) simulation,29 in which observed cloud cover29 was used to estimate surface downward solar radiation.
Surface net longwave radiation was estimated using observed near-surface air temperature, vapor pressure and cloud fraction based on Eq. (4.2.14) of Shuttleworth.17We emphasize that large uncertainties
likely exist in the data for surface wind speed and radiation used here, as gridded, high-quality data for these fields are unavailable over the global land. Because of this, the PDSI results may not fully reflect the impact of the actual changes in wind speed104and
radiation on aridity since 1950.47More details on the PDSI characteristics are given in Dai.105
75 60 45 15 −15 −45 −30 −60 −180 −120 −60 0 60 120 180 30 0 75 80 65 35 5 50 20 60 45 15 −15 −45 −30 −60 −10 −40 −25 −55 −180 −120 −60 0 60 120 180 −180 −120 −60 0 60 120 180 30 0 1 2 3 −1 −2 −3 0 4.0 1.0 0.4 0.2 0 0.1 −0.1 −1.0 −2.0 −4.0 −0.2 −0.4 2.0 8.5 1.5 0.5 0.3 0.0 0.1 −0.1 −0.3 −0.5 −1.5 −3.0 −8.5 3.0 Temperature trend (K/50yrs), 1950-2008, ANN, HadCRUT3
Precipitation trend (mm/day/50yrs), 1950-2008, ANN
Runoff trend (0.1mm/day/50yr), 1948-2004, ANN, inferred from streamflow data
(a)
(b)
(c)
FIGURE 5|Trend maps for observed annual (a) surface air temperature (from HadCRUT3: http://www.cru.uea.ac.uk/cru/data/temperature/),
(b) precipitation (see text for data sources), and (c) runoff inferred from streamflow records. (Panel c reprinted with permission from Ref 99. Copyright 2002 American Meteorological Society.)
As in Dai et al.,36 Figure 6 shows that global PDSI fields from 1900 to 2008 contain two robust modes of variability, with the first mode representing a long-term trend (Figure 6(a)) of drying over Africa, South and East Asia, eastern Australia, northern South America, southern Europe, and most of Alaska and western Canada (red areas in Figure 6(b)). This mode is expected given that a similar trend mode is seen in land precipitation fields.96 The second mode
is associated with the ENSO, because its temporal variations are correlated with an ENSO index (red line in Figure 6(c)) and its spatial patterns (Figure 6(d))
resemble those of ENSO-induced precipitation anomalies.106 The fact that the global PDSI can
capture two physically sound modes provides some confidence for using it as a proxy of aridity over global land, besides its correlation with available observations of soil moisture and streamflow.36
Figure 7 compares the trend patterns in PDSI, PDSI pm, sc PDSI pm, and top-1 m soil moisture con-tent from the CLM3 simulation forced with observed precipitation, temperature, and other atmospheric forcing (see Ref 29 for details). Although the CLM3 simulation accounts for the effect of cloud-induced
3 2 1 −1 −2 −3 0 1900 1915 1930 1945 1960 1975 1990 2005 PC 1, 7.1% Temporal patterns 75 60 30 0 45 15 −15 −45 −30 −60 −180 −120 −60 0 60 120 180 EOF 2 75 60 30 0 45 15 −15 −45 −30 −60 −180 −120 −60 0 60 120 180
EOF 1 Spatial patterns
3 2 1 −1 −2 −3 0 1900 1915 1930 1945 1960 1975 1990 2005 PC 2, 5.0%, Darwin SLP (red) leads by 6 months
r=0.63
−5.0 −3.0 −1.0 1.0 3.0 5.0
(a)
(c) (d)
(b)
FIGURE 6|(left) Temporal (black) and (right) spatial patterns of the two leading EOFs of monthly PDSI from 1900 to 2008 (normalized by its
standard deviation prior to the EOF analysis). Red (blue) areas are dry (wet) for a positive temporal coefficient on the corresponding PC time series [e.g., the red (blue) areas in panel (b) represent a drying (moistening) trend whose temporal pattern is shown in panel (a)]. Variations on<2-year time scales were filtered out in plotting the left panels (but retained in the EOF analysis). Also shown in panel (c) is the normalized Darwin mean sea-level pressure anomaly shifted to the right (i.e., lead) by 6 months to obtain a maximum correlation (r=0.63) with the PC 2 time series. (a) The percentage variance explained by the EOF is shown on the top of the left panels.
changes in radiation on evaporation, data for sur-face wind speed, which affects sursur-face evaporation,104 were taken directly from the NCEP/NCAR reanalysis and thus may not reflect actual changes. Furthermore, the CLM3 has deficiencies in simulating snow hydrol-ogy, permafrost, ground water, and other processes. Nevertheless, the CLM3 simulates the land surface processes, including evaporation and soil moisture, in a much more comprehensive way than the Palmer model for PDSI, and the CLM3 simulation cap-tures most of the observed variations and changes in available soil moisture and streamflow records over the globe.29,99 Thus, the CLM3-simulated soil
moisture provides another measure of aridity and wetness.
The trends of the PDSI, PDSI pm, and sc PDSI pm from 1950 to 2008 are very similar (Figure 7(a)–(c)), with some quantitative differences over Brazil, southern Africa, Australia, and a few other places, and slightly smaller magnitudes for the sc PDSI pm trend as it is calibrated to a narrower range.105 This suggests that the PDSI trends are not
sensitive to the PE calculations over most land areas, given the observed cloud cover changes and the surface wind and humidity from the NCEP/NCAR reanalysis. Furthermore, Figure 7 shows that the three forms of the PDSI and the CLM3-simulated soil moisture exhibit similar trend patterns, with some regional differences, e.g., over Indonesia. For instance, both the PDSI and soil moisture suggest drying during the last 50–60 years over much of Africa, East and South Asia, eastern Australia, southern Europe, Alaska and northern Canada (except the Arctic areas), while it has become wetter in the United States and most of Western Australia. To the first order, these patterns are similar to those for trends in precipitation (Figure 5(b)) and runoff (Figure 5(c)), except for the northern high latitudes (e.g., Siberia and Alaska) where the upward runoff trend might have partly resulted from thawing of the permafrost, which is not well simulated in the CLM3 and not at all in the Palmer model, or due to errors in the precipitation data.99,107 Given that precipitation largely controls
75 60 30 0 45 15 −15 −45 −30 −60 −180 −120 −60 0 60 120 180
PDSI_th Trend (change/50yrs,red=drying) during 1950-2008
6 4 2 −2 −4 −6 0 75 60 30 0 45 15 −15 −45 −30 −60 −180 −120 −60 0 60 120 180 6 4 2 −2 −4 −6 0 75 60 30 0 45 15 −15 −45 −30 −60 −180 −120 −60 0 60 120 180 75 60 30 0 45 15 −15 −45 −30 −60 −180 −120 −60 0 60 120 180 6 18 12 6 −6 −12 −18 0 4 2 −2 −4 −6 0 PDSI_pm Trend (change/50yrs,red=drying) during 1950-2008
sc_PDSI_pm Trend (change/50yrs,red=drying) during 1950-2008
Top 1 m soil moisture trend (mm/50yrs) during 1948-2004 simulated by CLM3 (a)
(b)
(c)
(d)
FIGURE 7|Maps of annual trends (red=drying) from 1950 to 2008 in PDSI (change per 50 years) with potential evapotranspiration (PE)
calculated using the (a) Thornthwaite and (b) Penman-Monteith (PM) equation, and (c) annual trends in self-calibrated PDSI with the PM potential evaporation. Also shown (d) is the trend in top-1 m soil moisture content (mm/50 years) from 948 to 2004 simulated by a land surface model (CLM3) forced by observation-based atmospheric forcing (see Ref 29 for details).
not unexpected that the PDSI from the simple Palmer model can broadly reproduce the soil moisture trend patterns from the much more comprehensive CLM3. We also note that the trend in the CLM3-simualted soil moisture (Figure 7(d)) is broadly comparable with those simulated by a different land surface model with different forcing data for 1950–2000 by Sheffield and Wood.95
Figure 8 shows the annual time series averaged over global (60◦S–75◦N) land since 1950 for the PDSI, PDSI pm, and top-1 m soil moisture content from two CLM3 simulations that were forced with different intra-monthly forcing and different monthly data for surface wind speed and humidity, together with the PDSI and PDSI pm computed using all the forcing data except with fixed temperature (dashed
FIGURE 8|Global land (60◦S–75◦N) averaged annual time series of top 1 m soil moisture anomaly (mm) simulated by a land surface model (CLM3) forced with observation-based estimates of monthly temperature, precipitation, and solar radiation with intra-monthly variations from the NCEP-NCAR (black) and ERA-40 (green) reanalysis (see Ref 29 for details), compared with the similarly averaged PDSI time series computed with both observed temperature and precipitation (red solid line for PDSI with Thornthwaite PE and magenta for PDSI with Penman-Monteith PE) and precipitation only (i.e., no temperature changes, dashed lines). Results for averages over 40◦S–40◦N land areas are very similar. The SC-PDSI pm is similar to the PDSI pm.
1.5 1.0 0.5 0.0 1950 1960 1970 1980 1990 2000 2010 −0.5 −1.5 −1.0 PDSI Year 3 2 1 0 −1 −2 −3
Top-1 m soil water anomaly (mm)
PDSI_pm, P only CLM3, NCEP CLM3, ERA40 PDSI_pm, T and P PDSI, P only PDSI, T and P
(a) Global land (60°S-75°N) average
lines). Results for sc PDSI pm are similar to those for PDSI pm105 and thus not shown in Figures 8 and 9.
Although there are differences among the curves, they show similar year-to-year variations and all exhibit a sharp downward (i.e., drying) trend from the late 1970s to the early 1990s. Since the early 1990s, the CLM3-simulated soil moisture shows a slight recovery, while the PDSI continues to decrease. The PDSI pm recovers slightly in the mid-to-late 1990s but resumes the downward trend since around 1999, whereas the PDSI and PDSI pm with fixed temperature shows an upward trend since the middle 1980s.
Defining the bottom 20 percentiles of the monthly PDSI, PDSI pm and soil moisture as the dry spells locally, one can compute the global dry area as a percentage of total land area. Figure 9 shows that the percentage dry area stayed around 14–20% from 1950 to 1982, when it experienced a sharp jump (by ∼10%) due to the 1982/83 El Ni ˜no, which reduced precipitation over may land areas.106 Thereafter, an
upward trend is evident in all but the PDSI and PDSI pm with fixed temperature cases (dashed lines in Figure 9), which show little trend from 1983 to 2008. We note that the PDSI case tends to overestimate the recent drying compared with the PDSI pm and CLM3 cases.
These results suggest that precipitation was the dominant driver for the changes in the terrestrial water budget before the early 1980s; thereafter, surface warming and cloud-induced changes in solar radiation and other fields (i.e., wind speed and humidity) also became important. Furthermore, the PDSI pm appears to be a more reasonable measure of aridity than the original PDSI, as the PDSI pm also considers changes
in surface radiation and other fields and thus is more comparable to the CLM3 simulations, although the trend patterns are similar (Figure 7). The sc PDSI pm is very similar to PDSI pm, with slightly reduced magntitudes as a result of the local calibration.
Can the Recent Changes be Attributed to
Human Activities?
The sharp decreases in the PDSI and soil moisture from the late 1970s to the early 1990s (Figure 8) mainly result from precipitation decreases in Africa and East Asia. As mentioned above, the recent drought in Africa is related to SST pattern changes in the Atlantic and steady warming in the Indian Ocean.108
The warming in the Indian Ocean is likely related to recent global warming, which is largely attributed to human-induced GHG increases.90 The southward
shift of the warmest SSTs in the tropical Atlantic is, however, likely a natural variation because GHG-induced warming is larger in the North Atlantic than in the South Atlantic Ocean,6 although the role of
anthropogenic aerosols109cannot be ruled out. Over East Asia, there is a decadal change around the late 1970s in rainfall patterns and associated summer monsoon circulation, which has become weaker since the late 1970s.76,77 Increased aerosol loading
from human-induced air pollution110 and warming
in tropical SSTs77 may both have played a major
role for the rainfall changes over East Asia. Model simulations also suggest that increased aerosol loading over the Northern Hemisphere may have played an important role in the recent drying over the Sahel and other tropical precipitation changes;109however,
FIGURE 9|Time series of global dry areas (defined locally as the bottom 20 percentiles) as a percentage of the global (60◦S–75◦N) land area based on the CLM3-simulated top-1 m soil moisture content (green), and PDSI calculated with both observed precipitation and temperature and Thornthwaite (red solid line) and Penman-Monteith (magenta solid line) PE, and with precipitation only (dashed lines). Monthly data were used in the PDSI and PE calculations with variations on<12-month time scales were filtered out before plotting.
40 30 20 10 35 25 15 1950 1960 1970 1980 1990 2000 2010 Year Dry area (%)
Global (60S-75N) dry areas (bottom 20 percentiles) PDSI, dT+dP
PDSI, dP only CLM3, All forcing PDSI_pm, dT+dP PDSI_pm, dP only
underlying physical processes because of large model biases in tropical precipitation.111
A large part of the recent drying (Figure 9) is related to the shift toward more intense and frequent warm events (i.e., El Ni ˜nos) of ENSO since the late 1970s.112 This is because El Ni ˜nos often
reduce precipitation over many low-latitude land areas.71,72,106 This shift in ENSO is statistically a
rare event, but it is unknown whether this is related to recent global warming. Some climate models predict an El Ni ˜no-like warming pattern in the tropical Pacific under increased GHGs, but it is not a robust response in all models.113–115Given that current climate models
still have large deficiencies in simulating ENSO and other tropical variability,116,117 we cannot attribute the recent ENSO shift (and thus the related jump toward drying over land) to anthropogenic forcing or natural variability.
Besides the El Ni ˜no-related drying, the above results also show that the recent surface warming has enhanced evaporative demand over land and contributed to the drying since the 1980s. Because a large part of the recent surface warming is attributed to human-induced GHG increases,90we can conclude
that anthropogenic GHG increases have contributed to the recent drying over land. Furthermore, the increased GHGs likely have contributed to the warming in the Indian Ocean and the tropical Pacific, which in turn have contributed to the drying in Africa and East Asia, respectively. Therefore, we can conclude that human activities have contributed significantly to the recent drying over land, although natural variations in ENSO, tropical Atlantic SSTs, and Asian monsoons also have played a large role.
HOW WILL DROUGHTS CHANGE IN
COMING DECADES?
In this section, I present an assessment of how droughts might change based on future climates simulated by numerical models. It is of a great concern that extreme climate events such as droughts are expected to experience large percentage changes.118As the land surface warms up due to increased downward longwave radiation from increased water vapor and other GHGs, atmospheric demand for water vapor (i.e., PE) could increase,119,120 as shown by the time
series differences between the dP and dP+dT cases in Figures 8 and 9. However, other factors such as surface net solar radiation, humidity, and wind speed also affect PE. If atmospheric water supply (i.e., precipitation) over a region does not match or exceed increases in PE, then aridity would increase.
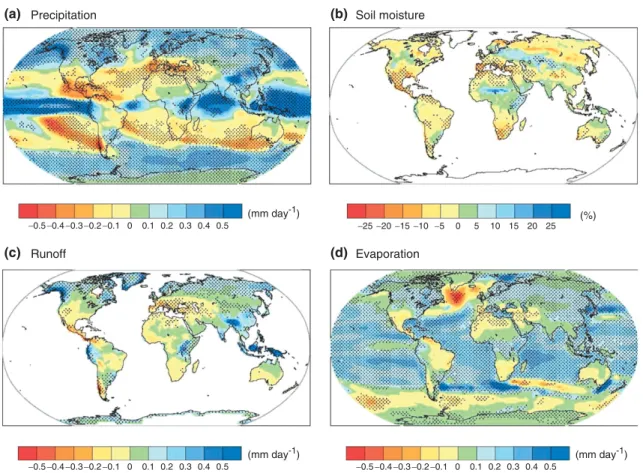
Figure 10114 shows the IPCC AR4
multi-model ensemble-mean change from 1980–1999 to 2080–2099 under the SRES A1B (a medium emis-sions) scenario for annual (a) precipitation, (b) soil moisture, (c) runoff, and (d) evaporation. Unlike evap-oration, which increases over most of the globe except for a few arid land regions and a few oceanic areas (where cooling occurs), precipitation shows widespread decreases around the subtropical zones. This precipitation decrease is attributed to the widening of the descending branches of the Hadley circulation121 and increased atmospheric stability at the margins of tropical convection.122,123 Over land, however, the change patterns are similar between evaporation and precipitation, which further suggests that evaporation over land is controlled primarily
Precipitation
(a) (b) Soil moisture
Runoff (c) (d) Evaporation −0.5−0.4−0.3−0.2−0.1 0 0.10.2 0.30.4 0.5 −25−20−15−10 −5 0 5 10 15 20 25 (mm day-1) −0.5−0.4−0.3−0.2−0.1 0 0.10.2 0.30.4 0.5 (mm day-1) −0.5−0.4−0.3−0.2−0.1 0 0.10.2 0.30.4 0.5 (mm day-1) (%)
FIGURE 10|Multi-model mean changes from 1980–1999 to 2080–2099 under the SRES A1B scenario in annual (a) precipitation (mm/day),
(b) soil moisture (%), (c) runoff (mm/day), and (d) evaporation (mm/day). The stippling indicates where at least 80% of the models agree on the sign of the mean change. (Reprinted with permission from Ref 114. Copyright 2007 Cambridge University Press.)
by precipitation.29 Runoff change patterns generally follow those of land precipitation (Figure 10(a) and (c)), which is the main driver for runoff.29On the other
hand, soil moisture shows quite different change pat-terns (Figure 10(b)) that indicate drying over most of the land areas including most of the northern mid-high latitudes, where precipitation is increased. Even at low latitudes (e.g., southern Asia and northwestern South America), soil moisture changes do not always match precipitation changes (Figure 10). This demon-strates that one should not use total precipitation alone to measure changes in aridity or drought, as done in many studies.122,123Increased heavy precipitation and
reduced light to moderate rain124,125 can increase the
runoff to precipitation ratio, and increases in surface air temperature and radiative heating can lead to higher atmospheric demand for moisture. These pro-cesses can result in drier soils even if the precipitation amount increases. Figure 10 also shows that many of the AR4 models produce different soil moisture changes (of opposite sign) over many regions where they agree on the sign of changes in temperature,114 precipitation, evaporation, and runoff, such as the
northern high latitudes. This implies large uncertain-ties in simulating land hydrology and soil moisture response in current models.
Analyzing soil moisture data from the IPCC AR4 simulations from 15 coupled models under the SRES A1B scenario, Wang126 found general drying
over most of the global land except part of the northern mid- and high-latitudes during the non-growing season and warned a world-wide agricultural drought by the late 21st century. Examining soil moisture data from eight AR4 models, Sheffield and Wood127found that global soil moisture decreases in
all of the models for all scenarios with a doubling of both the spatial extent of severe soil moisture deficits and frequency of short-term (4–6-month duration) droughts from the mid-20thcentury to the end of the 21stcentury, while long-term (>12 months) droughts
become three times more common.
Besides soil moisture, other drought indices also have been computed using surface fields from model outputs and used to assess future drought changes.37,38 Using data from the Hadley Centre atmospheric general circulation model (AGCM) and
other AGCM 2× CO2 equilibrium runs, Burke and
Brown38 computed four difference drought indices,
including the PDSI pm. They found that, despite regional differences, all of the indices that take atmospheric moisture demand into account suggest a significant increase in global drought areas when CO2doubles.
Here monthly PDSI pm and sc PDSI pm were computed using multi-model ensemble-mean monthly data of precipitation, surface air temperature, specific humidity, net radiation, wind speed, and air pressure from 22 coupled climate models participated in the IPCC AR4,128 and used to assess changes in aridity over global land. Thus, these PDSI values may be interpreted as for the multi-model mean climate conditions. As the PDSI is a slow varying variable, the lack of high-frequency variability in the ensemble-mean climate is unlikely to induce ensemble-mean biases.
Figure 11 shows the select decadal-mean sc PDSI pm maps from the 1950s to 2090s from the IPCC 20th century (20C3M) and SRES A1B scenario simulations. Results for PDSI pm are similar with slightly larger magnitudes. A striking feature is that aridity increases since the late 20th century and becomes severe drought (sc PDSI pm <−3) by the 2060s over most of Africa, southern Europe and the Middle East, most of Americas (except Alaska and northern Canada, Uruguay, and northeastern Argentina), Australia, and Southeast Asia; while it becomes progressively wetter over most of central and northern Eurasia, Alaska and northern Canada, and India. This feature is also evident in the trend maps of PDSI pm shown by Burke et al.37 using data from the Hadley Centre coupled model alone under the SRES A2 (a high emissions) scenario. Increased precipitation (Figure 10(a)) is the main cause for the wetting over central and northern Eurasia, northern North America, India, Uruguay and northeastern Argentina, and eastern central Africa; while precipitation decreases over Central America, the Southwest United States, the Mediterranean region, and southern Africa are largely responsible for the drying there. Over many mid-latitude and subtropical regions (e.g., northern Australia and Southeast Asia, Figure 10(a)), however, increased evaporation is a major cause for the increased aridity (Figure 11).
The patterns shown in Figure 11 are consistent with published regional analyses of projected aridity changes in the 21st century, often by a smaller number of models than used here. These include decreases in precipitation-minus-evaporation over southwestern North America129 and Mexico,51
streamflow decreases over most of (except northern)
Europe,130increases in drought frequencies over most of Australia.131 Figure 11 is also broadly consistent
with the trends in model-simulated soil moisture126,127
(Figure 10), and the PDSI pm trends of Burke et al.37
and Burke and Brown.38
We emphasize that quantitative interpretation of the PDSI values shown in Figure 11 requires caution because many of the PDSI values, which are calibrated to the 1950–1979 model climate, are well out of the range for the current climate, based on which the PDSI was designed. Nevertheless, Figure 11, together with all the other studies cited above, suggests that drought may become so widespread and so severe in the coming decades that current drought indices may no longer work properly in quantifying future drought.
SUMMARY AND CONCLUDING
REMARKS
In this article, a brief review is presented on the definition of drought, common drought indices, and recent literature on the occurrence and causes of drought in the 20th and earlier centuries, followed
by an updated analysis of global aridity changes from 1950 to 2008 using multiple sources of data. Projected aridity changes in the 21stcentury are also presented
based on published studies and our new analysis of model output from simulations under the SRES A1B scenario by 22 coupled models that participated in the IPCC AR4.
Recent studies revealed that persistent dry periods lasting for multiple years to several decades have occurred many times during the last 500–1000 years over North America, West Africa, and East Asia. These historical droughts are linked to tropical SST variations, with La Ni ˜na-like SST anomalies in the tropical Pacific often leading to widespread drought in North America, and El-Ni ˜no-like SST warming in the Pacific causing drought in East China. Over Africa, the southward shift of the warmest SSTs in the tropical Atlantic and warming in the Indian Ocean are the main causes of the recent Sahel droughts. Land cover changes and local feedbacks, such as increased dust loading during the Dust Bowl drought over North America in the 1930s, decreased vegetation cover in the Sahel during the 1970s and 1980s, and reduced local evaporation and relative humidity during droughts in general, may enhance and prolong droughts triggered by tropical SSTs or other anomalies in atmospheric circulations.
Since the middle 20th century, global aridity
and drought areas have increased substantially, mainly due to widespread drying since the 1970s
75 60 30 0 45 15 −15 −45 −30 −60 75 60 30 0 45 15 −15 −45 −30 −60
SC-PDSI Using IPCC AR4 22-Model T & P, 1950-1959 SC-PDSI, 20C3M + SRES A1B, 1975-84
SC-PDSI, 2000-2009 SC-PDSI, 2030-2039 −20−15−10 −8 −6 −4 −3 −2 −1−0.5 0 0.5 1 2 3 4 6 8 10 15 20 (a) (b) (c) (d) 75 60 30 0 45 15 −15 −45 −30 −60 SC-PDSI, 2060-2069 SC-PDSI, 2090-2099 −180 −120 −60 0 60 120 180 −180 −120 −60 0 60 120 180 (e) (f)
FIGURE 11|Mean annual sc-PDSI pm for years (a) 1950–1959, (b) 1975–1984, (c) 2000–2009, (d) 2030–2039, (e) 2060–2069, and
(f) 2090–2099 calculated using the 22-model ensemble-mean surface air temperature, precipitation, humidity, net radiation, and wind speed used in the IPCC AR4 from the 20th century and SRES A1B 21st century simulations.128Red to pink areas are extremely dry (severe drought) conditions while
blue colors indicate wet areas relative to the 1950–1979 mean.
over Africa, southern Europe, East and South Asia, eastern Australia, and many parts of the northern mid-high latitudes. Although natural variations in ENSO, tropical Atlantic SSTs, and Asian monsoons have played a large role in the recent drying, the rapid warming since the late 1970s has increased atmospheric demand for moisture and likely altered atmospheric circulation patterns (e.g., over Africa and East Asia), both contributing to the recent drying over land. Since a large part of the recent warming is attributed to human-induced GHG increases,90it can
be concluded that human activities have contributed significantly to the recent drying trend.
Reduced pan evaporation, a proxy for PE, over Australia, East China, and other regions during recent decades104 may alleviate the drying trend
induced primarily by precipitation, temperature, and cloudiness changes examined here. Nevertheless, the precipitation and streamflow records (Figure 5(b) and (c)) and previous studies56,58,67 all show drying over
East Australia and much of East China during the recent decades. This suggests that the effect of the reduced PE on aridity is likely secondary to that of recent changes in precipitation and temperature over these regions.
Coupled climate models used in the IPCC AR4 project increased aridity in the 21st century, with a
striking pattern that suggests continued drying over most of Africa, southern Europe and the Middle East, most of Americas (except Alaska, northern Canada, Uruguay, and northeastern Argentina), Australia, and Southeast Asia. Some of these regions, such as the United States, have fortunately avoided prolonged droughts during the last 50 years mainly due to decadal variations in ENSO and other climate modes, but people living in these regions may see a switch to persistent severe droughts in the next 20–50 years, depending on how ENSO and other natural variability modulate the GHG-induced drying. As cuts to global GHG emissions are hard to
materialize, geoengineering (e.g., by putting sulfate aerosols into the stratosphere) as the last resort to combat global warming has been proposed,132 but it may cause widespread drought and other unintended adverse effects.133,134
Many of current AGCMs are capable of simu-lating the precipitation deficits during recent droughts over North America and Africa given the observed global (especially tropical) SST anomalies.4–6,71,72
Fur-ther advances in model developments may make it possible to predict drought on seasonal to decadal time scales.135 A big challenge for such predictions will be predicting tropical SST variations on seasonal to decadal time scales, which requires coupled GCMs (CGCMs) and estimates of future GHGs, aerosols, and other external forcing (e.g., the solar cycle and vol-canic eruptions). However, current CGCMs still have large deficiencies in simulating tropical precipitation, ENSO, the intra-seasonal oscillation, and other trop-ical variability.116,117,136 Substantial improvements
will be required before the CGCMs can be used to predict tropical SST variations on seasonal to decadal time scales that would enable prediction of droughts over North America, Africa, Asia, Australia, and other parts of the world.
Besides the tropical deficiencies, current cli-mate models still have large deficiencies in simulat-ing precipitation frequency and intensity,1,136 clouds,
aerosols’ effects, land hydrology, and other processes; and future emissions such as aerosol loading may be very different from those used in the IPCC AR4 21st century simulations. Furthermore, large regional
differences exist among the models and among dif-ferent drought indices.38 It is also possible that the
PM equation overestimates PE under the warming cli-mate of the 21stcentury and that the current drought
indices such as the PDSI may not be applicable to the future climate. On the other hand, the PDSI and the PM equation have worked for the current and past climates. The fact that they may not work for the 21st
century climate itself is a troubling sign. Despite all these uncertainties, the large-scale pattern shown in Figure 11 appears to be a robust response to increased GHGs. This is very alarming because if the drying is anything resembling Figure 11, a very large popula-tion will be severely affected in the coming decades over the whole United States, southern Europe, South-east Asia, Brazil, Chile, Australia, and most of Africa. As alarming as Figure 11 shows, there may still be other processes that could cause additional drying over land under global warming that are not included in the PDSI calculation. For example, both thermody-namic arguments124and climate model simulations125
suggest that precipitation may become more intense but less frequent (i.e., longer dry spells) under GHG-induced global warming. This may increase flash floods and runoff, but diminish soil moisture and increase the risk of agricultural drought.
Given the dire predictions for drought, adap-tation measures for future climate changes should consider the possibility of increased aridity and widespread drought in coming decades. Lessons learned from dealing with past severe droughts, such as the Sahel drought during the 1970s and 1980s,137 may be helpful in designing adaptation strategies for future droughts.
ACKNOWLEDGMENTS
The author thanks Kevin Trenberth and three anonymous reviewers for many constructive comments, and acknowledges the support from the NCAR Water Systems Program. The National Center for Atmospheric Research is sponsored by the US National Science Foundation.
REFERENCES
1. Sun Y, Solomon S, Dai A, Portmann R. How often does it rain?J Clim2006, 19:916–934.
2. American Meteorological Society (AMS). Meteorolog-ical drought—policy statement.Bull Amer Meteor Soc
1997, 78:847–849. Available at: http://www.ametsoc. org/policy/drought2.html.
3. Wilhite DA. Drought as a natural hazard: concepts and definitions. In: Wilhite DA, ed.Droughts: Global Assessment.London: Routledge; 2000, 3–18.
4. Giannini A, Saravanan R, Chang P. Oceanic forcing of Sahel rainfall on interannual to interdecadal time scales.Science2003, 302:1027–1030.
5. Schubert SD, Suarez MJ, Pegion PJ, Koster RD, Bacmeister JT. On the cause of the 1930s Dust Bowl.
Science2004, 303:1855–1859.
6. Hoerling M, Hurrell J, Eischeid J, Phillips A. Detec-tion and attribuDetec-tion of twentieth-century northern and southern African rainfall change. J Clim 2006, 19:3989–4008.
7. Trenberth KE, Branstator GW, Arkin PA. Origins of the 1988 North-American drought. Science 1988, 242:1640–1645.
8. Cook BI, Miller RL, Seager R. Amplification of the North American ‘‘Dust Bowl’’ drought through human-induced land degradation.Proc Natl Acad Sci
2009, 106:4997–5001.
9. Federal Emergency Management Agency (FEMA). National Mitigation Strategy: Partnerships for Build-ing Safer Communities. Mitigation Directorate, p. 2, Washington, DC: Federal Emergency Management Agency; 1995, 40.
10. Kallis G. Droughts. Annu Rev Env Resour 2008, 33:85–118.
11. Stahle DW, Fye FK, Cook ER, Griffin RD. Tree-ring reconstructed megadroughts over North America since AD 1300.Clim Change2007, 83:133–149.
12. Meehl GA, Hu A. Megadroughts in the Indian mon-soon region and southwest North America and a mech-anism for associated multidecadal Pacific sea surface temperature anomalies.J Clim2006, 19:1605–1623. 13. Seager R, Burgman R, Kushnir Y, Clement A,
Cook ER, Naik N, Miller J. Tropical Pacific forcing of North American Medieval megadroughts: testing the concept with an atmosphere model forced by coral-reconstructed SSTs.J Clim2008, 21:6175–6190. 14. McCabe GJ, Betancourt JL, Gray ST, Palecki MA,
Hidalgo HG. Associations of multi-decadal sea-surface temperature variability with US drought.
Quatern Int2008, 188:31–40.
15. Mo KC, Schemm JKE, Yoo SH. Influence of ENSO and the Atlantic multidecadal oscillation on drought over the United States.J Clim2009, 22:5962–5982. 16. Mendez M, Magana V. Regional aspects of prolonged
meteorological droughts over Mexico and Central America.J Clim2010, 23:1175–1188.
17. Shuttleworth WJ. Evaporation. In: Maidment DR, ed.
Handbook of Hydrology.New York: McGraw-Hill, Inc.; 1993, 4.1–4.53.
18. Heim RR Jr. Drought indices: a review. In: Wilhite DA, ed. Drought: A Global Assessment. London: Routledge; 2000, 159–167.
19. Heim RR Jr. A review of twentieth-century drought indices used in the United States.Bull Am Met Soc
2002, 83:1149–1165.
20. Keyantash J, Dracup JA. The quantification of drought: an evaluation of drought indices. Bull Am Met Soc2002, 83:1167–1180.
21. Hayes MJ. Drought indices.What Is Drought? Lin-coln, Nebraska: National Drought Mitigation Cen-ter, 2006. Available at: http://drought.unl.edu/whatis/ indices.htm.
22. Palmer WC. Meteorological drought. Research Paper No. 45, US Dept. of Commerce, 1965, 58. Available at: http://www.ncdc.noaa.gov/oa/climate/research/ drought/palmer.pdf.
23. Alley WM. Palmer drought severity index: limita-tions and assumplimita-tions. J Clim Appl Meteorol 1984, 23:1100–1109.
24. Karl TR. Sensitivity of the Palmer drought severity index and Palmer’sZ-index to their calibration coef-ficients including potential evapotranspiration.J Clim Appl Meteorol1986, 25:77–86.
25. McKee TB, Doesken NJ, Kleist J. The relationship of drought frequency and duration to time scales. Preprints, 8th Conference on Applied Climatology, January 17–22 Anaheim, CA: 1993, 179–184. Avail-able at: http://ccc.atmos.colostate.edu/relationshipofd roughtfrequency.pdf.
26. Edwards DC, McKee TB. Characteristics of 20th cen-tury drought in the United States at multiple time scales. Climo Report 97-2, Dept. of Atmos. Sci., CSU, Fort Collins, CO, May, 1997, 155. Available at: http://ccc.atmos.colostate.edu/edwards.pdf. 27. Gibbs WJ, Maher JV. Rainfall deciles as drought
indi-cators.Aust Bureau Meteorol Bull1967, 48:37. 28. Huang J, van den Dool H, Georgakakos KP.
Analy-sis of model-calculated soil moisture over the United States (1931–93) and application to long-range tem-perature forecasts.J Clim1996, 9:1350–1362. 29. Qian T, Dai A, Trenberth KE, Oleson KW. Simulation
of global land surface conditions from 1948–2004. Part I: Forcing data and evaluation.J Hydrometeorol
2006, 7:953–975.
30. Wang AH, Bohn TJ, Mahanama SP, Koster RD, Lettenmaier DP. Multimodel ensemble reconstruction of drought over the continental United States.J Clim
2009, 22:2694–2712.
31. Dracup JA, Lee KS, Paulson EG. On the definition of droughts.Water Resour Res1980, 16:297–302. 32. Shafer BA, Dezman LE. Development of a surface
water supply index (SWSI) to assess the severity of drought conditions in snowpack runoff areas. In:Proc Western Snow Conference, Colorado State University, Fort Collins, Colorado; 1982, 164–175.
33. Doesken NJ, McKee TB, Kleist J. Development of a surface water supply index for the Western United States. Climo Report 91-3, Dept. of Atmos. Sci., CSU, Fort Collins, CO, November, 1991, 80. Available at: http://climate.colostate.edu/pdfs/climo rpt 91-3.pdf. 34. Bhalme HN, Mooley DA. Large-scale droughts/floods
and monsoon circulation. Mon Weather Rev 1980, 108:1197–1211.
35. Dai A, Trenberth KE, Karl TR. Global variations in droughts and wet spells: 1900–1995. Geophys Res Lett1998, 25:3367–3370.
36. Dai A, Trenberth KE, Qian T. A global dataset of Palmer Drought Severity Index for 1870–2002: rela-tionship with soil moisture and effects of surface warming.J Hydrometeorol2004, 5:1117–1130.
37. Burke EJ, Brown SJ, Christidis N. Modeling the recent evolution of global drought and projections for the twenty-first century with the Hadley centre climate model.J Hydrometeorol2006, 7:1113–1125. 38. Burke EJ, Brown SJ. Evaluating uncertainties in the
projection of future drought.J Hydrometeorol2008, 9:292–299.
39. Cook ER, Meko DM, Stahle DW, Cleaveland MK. Drought reconstructions for the continental United States.J Clim1999, 12:1145–1162.
40. Cook ER, Woodhouse CA, Eakin CM, Meko DM, Stahle DW. Long-term aridity changes in the western United States.Science2004, 306:1015–1018. 41. Guttman NB, Wallis JR, Hosking JRM. Spatial
com-parability of the Palmer Drought Severity Index.Water Resour Bull1992, 28:1111–1119.
42. Wells N, Goddard S, Hayes MJ. A self-calibrating Palmer Drought Severity Index. J Clim 2004, 17:2335–2351.
43. van der Schrier G, Briffa KR, Jones PD, Osborn TJ. Summer moisture variability across Europe. J Clim
2006, 19:2818–2834.
44. van der Schrier G, Briffa KR, Osborn TJ, Cook ER. Summer moisture availability across North America. J Geophys Res 2006, 111:D11102. doi:11110.11029/12005JD006745.
45. Hobbins MT, Dai A, Roderick ML, Farquhar GD. Revisiting potential evapotranspiration parameter-izations as drivers of long-term water balance trends. Geophys Res Lett 2008, 35:L12403. doi:10.1029/2008GL033840.
46. Thornthwaite CW. An approach toward a rational classification of climate.Geogr Rev1948, 38:55–94. 47. Donohue RJ, McVicar TR, Roderick ML. Assessing
the ability of potential evaporation formulations to capture the dynamics in evaporative demand within a changing climate.J Hydrol2010, 386:186–197. 48. Cook ER, Seager R, Cane MA, Stahle DW. North
American drought: reconstructions, causes, and con-sequences.Earth-Sci Rev2007, 81:93–134.
49. Herweijer C, Seager R, Cook ER, Emile-Geay J. North American droughts of the last millennium from a gridded network of tree-ring data. J Clim 2007, 20:1353–1376.
50. Seager R, Tzanova A, Nakamura J. Drought in the southeastern United States: causes, variability over the last millennium, and the potential for future hydrocli-mate change.J Clim2009, 22:5021–5045.
51. Seager R, Ting M, Davis M, Cane M, Naik N, Nakamura J, Li C, Cook ER, Stahle DW. Mexican drought: an observational modeling and tree ring study of variability and climate change. Atmosfera
2009, 22:1–31.
52. CNMA (Chinese National Meteorological Adminis-tration).Yearly Charts of Dryness/Wetness in China
for the Last 500-Year Yeriod.Beijing: Chinese Carto-graphic Publishing House; 1982, 332.
53. Wang SW, Zhao ZC, Chen ZH, Tang ZG. Drought-flood variations for the last two thousand years in China and comparison with global climatic change. In: Ye DZ, Fu CB, Chao JP, Yoshino M, eds.The Climate of China and Global Climate.Springer Berlin Heidel-berg New York: China Ocean Press; 1987, 20–29. 54. Qian WH, Hu Q, Zhu YF, Lee DK. Centennial-scale
dry-wet variations in East Asia. Clim Dyn 2003, 21:77–89.
55. Zhang D, Li X, Liang Y. Supplement of yearly charts of dryness/wetness in China for the last 500-year period, 1993–2000. J Appl Meteorol Sci 2003, 14:379–389.
56. Zou XK, Zhai PM, Zhang Q. Variations in droughts over China: 1951–2003. Geophys Res Lett 2005, 32:L04707. doi:04710.01029/02004GL021853. 57. Davi NK, Jacoby GC, Curtis AE, Bachin B. Extension
of drought records for central Asia using tree rings: west central Mongolia.J Clim2006, 19:288–299. 58. Xin X, Yu R, Zhou TJ, Wang B. Drought in late
spring of South China in recent decades.J Clim2006, 19:3197–3206.
59. Zhang Q, Gemmer M, Chen JQ. Climate changes and flood/drought risk in the Yangtze Delta, China, during the past millennium.Quatern Int2008, 176:62–69. 60. Fang KY, Gou XH, Chen FH, Yang MX, Li JB,
He MS, Zhang Y, Tian QH, Peng JF. Drought vari-ations in the eastern part of northwest China over the past two centuries: evidence from tree rings.Clim Res
2009, 38:129–135.
61. Li JB, Cook ER, D’arrigo RD, Chen FH, Gou XH. Moisture variability across China and Mongolia: 1951–2005.Clim Dyn2009, 32:1173–1186. 62. Chen FH, Chen JH, Holmes J, Boomer I, Austin P,
et al. Moisture changes over the last millennium in arid central Asia: a review, synthesis and comparison with monsoon region.Quat Sci Rev2010, 29:1055–1068. 63. Cook ER, Anchukaitis KJ, Buckley BM, D’Arrigo RD, Jacoby GC, Wright WE. Asian monsoon failure and megadrought during the last millennium. Science
2010, 328:486–489.
64. Zhai JQ, Su B, Krysanova V, Vetter T, Gao C, Jiang T. Spatial variation and trends in PDSI and SPI indices and their relation to streamflow in ten large regions of China.J Clim2010, 23:649–663.
65. Touchan R, Anchukaitis KJ, Meko DM, Attalah S, Baisan C, Aloui A. Long term context for recent drought in northwestern Africa. Geo-phys Res Lett 2008, 35:L13705. doi:13710.11029/ 12008GL034264.
66. Shanahan TM, Overpeck JT, Anchukaitis KJ, Beck JW, Cole JE, Dettman DL, Peck JA, Scholz CA, King JW. Atlantic forcing of persistent drought in West Africa.Science2009, 324:377–380.