The evolution, modifications and interactions of
proteins and RNAs
Ananth Prakash Surappa-Narayanappa
Hughes Hall
University of Cambridge
European Bioinformatics Institute
A dissertation submitted for the degree of
Doctor of Philosophy
To,
“Extraordinary claims require extraordinary evidence.”
― Carl Sagan
Declaration
This dissertation is the result of my own work and includes nothing which is the outcome of work done in collaboration except as declared in the Preface and specified in the text.
It is not substantially the same as any that I have submitted, or, is being concurrently submitted for a degree or diploma or other qualification at the University of Cambridge or any other University or similar institution except as declared in the Preface and specified in the text. I further state that no substantial part of my dissertation has already been submitted, or, is being concurrently submitted for any such degree, diploma or other qualification at the University of Cambridge or any other University or similar institution except as declared in the Preface and specified in the text.
This dissertation does not exceed the prescribed word limit of the Degree Committee for the Faculty of Biology.
Summary
Proteins and RNAs are two of the most versatile macromolecules that carry out almost all functions within living organisms. In this thesis I have explored evolutionary and regulatory aspects of proteins and RNAs by studying their structures, modifications and interactions.
In the first chapter of my thesis I investigate domain atrophy, a term I coined to describe large-scale deletions of core structural elements within protein domains. By looking into truncated domain boundaries across several domain families using Pfam, I was able to identify rare cases of domains that showed atrophy. Given that even point mutations can be deleterious, it is surprising that proteins can tolerate such large-scale deletions. Some of the structures of atrophied domains show novel protein-protein interaction interfaces that appear to compensate and stabilise their folds.
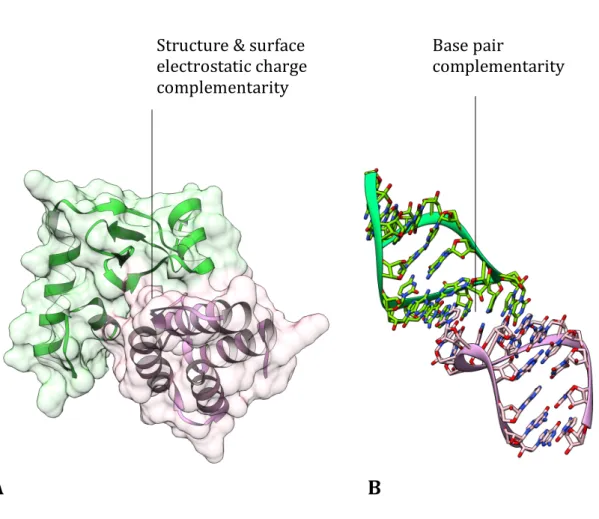
Protein-protein interactions are largely influenced by the surface and charge complementarity, while RNA-RNA interactions are governed by base-pair complementarity; both interaction types are inherently different and these differences might be observed in their interaction networks. Based on this hypothesis I have explored the protein-protein, RNA-protein and the RNA-RNA interaction networks of yeast in the second chapter. By analysing the three networks I found no major differences in their network properties, which indicates an underlying uniformity in their interactomes despite their individual differences.
In the third chapter I focus on RNA-protein interactions by investigating post-translational modifications (PTMs) in RNA-binding proteins (RBPs). By comparing occurrences of PTMs, I observe that RBPs significantly undergo more PTMs than non-RBPs. I also found that within RBPs, PTMs are more frequently targeted at regions that directly interact with RNA compared to regions that do not. Moreover disorderedness and amino acid composition were not observed to significantly influence the differential PTMs observed between RBPs and non-RBPs. The results point to a direct regulatory role of PTMs in RNA-protein interactions of RBPs.
In the last chapter, I explore regulatory RNA-RNA interactions. Using differential expression data of mRNAs and lncRNAs from mouse models of hereditary hemochromatosis, I investigated competing regulatory interactions between mRNA, lncRNA and miRNA. A mutual interaction network was created from the predicted miRNA interaction sites on mRNAs and lncRNAs to identify regulatory RNAs in the disease. I also observed interesting relations between the sense-antisense mRNA-lncRNA pairs that indicate mutual regulation of expression levels through a yet unknown mechanism.
Acknowledgements
The more I think about what to write here, the more difficult it is proving to be - how do I thank all the people on a sheet of paper, who have been with me on this scientific and emotional journey over the last four years. As I reflect on the past, all I can think of are sweet memories that come rushing back. It is impossible for me to pick one memory over another or thank a few people among the many, whom I have met over these past few years; for them I am ever so grateful to have made this happen.
One person who I am very grateful to is my supervisor, Alex Bateman. If it weren’t for him, things would have been very different for me. By giving me an opportunity to do Ph.D. at the EBI, he has definitely changed my life for good. I have not only learned from him how to do good science, but also how to be a better scientist. I thank him for being patient and kind with me, guiding me and for having confidence in me at times when I had doubts about myself. He is my best supervisor, ever.
I also thank my Thesis Advisory Committee members – Dr. Laura Itzhaki, Dr. Toby Gibson, Dr. Sarah Teichmann, Dr. Anton Enright and Dr. Marco Marcia, who over the years have given valuable advice on my projects. I thank Dr. Martina Muckenthaler and Dr. Kamesh Babu for providing me with experimental data on lncRNAs.
I am lucky to have had Penny, Ruth and Gera as my colleagues earlier during my Ph.D. I’d like to thank Neil, for educating me on birds, wildlife, classical antiquity and ancient Egyptian history on our daily discussions at tea in the mornings and also for proofreading my thesis. I also thank Matt, Aleix and my fellow predocs for scientific discussions.
I thank my friends for bringing fun and colour in my life during these years. Hugs to my two bestest friends Jag & Swaathi – for taking me in and making me a part of their family. I shall always have a big smile on my face when I think of Uma, Navis, Venkat, Thawfeek, Netra, Phani, Kedar, Nitin and Rizwan.
I’ve dedicated this thesis to my Mum and Dad, who have always shown love and support. I’ve had their emotional support and comfort all through these years. Mum has been my greatest source of strength in life. She has encouraged me, laughed and shared my happiness over those innumerable phone calls everyday over the last four years. I would also like to thank my brother and sister for their moral support.
Contents
Preface ... xiii
Chapter 1 ... 1
Protein domain atrophy – identification and characterisation of functional partial protein domains ... 1 1.1 Introduction ... 1 1.2 Methods ... 7 1.2.2 Nomenclature ... 7 1.2.3 Atrophy Score ... 9 1.2.4 Filtering ... 12 1.2.5 Manual inspection ... 12 1.2.6 Structure visualisation ... 15 1.2.7 Phylogenetic analysis ... 15 1.3 Results ... 16
1.3.1 N-terminal end-bounded atrophy ... 19
1.3.2 C-terminal end-bounded atrophy ... 26
1.3.3 Upstream domain-bounded atrophy ... 28
1.3.4 Downstream domain-bounded atrophy ... 28
1.3.5 Within-domain atrophy ... 33
1.4 Conclusion ... 36
1.5 References ... 42
Chapter 2 ... 49
2.1 Introduction ... 49
2.2 Methods ... 56
2.2.1 Data collection and curation ... 56
2.2.2 Network analysis ... 56
2.2.3 Degree distribution ... 57
2.2.4 Clustering coefficient (Transitivity) ... 58
2.2.5 Betweenness centrality ... 58
2.2.6 Closeness centrality ... 58
2.2.7 Neighbourhood connectivity ... 58
2.3 Results ... 59
2.3.1 Degree distribution ... 63
2.3.2 Clustering coefficient (Transitivity) ... 67
2.3.3 Betweenness centrality ... 71 2.3.4 Closeness centrality ... 74 2.3.5 Neighbourhood connectivity ... 76 2.4 Conclusion ... 80 2.5 References ... 83 Chapter 3 ... 89
Post-translational modifications of RNA-binding proteins ... 89
3.1 Introduction ... 89
3.2 Methods ... 96
3.2.1 RNA-binding peptides ... 96
3.2.2 Non RNA-binding proteins ... 98
3.2.3 RNA-binding proteins ... 98
3.2.5 Post-translational modifications ... 99
3.2.6 Globular and disordered regions ... 99
3.2.7 Structural validation ... 99
3.2.8 Protein abundance ... 100
3.3 Results ... 100
3.3.1 Overview of RBDpep and candidate RBDpep datasets ... 100
3.3.2 Post-translational modifications in binding proteins and non RNA-binding proteins ... 102
3.3.3 Post-translational modifications in binding peptides and non RNA-binding peptides ... 111
3.3.4 Disorderedness in RNA-binding proteins ... 116
3.3.5 Functional classification of RNA-binding proteins ... 118
3.3.6 Amino acid abundance ... 120
3.3.7 Protein abundance ... 122
3.3.8 Structural validation ... 124
3.3.9 Regulation of RNA-protein interactions mediated by post-translational modifications ... 126
3.4 Conclusion ... 130
3.5 References ... 133
Chapter 4 ... 141
Long non-coding RNA mediated regulation of gene expression in hereditary hemochromatosis ... 141
4.1 Introduction ... 141
4.2 Methods ... 150
4.2.2 RNA sequencing and differential expression analysis ... 150
4.2.3 Homology of lncRNAs ... 151
4.2.5 miRNA target site prediction ... 152
4.2.6 Competing endogenous RNA network ... 152
4.2.7 Sense-antisense mRNA-lncRNA pairs ... 153
4.2.8 LincRNA-adjacent mRNA pairs ... 154
4.2.9 Gene Ontology ... 154
4.3 Results ... 155
4.3.1 Overview of Fpn-C326S and Fpn-Trp datasets ... 155
4.3.2 Homologues of lncRNAs ... 157
4.3.3 miRNA target site prediction and conservation ... 159
4.3.4 Competing endogenous RNA network ... 164
4.3.5 Co-expression of sense-antisense mRNA-lncRNA pairs ... 171
4.3.6 Correlation of expression of lincRNAs and adjacent mRNAs ... 177
4.3.7 Gene ontology enrichment ... 181
4.4 Conclusion ... 181 4.5 References ... 186 Appendix ... 195 Table A1 ... 197 Table A2 ... 200 Figure A1………...……..202 Figure A2………...……..203 Table A3 ... 204 Table A4 ... 207
Preface
The work on this thesis began four years ago, in August 2013, during the Ph.D. selection interviews. It was during the interview my supervisor Dr. Alex Bateman and I discussed how we had both previously noticed structures of protein domains that had undergone degradation. We realised that there could be many other such structurally degraded protein domains out there, which may have not been discovered. Literature search confirmed our doubts that partial protein domains do not appear to have been systematically studied, except for a few sporadic reports in the literature. We agreed that I would begin work on my Ph.D. by systematically looking for partial protein domains. During the course of this work, in 2014, Alex met Dr. William Pearson and Dr. Deborah Triant, from the University of Virginia, at the Intelligent Systems for Molecular Biology (ISMB) conference in Boston, USA, where both groups discovered that they have been working on a related topic. While Pearson and Triant focussed on the bioinformatics causes of partial domain artefacts, we focussed on identifying cases of true partial domains. Due to the similar nature of work, we borrowed their nomenclature for describing different domain atrophy types. In the end both groups, using different perspectives, came to a similar conclusion on partial domains – that true cases of partial domains are extremely rare and most cases are sequence artefacts. This work is presented in Chapter 1. Results from both groups were published as back-to-back research articles in Genome Biology. Genome Biology also carried out a research highlight article commenting on partial protein domains by Lawrence Kelley and Michael Sternberg from Imperial College London. The studies were also featured in news outlets such as BioMed Central’s blog network and EMBLetc.
Following the publication of this study and discussions with the Thesis Advisory Committee, Alex and I planned the next course of projects, which focussed on studying interactions involving RNAs. Firstly, I would compare and analyse protein-protein, protein-RNA and RNA-RNA interaction networks, then I would
focus on post-translational modifications and their influence on protein-RNA interactions and finally investigate RNA-RNA interactions by studying regulation of messenger RNA (mRNA) expression by non-coding RNAs (ncRNAs). During this period, in November 2014, Dr. Martina Muckenthaler and Dr. Kamesh Rajendra Babu, from the University Hospital Heidelberg, Germany, contacted us regarding a collaborative project on non-coding RNAs. I accepted to work on this topic as it fitted well into my research plans. Their experimental group at Heidelberg had characterised coding and non-coding transcripts that were differentially expressed in mouse models of hereditary hemochromatosis – a genetic condition that causes abnormality in iron homeostasis. I explored various computational methods to understand if non-coding transcripts such as long non-coding RNAs and microRNAs would form mutual regulatory interactions with mRNAs to control their expression. This topic was new and challenging to me and offered a good understanding and appreciation of the complexities of the regulatory RNA-world. I passed on the results to the experimental group, which were then taken up by them for further experimental analyses. Chapter 4 documents the outcome of this work.
By March 2016 I had started to analyse the protein and RNA interaction networks in yeast and humans. This work was carried out using the macromolecular interaction data curated from literature by Dr. Sandra Orchard from the IntAct team at the EBI, UK and Dr. Simona Panni from the University of Calabria, Italy. In this study I have compared the physical network properties of three macromolecular interaction networks – protein-protein, protein-ncRNA and ncRNA-ncRNA. The yeast non-coding RNA-RNA interaction network from this study is the first such reported non-coding RNA interaction network. The result from this study is presented in Chapter 2. The results were accepted for publication by the RNA journal and the manuscript is currently in the pre-publication process.
Lastly, I investigated post-translational modifications (PTMs) of RNA-binding proteins. The aim of this study was to understand how PTMs could influence interactions with the RNA. By using data from a recently published study in
August 2016, on binding peptides, I was able to map PTM sites onto RNA-binding proteins, which then allowed me to distinguish PTMs in RNA-RNA-binding regions from non RNA-binding regions. The outcome of this work is presented in Chapter 3. I plan to draft the results form this study and submit the manuscript for publication.
A small project that I undertook at the beginning of my PhD, that is not part of the thesis, was in collaboration with Dr. David Thomas from the Department of Medicine, University of Cambridge, UK. In this project I analysed homology of an uncharacterised mouse protein C17ORF62 later named Eros. This result as part of the larger study was published in The Journal of Experimental Medicine.
I have also presented the results of my work in regional and international meetings. The domain atrophy study was presented at the 2nd student
symposium organised by International Society for Computational Biology’s Regional Student Group (ISCB-RSG) – UK chapter, 2015 in Norwich. Results from the lncRNA-mediated regulation of hereditary hemochromatosis were presented at RNA 2016 The 21st Annual Meeting of the RNA Society, in Kyoto, Japan.
Chapter
1
Protein domain atrophy
–
identification and
characterisation of functional partial protein
domains
1.1 Introduction
Protein domains are key to the diversity of structure and functions observed in proteins. Domains are composed of a defined set of secondary structural elements, which are spatially arranged to form distinct folded stable 3-dimensional structures. In their billions of years of evolution, domains have evolved from simple folds with basic functions to large multifunctional complex subunits. In the traditional sense, protein domains are viewed as indivisible structural and functional building blocks; however, a few recent studies have identified proteins that are composed of structurally partial or incomplete domains. Existence of such partial protein domains is interesting as they shed light on the evolution, function and stability of these domains. In this chapter I have carried out large-scale systematic analysis of protein domain families in Pfam in order to identify cases of partial structural domains. I quantify the magnitude of structural loss in protein domains and discuss the nature of deletions, their functions and the mechanisms that stabilise these domains. Finally, I discuss some of the bioinformatics artefacts that plague the identification of true partial domains.
Domains are spatially distinct structural units within a protein that are characterised by conserved sequence, geometrical compactness and the ability to fold and function independently (Ponting and Russell, 2002). One of the characteristic features of protein domains is their recurrence in different contexts, i.e., the domain is observed in one or more different multidomain proteins (Ponting and Russell, 2002; Vogel et al., 2004). This modularity allows protein domains to be combined in many ways giving rise to proteins with diverse structures and functions.
Protein domains have distinct 3-dimensional folds that have evolved along with their functions. The term protein fold commonly denotes the topology of secondary structural elements and their unique spatial arrangement within a domain. Evolutionarily related functionally similar domains often exhibit the same fold, however it is also commonly observed that the same protein fold is shared between protein domains that are functionally diverse (Martin et al., 1998). One of the best-known examples of one-fold-many-functions is the TIM barrel fold, which is commonly observed among protein domains that catalyse a wide range of chemical reactions (Nagano et al., 2002). Given the intrinsic physical constraints of protein folding, it is assumed that there is a limited number of ways a domain can fold, which has led to an observation that the multitude of protein functions are carried out by only a few thousand unique protein folds (Chothia, 1992; Finkelstein et al., 1993).
Identification of a large number of protein domains have led to the systematic classification of domains into families and superfamilies either based on their 3-dimensional structures or folds (Andreeva et al., 2014; Sillitoe et al., 2015) or based on their amino acid sequences (Finn et al., 2016). The SCOP and CATH databases are two of the well-known structure-based classifiers of protein domains, which group domains based on their similarity in structure or folds with or without detectable sequence similarity (Andreeva et al., 2014; Sillitoe et al., 2015). The Pfam database classifies protein domains based on sequence similarity; domains with highly similar sequences are grouped into families and clans and also have similar functions (Finn et al., 2016). Some of the other
databases that classify protein domains based on sequence and/or structure include FSSP (Holm and Sander, 1998), CDD (Marchler-Bauer et al., 2015), SMART (Letunic et al., 2012), ProDom (Servant et al., 2002) and PROSITE (Sigrist et al., 2013) among others. At present there are 1,393 different folds defined by SCOP (v1.75, 2017) and 1,375 unique folds (topologies) defined by CATH (v4.0.0, 2017) and 16,712 protein domain families defined by Pfam (31.0, 2017).
A large fraction of proteins among prokaryotes and eukaryotes are composed of two or more domains; about two-thirds of prokaryotic proteins and about 80% of eukaryotic proteins are multidomain (Chothia et al., 2003; Teichmann et al., 1998). It is often observed that multidomain proteins evolve through domain duplications followed by functional modification either through sequence divergence or by recombination with other domains (Lynch and Conery, 2000; Vogel et al., 2004). Proteins have also been observed to lose single or multiple domains during their course of evolution through mechanisms such as insertion of new start and stop codons, gene fusion and gene fission (Buljan and Bateman, 2009; Weiner et al., 2006).
Apart from the domain gain or domain loss events, protein domains, at a smaller scale of modification, can gain or lose secondary structural elements through insertions or deletions (indels) of amino acid residues. Analyses of a large number of domain superfamily sequences and structures have shown variability in domain lengths, which are attributed to indels in loops, coils or a few secondary structural elements that leave the domain core largely unaltered (Pascarella and Argos, 1992; Sandhya et al., 2008; Sandhya et al., 2009; Taylor et al., 2004). Variations in domain lengths caused by gain of accessory secondary structural elements or ‘embellishments’ are well studied (Reeves et al., 2006). One of the examples of embellishments in protein domains is the HUP superfamily (CATH: 3.40.50.620), wherein domains exhibit large structural variations around its domain core (Dessailly et al., 2010). Some of the other superfamily members that exhibit large-scale domain embellishments include galactose binding domain-like superfamily (CATH: 2.60.120.260), cupredoxin superfamily (CATH: 2.60.40.420), dihydrodipicolinate reductase domain 2
superfamily (CATH: 3.30.360.10), ATP-dependent amine/thiol ligase superfamily (CATH: 3.30.0470.20) and the αβ-hydrolase superfamily (CATH: 3.40.50.1820) (Reeves et al., 2006). These embellishments have been observed to influence interactions, affect substrate specificity, binding and stability and degradation (Dessailly et al., 2010; Reeves et al., 2006).
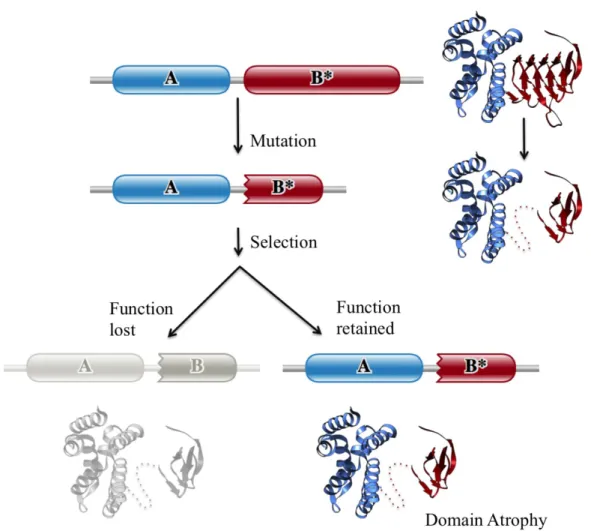
Similar to domain embellishments, protein domains could also undergo large-scale loss or degradation of secondary structural elements. I propose the term ‘domain atrophy’ for events that lead to a large-scale loss of core secondary structural elements in protein domains. Figure 1.1 schematically illustrates the theory of domain atrophy using an example of a multi-domain protein. In the course of protein evolution one or more domains in a protein undergo truncation or a significant loss of its structural elements due to a mutation or other cellular events. The protein with a truncated or atrophied domain that still retains its active sites or original function, such as enzymatic or structural, may be positively selected while the protein with a non-functional atrophied domain is lost. Unlike cases wherein only a few peripheral secondary structural elements are lost, domain atrophy refers to large-scale deletions of ‘core’ structural elements.
Mutational events that lead to such large-scale loss of domain structure are often detrimental to protein stability and function. Proteins are only marginally stable such that a mutation of a single amino acid residue can drastically influence its folding. For example, single missense mutations within the sucrose domain of sucrose-isomaltase leads to defects in protein folding and transport (Alfalah et al., 2009). It is also observed that the core mutation of a single amino acid residue determines the folding stability of the N-terminal domains of P-type copper ATPases CopAa and CopAb (Banci et al., 2003). Large-scale deletions are also expected to significantly alter stability, however cases exist wherein such deletions only marginally affect protein stability. For example, removal of a stretch of amino acids such as the whole β-strand of the Ig-domain of the human
muscle protein titin only marginally decreases stability by 2.8 kcal/mol (Fowler et al., 2002). Single or large-scale deletions or mutations of amino acid residues
affect protein stability and function differentially based on their location. Mutations of amino acids that are part of peripheral secondary structures or loops, termini, or those present on the protein surface are more likely to be tolerated, whereas mutations within the hydrophobic core that disrupt packing are not (Bowie et al., 1990).
Unlike domain elaborations, which is commonly seen in protein structures, structural data and literature on domain atrophy is very scarce. Only three cases of structural partial domains have been observed in the past, which include ‘truncated globin family’ (Nardini et al., 2007) and bacterial luciferases (Grishin, 2001) and recently in a domain of unknown function DUF2172 (Das et al., 2014). One of the main reasons that the atrophied domains are less studied could be due to their rarity because of the reasons described above. However, natural occurrences of a few stable protein domains with large-scale structural deletions are intriguing and suggest that compensatory mechanisms that help stabilise these atrophied domains must exist.
In this chapter, using sequence-based profile hidden Markov models (HMMs) of protein domain families, I have devised an algorithm to identify potential new cases of domain atrophy. I introduce a new metric called the ‘atrophy score’ to quantify the magnitude of structural loss. Using the algorithm I have identified several new cases of domain atrophy. For sequences where experimental structures were not available I have instead mapped sequences of atrophied domains on to complete homologous structures, as reference, to infer the extent of atrophy. I have also identified cases that confound the discovery of true atrophied domains. Using a series of filters and through manual curation I avoid cases of computational artefacts and discuss their possible origins. Finally, I discuss compensatory mechanisms that stabilise the folds of atrophied domains.
Figure 1.1 Schematic representation of domain atrophy event. A protein with a particular architecture comprising domains A and B, wherein domain B has the active site residues, undergoes mutation resulting in truncation of domain B. The protein is positively selected if the truncated domain retains its functional state (enzymatic or structural), while the protein with a non-viable truncated domain is lost. Complete Pfam domain boundaries are denoted by smooth edges and incomplete domain boundaries are denoted by toothed edges. Dotted line in the toy example shows the region of atrophy. Figure reused from (Prakash and Bateman, 2015), doi: 10.1186/s13059-015-0655-8.
1.2 Methods
The following sections (1.2.1 to 1.2.7) are taken verbatim from (Prakash and Bateman, 2015).
1.2.1 Data
To identify potential cases of domain atrophy I use matches of the UniProt sequence database (release 2012_06) against the profile HMM models from the Pfam database release 27.0 (Finn et al., 2014). This set of matches contains 28,738,352 Pfam-A protein domain instances across 14,831 families in 18,523,877 protein sequences.
1.2.2 Nomenclature
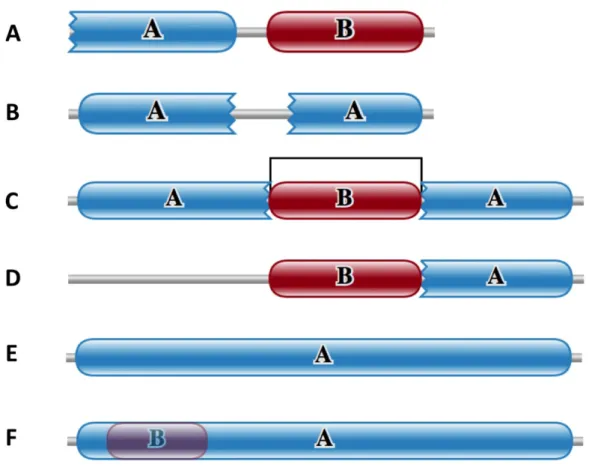
Domain atrophy events were classified into five types, based on the domain location (architecture) in the protein and the region of atrophy in the domain. Figure 1.2 shows the schematic representations of the five types atrophied domains, which are described below.
(1) N-terminal end-bounded atrophy: structural loss at the N-terminal region of the N-terminal domain.
(2) C-terminal end-bounded atrophy: structural loss at the C-terminal region of the C-terminal domain.
(3) Upstream domain-bounded atrophy: structural loss at the N-terminal region of an inner domain, also including the N-terminal region of the C-terminal domain.
(4) Downstream domain-bounded atrophy: structural loss at the C-terminal region of an inner domain, also including the C-terminal region of the N-terminal domain.
Figure 1.2 The five classes of domain atrophy events. Complete Pfam domain boundaries are represented as smooth edges. Domain boundaries with incomplete or partial matches to Pfam HMM models are represented as toothed-edges. Figure reused from (Prakash and Bateman, 2015), doi: 10.1186/s13059-015-0655-8.
1.2.3 Atrophy Score
To determine which domains may be cases of atrophy I calculated a measure called the Atrophy Score (AS) at both the N-terminal (ASN) and C-terminal (ASC)
boundaries of each domain instance using their protein sequence and HMM coordinates.
An HMM is a statistical model that describes observable events that depend on internal factors, through a visible process of observable symbols and an invisible process of hidden states. These models have been applied in a wide range of applications from speech recognition to passive sonar detection. In the case of biology, the HMM architecture that is used today was introduced by Sjölander and Haussler (Krogh et al., 1994) and became known as profile HMMs. Protein profile HMMs can be used to infer homology and predict secondary and tertiary structures. A Pfam profile HMM representing a particular protein family is built from an aligned set of good quality homologous protein sequences. This profile HMM comprises a number of hidden states, which correspond to columns of a multiple sequence alignment. As the HMM progresses from one state to another according to the state-transition probabilities, the state emits an amino acid residue (or symbol) according to its symbol-emission probabilities (Eddy, 2004). Once the end state is reached the observable sequence of amino acid residues (or symbols) is generated. As well as acting as a generative model, profile HMMs can be used to score sequences to see how well they fit the model. The general scoring scheme is to calculate the probability of the sequence given the model, normalised by the probability of the sequence being generated by a null or random model.
Figure 1.3 shows a schematic representation of the parameters used in calculating domain atrophy score. The equations used to calculate the atrophy score are shown below:
AS
N= (D
N– d
N)/L ………
(Eqn. 1)Where, ASN is the atrophy score at the N-terminus of the domain, DN is the
number of unmatched HMM match states at the N-terminus of the domain, dN is
the inter-domain distance or domain interval, i.e., the number of amino acid residues between the domain and its adjacent upstream domain or the sequence start site in the case of an N-terminal domain, and L is the HMM model length of the domain family. Similarly ASC, DC and dC correspond to atrophy score at the
terminus of the domain, the number of unmatched HMM match states at the C-terminus of the domain and the inter-domain distance to the start site of the downstream domain or, in the case of a C-terminal domain, its sequence end site respectively. Instances of within-domain atrophy can be identified in cases where the profile HMM matches to a single domain have been split into two profile HMM matches, with the first corresponding to the N-terminal part of the domain and the second corresponding to the C- terminal part of the domain. Instances of within-domain atrophy were distinguished from tandem repeats by considering the HMM match states of each domain. The start HMM-match state of the downstream domain is greater than the end HMM-match state of the upstream domain in cases of split domains. The computation of within-domain atrophy score (ASW) is similar to ASN.
AS
w= (D
w– d
w)/L ………
(Eqn. 3)Where DW is the number of unmatched HMM match states within the domain, dW
is the domain interval within the domain and L is the HMM model length of the domain family. Alignment co-ordinates of each domain are considered to calculate the inter-domain interval. An intuitive description of the atrophy score would be that a score of 0.33 means that one-third of the length of the domain has been lost to domain atrophy.
Figure 1.3 Calculation of domain atrophy score. Atrophy score is the ratio of the missing region (D-d) of the domain to the domain HMM-model length (L). (A) N-terminal end-bounded atrophy, (B) C-terminal end-bounded atrophy, (C) Upstream domain-bounded atrophy, (D) Downstream domain-bounded atrophy and (E) Within-domain atrophy. Figure reused from (Prakash and Bateman, 2015), doi: 10.1186/s13059-015-0655-8.
1.2.4 Filtering
Initial results from applying the atrophy score to all UniProt proteins showed that there were numerous common failure modes (Figure 1.4) that would mask the ability to find genuine domain atrophy events. Therefore, I applied a set of filters to reduce the number of false positive matches with high atrophy scores. Of a total of 23,193,494 sequences in the database, 18,523,877 sequences had at least one Pfam-A domain instance and these were used in the analysis. Initial filtering was applied to exclude domain models from sequences with protein existence (PE) levels of 2 to 5. These are enriched in gene prediction errors and fragment proteins. This reduced the number of sequence considered from 18,523,877 to 77,305. Proteins with a protein existence level of 1 have clear experimental evidence for the existence of the protein from Edman sequencing, mass spectrometry, X-ray, NMR or other experimental evidence. Although not strictly a measure of protein sequence quality these proteins usually have highly accurate protein sequences. We also removed sequences annotated as fragments in UniProt, which further reduced the set of sequences considered from 77,305 to 75,435.
Adjacent domains that are of the same clan, similar to figure 1.4B, could lead to ambiguous domain boundary assignments at the interval and hence such cases were filtered out to avoid detecting false atrophy events. The resulting final-set comprising 114,303 domain instances from 75,435 sequences were included in the analysis. The algorithm pipeline was implemented in Perl to calculate atrophy scores across the set of domains. Domain instances with an atrophy score of 0.15 or more were further investigated.
1.2.5 Manual inspection
Domain instances that were obtained after applying the above filters were then selected for manual inspection. Only those domains that had an atrophy score of 0.15 or above were checked manually for identification of false positives. Each
potential domain atrophy case was checked for evidence of any of the following failure modes (see Figure 1.4):
(1) Gene prediction errors: I checked whether the missing part of a domain was to be found in an adjacent gene or due to an incomplete gene prediction. (2) Nested domains: I checked whether a high atrophy score was due to a
domain nesting within another. These were considered as false positives. (3) Multi-domain families: Due to incorrect Pfam domain definitions some Pfam
domains actually correspond to multiple structural domains that can be found independently. I checked the structure of each Pfam family to confirm whether this was the cause of a high atrophy score.
(4) Small domains: Domains of length less than 30 amino acid residues were not considered since atrophy score of 0.15 and above of small domains correspond to loss of a single secondary structural element or a part thereof, which is not considered true atrophy.
(5) Circular permutations: While circular permuted domains are complete domains, the rearrangement of domain HMM start-site and HMM end-site with respect to their domain HMM-model would result in misidentification of such cases as domain atrophies.
(6) Short repeats: Domains composed of tandem structural motifs, such as β-propeller, β- or α-helix, are made of short repeating sequence motifs were considered as false positives. Addition or removal of repeats is often tolerated in terms of protein mutation.
(7) Disordered domains: Inferring domain atrophy among intrinsically disordered protein domains is not straightforward mainly owing to their
Figure 1.4 Failure modes of the pipeline. Some of the commonly observed domain architectures that were classified as false-positives or failure modes by the pipeline. (A) Incorrect gene prediction or partial sequence: sequence fragment or incorrect gene prediction could lead to events that look like domain atrophy, example: Aldo/keto reductase family (UniProt: P43546, Pfam: PF00248) (B) Tandem repeat: a tandem repeat is distinguished from single domain instances that are split/predicted in two parts, by considering its HMM match coordinates; for tandem domain instances the downstream domain start-HMM-match state is less than the upstream domain end-start-HMM-match state, example: Peroxidase (UniProt: A0QXX7, Pfam: PF00141). (C) Nested domain: this architecture results in an atrophy score greater than 1 for domain hosting nested domain(s), example: Peptidase_M20 (UniProt: A0Z6B3, Pfam: PF01546) (D) Unmatched domain region: missing region of the domain containing a nested domain, example: Lon_C (UniProt: A4ILZ1, Pfam: PF05362). (E) Multi-domain family: a single-domain architecture comprising more than one domain. (F) Domain overlap, example: 4Fe-4S single cluster domain (UniProt: A6L094, Pfam: PF13353). Figure reused from (Prakash and Bateman, 2015), doi: 10.1186/s13059-015-0655-8.
lack of native ordered tertiary structure and such cases were considered false positives. Apart from the above failure modes domain atrophy cases whose structures were theoretically modelled or had no other reference structures in the family to compare with were also treated as failure modes. Other cases of complete structural domains but identified as domain atrophy were treated as false positives.
From a total of 1,362 domain instances, with atrophy scores between 0.15 and 1, which were manually checked, 1,287 domain instances were classified as failure modes or false positives. The positive predictive value (PPV) of my method to identify domain atrophy is (75/(75 + 1287)) = 0.055.
1.2.6 Structure visualisation
Structures were visualised with Chimera (Pettersen et al., 2004). Where experimental structures of atrophied domains were not available, the shortest full-length domain structure within the domain family was chosen as the reference. The extent of domain atrophy was then inferred by a pairwise sequence alignment guided mapping of unaligned sequence regions onto the reference structure. Instances of putative domain atrophy where no full-length reference structure was available for the family were not considered further.
1.2.7 Phylogenetic analysis
Evolutionary information was inferred from phylogenetic trees constructed from multiple sequence alignment of domain family seed sequences and homologous sequences from a JackHMMER search (Finn et al., 2011). A non-redundant set of sequences of 90% identity or less was aligned with MAFFT (Katoh and Standley, 2013). Alignments were visualised with Belvu (Sonnhammer and Hollich, 2005) and phylogenetic trees constructed using the neighbour-joining method present in Belvu using default parameters.
1.3 Results
Amino acid sequences from UniProt were scanned against the Pfam profile HMM models to identify potential cases of atrophied domains. I investigated the domains that showed partial matches to the profile HMM models and calculated the atrophy scores. Atrophy score quantifies the magnitude of structural loss and is equivalent to the fraction of the Pfam profile HMM model that is missing from the domain. A negative atrophy score indicates that domain is complete or there is no structural loss, while a positive atrophy score indicates an incomplete match to the profile HMM and structural loss. I note that a partial match of domain sequences to profile HMMs does not always denote domain atrophy; matches to the termini of profile HMM models could be missed due to low sensitivity of the model to the terminal sequences, hence for cases wherein a domain sequence does not completely match the profile HMM, similarity can often be found to the full-length domain by extending the sequence through simple sequence similarity comparison. In order to avoid detecting such partial profile HMM matches of full-length domains as domain atrophy, I have used domain boundaries of adjacent domains or the sequence terminus to constrain partial profile HMM matches. Full-length sequences of domains that are partially matched to profile HMMs cannot be extended over to the adjacent non-homologous domains or sequence terminus, which suggest that they represent potential cases of domain atrophy. Therefore I have only focussed on partial domains that are end-bounded in this study.
I investigated instances of domains with an atrophy score ≥ 0.15, wherein at least 15% of the domain is lost. Instances of domains with atrophy scores below 0.15 were neglected since they might represent cases of peripheral structural loss, which are not true cases of atrophy. Since the atrophy score is calculated considering the domain boundaries of adjacent domains, I observed that, due to the negative inter-domain distance, the atrophy scores of nested domains have the chance of reaching values of 1 or higher, which is an artefact of the scoring system. Therefore, I have excluded nested domains from further analyses.
I manually examined domains with an atrophy score between 0.15 and 1. Among these I identified 1,287 instances of false positives (or failure modes) that were incorrectly assigned as atrophied domains due to various reasons such as gene prediction errors, circular-permutated domains, profile HMM models comprising more than one domains and others (refer to section 1.2.5). Table 1.1 lists all the failure modes or false positives.
I classify partial domains into 5 different types, based on the site of atrophy and its end-boundary, as following: (1) N-terminal end-bounded atrophy; (2) C-terminal end-bounded atrophy; (3) Upstream domain-bounded atrophy; (4) Downstream domain-bounded atrophy; and (5) Within-domain atrophy. A detailed description of the five types of atrophy is discussed in section 1.2.2. 8 true domain atrophy events with evidence from known 3-dimensional structures and a further 67 putative domain atrophy events using homologous structures were confirmed. Among the 8 instances of true domain atrophy, 6 cases are representatives of N-terminal end-bounded atrophy (2 examples from the bacterial luciferase domain and 4 examples from the AMP-binding domain) and 2 cases are representatives of downstream domain-bounded atrophy. Some of the examples of true and putative domain atrophy are discussed below. For the complete list of atrophied domains, including 67 putative cases, refer to the appendix (Table A1).
Types of failure modes or false positives Number of instances
Gene prediction error 9
Containing nested domain 268
Multi-domain family 316 Small domain 173 Circular permutation 54 Short repeat 112 Disordered domain 85 Theoretical model 9
No other reference structure available 27
Complete structural domain 234
Total 1,287
1.3.1 N-terminal end-bounded atrophy
Type example:Bacterial luciferase domain (Pfam: PF00296)
The bacterial luciferase domain of the non-fluorescent flavoprotein (NFP) from
Photobacterium leiognathi luxF (UniProt: P09142) shows an atrophy score of 0.31, indicating a loss of nearly one-third of the domain’s structure. The second example within the same domain family includes NFP from Photobacterium phosphoreum luxF (UniProt: P12745) with a similar atrophy score of 0.31.
Figure 1.5A shows a schematic representation of the partial match of P. leiognathi luxF to the profile HMM model of the bacterial luciferase family (Pfam: PF00296). The 288 amino acid residue long luxF sequence is partially aligned with the profile HMM model beginning from HMM alignment start site co-ordinate 170. The HMM match state co-co-ordinate 170 corresponds to the amino acid residue 72 in the sequence, which indicates that there is no alignment between the N-terminal 71 amino acid residues and the first 169 unmatched states of the profile HMM model. Due to low sequence similarity the N-terminal 71 amino acid residues are not matched by the profile HMM model, but these residues are still part of the domain structure. It is clearly evident that these unmatched N-terminal 71 amino acid residues are far fewer compared to the number of unmatched HMM states; there are no amino acid residues that can be extended beyond the N-terminal sequence start site, which can completely cover or align with the remaining unmatched HMM states, therefore indicating a true loss of sequences at the N-terminal at the P. leiognathi luxF domain compared to a full-length canonical bacterial luciferase domain. Therefore using these values within equation 1 (refer to section 1.2.3) gives an N-terminal atrophy score ASN =
(169– 71)/307 = 0.31. The C-terminal end sequence of the domain can be extended by sequence similarity to completely cover the HMM-profile and exhibits no atrophy.
The bacterial luciferase domain, homolog of the bacterial luciferase subunits (Moore and James, 1995), is present mostly among members of gammaproteobacteria. The NFP acts as a ‘molecular sponge’ to sequester myristylated flavine mononucleotide, the side-product of the bio-luminescence pathway (Moore and James, 1995). The structure of NFPs from Photobacterium leiognathi (PDB: 1NFP) and Photobacterium phosphoreum (PDB: 1FVP) resemble a partial TIM-barrel-like fold missing a β-strand and three α-helices (Kita et al., 1996; Moore and James, 1995) (Figure 1.5B). To compare the extent of structural loss I compared the atrophied domain with the full-length reference structure of bacterial luciferase domain from Bacillus cereus (PDB: 2B81), which has a complete (β/α)8 TIM-barrel fold with characteristic β-barrel structure consisting
of eight alternating β-strands and α-helices (Figure 1.5C). Although from the HMM-model the atrophy was initially identified at the N-terminus of the domain, structural superpositions show that structural elements, β1, α1 and β2, at the
N-termini of 1NFP and 1FVP are intact, however the atrophied domains have no secondary structural elements that are equivalent to α2, β3, α3 and α4, of the
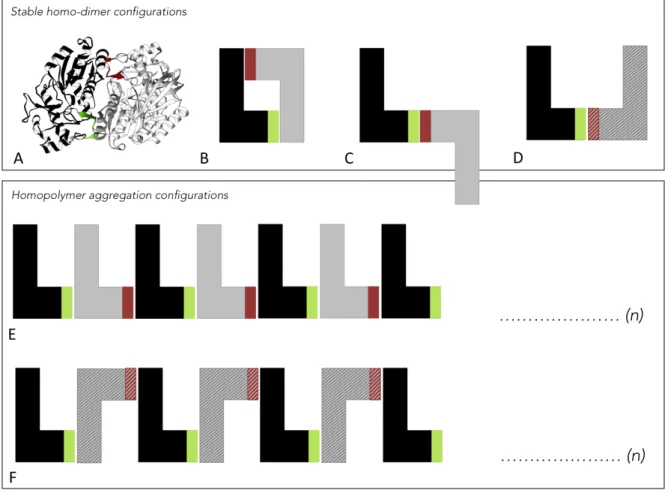
reference domain 2B81 (residues 61-125, 132-192), indicating that the atrophy is within the domain rather than at the N-terminus. Sequence alignment with luxB, a homologue of luxF, also shows atrophy within the domain (Figure 1.6A). It is well known that domain cores are highly hydrophobic and their exposure to solvent leads to unfolding or destability (Miller et al., 1987; Rose et al., 1985). The hydrophobic β-barrel core of the TIM-barrel fold is shielded from the solvent by the peripheral α–helices. It is therefore interesting to know how the atrophied bacterial luciferase domains with a solvent-exposed hydrophobic cleft are stable by tolerating such large deletion. The crystal structures of atrophied domains (PDB: 1FVP) shows that the atrophied domain buries its solvent exposed hydrophobic core by forming homo-dimeric interactions (Figure 1.5D) (Kita et al., 1996; Moore et al., 1993). The two solvent-exposed clefts face each other forming a new dimer interface that shields the exposed core from the solvent and thereby forming stabilising interactions. Interestingly a similar homo-dimeric interaction is observed in the complete full-length domain 2B81 at the same side of the molecule that exhibit atrophy (Figure 1.5E).
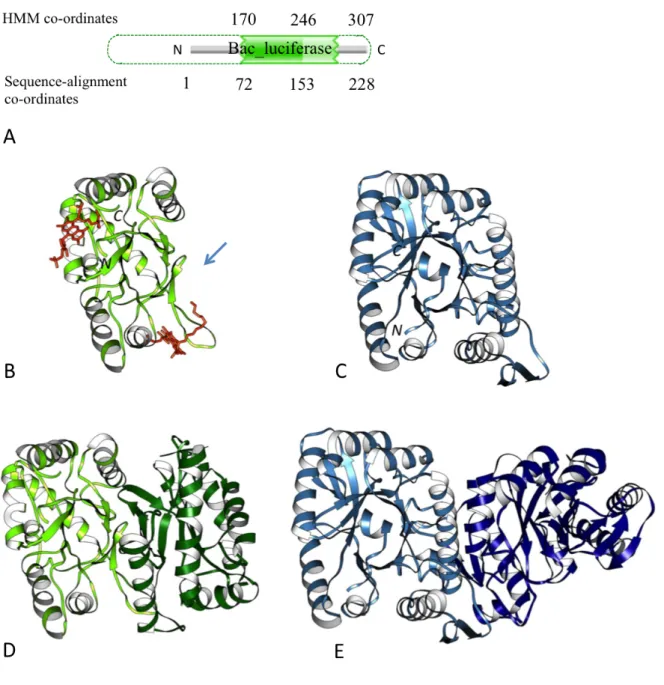
Figure 1.5 N-terminal end-bounded atrophy of bacterial luciferase domain.
(A) Schematic representation of Pfam bacterial luciferase domain (Pfam: PF00296) from P. leiognathi luxF sequence (UniProt: P09142). Numbers at the top indicate ordinates of profile HMM and numbers at the bottom denote co-ordinates of amino acid sequence aligned with the profile HMM. Dotted green lines indicate the missing unmatched region of the profile HMM (B) Monomer of the atrophied bacterial luciferase domain of P. phosphoreum non-fluorescent flavoprotein (PDB: 1FVP, light green) bound to ligand FMA (6-(3-tetradecanoic acid) flavine mononucleotide), orange. Arrow shows the solvent exposed atrophied region. (C) Monomer of the B. cereus reference structure (PDB: 2B81, light blue). (D) Homo-dimer complex of 1FVP. The exposed hydrophobic core due to domain atrophy is stabilised by the new dimer interface. (E) Homo-dimer complex of 2B81 showing dimerisation on the same side of the molecule.
A
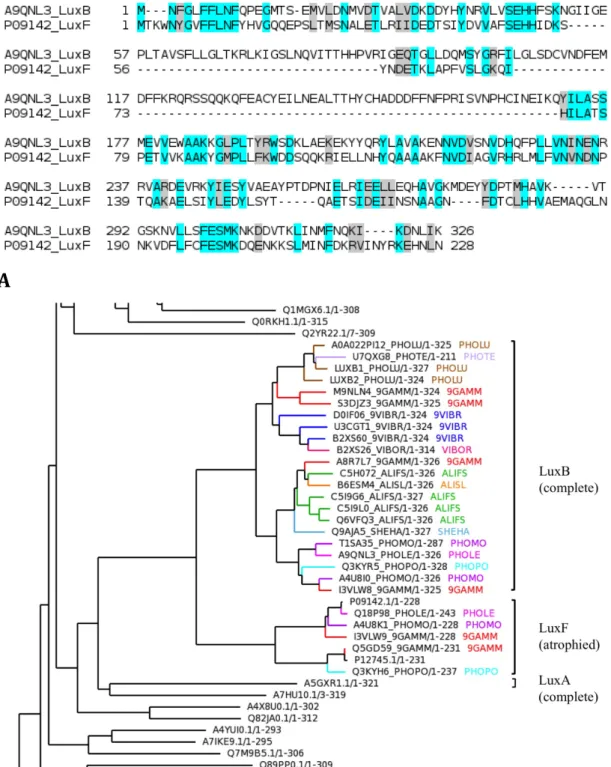
B
Figure 1.6 Pairwise sequence alignments and phylogenetic analysis of the bacterial luciferase domains. (A) The luciferase B subunit protein luxB (UniProt: A9QNL3) is a homologue of luxF. Compared to the homologue, luxF shows deletions of amino acid residues within the domain. (B) The bacterial luciferase, non-fluorescent flavoprotein (LuxF) and the alkanal monooxygenase beta (LuxB) share a common ancestor. The ancestral fold of luciferase is a complete TIM-barrel fold observed in LuxB and LuxA proteins. Figure B reused from (Prakash and Bateman, 2015), doi: 10.1186/s13059-015-0655-8.
The core fold of a domain, during the course of evolution, can embellish secondary structural elements – termed domain elaborations, which is the opposite mechanism of domain atrophy. Therefore, to distinguish domain atrophy from domain elaboration, it is important to determine the phylogenetic relationships between the two variations of domain folds. To determine whether the ancestral fold of bacterial luciferase domains is a complete TIM-barrel fold, I analysed the phylogenetic relation between three clades of the bacterial luciferase family- luxA, luxB and luxF. The luciferase protein is a hetero-dimeric complex of luxA and luxB polypeptide chains (Close et al., 2012) and they both exhibit complete (β/α)8 TIM-barrel fold (Fisher et al., 1996). I observe that the
luxF protein clade is completely enclosed by luxB (Figure 1.6B) and that the ancestral fold must be the complete TIM-barrel fold observed in luxA and luxB proteins.
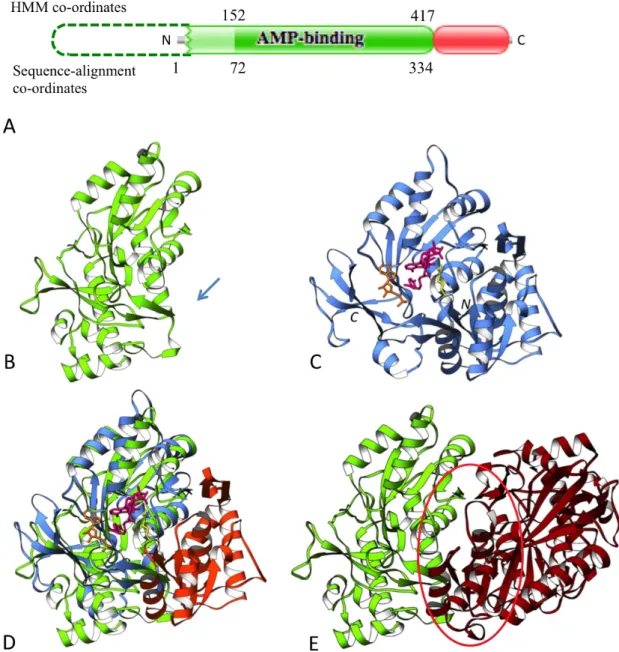
Type example:AMP-binding domain (Pfam: PF00501)
This is the second example of a true domain atrophy event observed at the N-terminal end of the domain. The phenylacetate-coenzymeA ligase, Paak1, from
Burkholderia cenocepacia (UniProt: B4E7B5) is a 432 amino acid residue long protein composed of two domains – the N-terminal AMP-binding domain (Pfam: PF00501) and the AMP-binding C-terminal domain (AMP-binding_C2, Pfam: PF14535). Sequence scan against the Pfam HMM model for this domain family shows that the N-terminal adenosine monophosphate (AMP) binding domain has atrophy at the N-terminus. The AMP-binding C-terminal domain does not show any atrophy.
Figure 1.7A shows a schematic representation of the partial match of the N-terminal AMP-binding domain. The HMM model of the N-N-terminal AMP-binding domain has a length of 417, of which co-ordinates 152 through to 417 align with the domain sequence covering amino acid residues 72 to 334. It should be noted here that the N-terminal region from amino acid 5 to 71 is probabilistically matched to the profile HMM (region coloured in light green, Figure 1.7A), which indicates that the N-terminal domain boundary within this region is not accurate.
Therefore to strictly demarcate the domain boundaries while computing atrophy scores I have used the alignment co-ordinates of protein sequences, rather than their envelope co-ordinates, which results in an atrophy score of 0.19.
Phenylacetate-coenzymeA ligases are adenylate-forming enzymes involved in the metabolism of phenylacetate (Martinez-Blanco et al., 1990). The enzyme links the phosphoryl moiety of AMP to the carboxyl group of the substrate, activating it before transferring to the acceptor CoA (Martinez-Blanco et al., 1990). The full length N-terminal AMP-binding domain of 4-chlorobenzoyl CoA ligase from Alcaligenes sp. (PDB: 3CW9) was used as the reference structure to identify structural loss within the N-terminal AMP-binding domain of B. cenocepacia. The reference N-terminal AMP-binding domain is an α/β structure comprising three distinct β-sheet with a cleft containing the binding pocket (Reger et al., 2008) (Figure 1.7C). Structural comparison of B. cenocepacia N-terminal AMP-binding domain (PDB: 2Y27) with the reference structure 3CW9 indicates that the atrophied N-terminal AMP-binding domain lacks region comprising residues 1 to 150 of the reference structure that forms the first sub-domain (Figure 1.7B, D). It can be seen that the first sub-sub-domain of the reference structure has minimal interactions with the substrates during adenylation and thioester formation process (Reger et al., 2008), therefore the absence of this region in the atrophied N-terminal AMP-binding domain may not have affected its catalytic function. The crystal structure of the B. cenocepacia Paak1, 2Y27, shows the atrophied N-terminal AMP-binding domain in homo-dimeric interactions (Figure 1.7E) (Law and Boulanger, 2011). Interestingly this interaction involving the second sub-domain region (residues 151 to 322) results in the formation of an intramolecular β-sheet at the interface that appears to mimic the structural arrangement of the deleted first sub-domain observed in full-length reference structure (Law and Boulanger, 2011), shown by region circled in red in Figure 1.7E.
Again, similar to the atrophied bacterial luciferase domain discussed above, homo-dimeric interactions are observed to bury the solvent exposed core residues and compensating for the deleted structural region. In addition to the
Figure 1.7 N-terminal end-bounded atrophy of AMP-binding domain. (A) Schematic representation of N-terminal AMP-binding domain (Pfam: PF00501, green) and the AMP-binding C-terminal domain (AMP-binding_C2, Pfam: PF14535, red) of B. cenocepacia phenylacetate-coenzymeA ligase (UniProt: B4E7B5). Sequence region probabilistically matched to the profile HMM is shown in light green. Dashed lines indicate the missing unmatched region of the profile HMM (B) Monomer of the atrophied N-terminal AMP-binding domain (PDB: 2Y27); arrow indicates region of structural loss at the N-terminus. (C) Reference structure of full length N-terminal AMP-binding domain of 4-chlorobenzoyl CoA ligase from Alcaligenes sp. (PDB: 3CW9). (D) Structural superposition of 2Y27 (green) and 3CW9 (blue), the atrophied first sub-domain is shown in orange. (E) Homo-dimer of atrophied domain (PDB: 2Y27) showing structural arrangement (red circle) that mimics the deleted first sub-domain of the reference structure.
atrophy observed in B. cenocepacia phenylacetate-coenzymeA ligase, similar cases of atrophied N-terminal AMP-binding domains were observed in
Bacteroides thetaiotaomicron phenylacetate-coenzymeA ligase (UniProt: Q8AAN6, PDB: 3QOV) and Enterobacter agglomerans phenazine antibiotic biosynthesis protein (UniProt: Q8GPH0, PDB: 3HGU), each with an atrophy score of 0.16.
1.3.2 C-terminal end-bounded atrophy
Type example:Ral-GTPase-activating protein domain (Pfam: PF02145)
The activating protein (RapGAP) domain of rat Ral-GTPase-activating subunit α-1 isoform-1 (UniProt: O55007) was predicted to exhibit atrophy at the C-terminal end of the domain at the sequence end.
The isoform-1 is 747 amino acid residues long with a single RapGAP domain at its C-terminus and no detectable Pfam domains at its N-terminal region. The sequence only aligns to the first 75 match states of the domain profile HMM model, which corresponds to sequence region 650 to 722. The remaining sequence of 25 amino acid residues at the C-terminal, that are not aligned with the profile HMM, is not long enough to be extended further to completely match the missing 113 profile HMM match states (Figure 1.8A). Calculation of the C-terminal atrophy using equation 2 (refer to section 1.2.3) results in an atrophy score of ASC = (113– 25)/188 = 0.46, indicating structural loss of nearly half the
domain.
The GTPase-activating proteins (GAPs) terminate G-protein signalling by inducing hydrolysis of bound GTP to GDP (Bos et al., 2007). The full-length Rap1-GAP catalytic domain of the human Rap1-Rap1-GAP protein (PDB: 3BRW) was used as the reference structure. There are no experimental structures solved of the rat RapGAP domain, therefore, instead of structural superposition I used pairwise sequence alignment and mapped the sequence deletion on to the domain’s homologous structure to infer atrophy of the rat RapGAP domain. Pairwise
Figure 1.8 C-terminal end-bounded atrophy of rat RapGAP domain. (A) Schematic representation of RapGAP domain or rat Ral-GTPase-activating subunit α-1 isoform-1 (UniProt: O55007). Dashed lines indicate Pfam profile HMM model that is not aligned to the sequence. (B) Pairwise sequence alignment of the rat RapGAP and human RapGAP domains. The human RapGAP domain sequence highlighted in green corresponds to that region in the rat RapGAP domain that is matched by the profile HMM and the region highlighted in orange corresponds to that region in the rat RapGAP domain that is absent or atrophied. (C) Sequence mapping from pairwise alignment on to the homologous reference structure in human (PDB: 3BRW) shows the region of rat RapGAP domain that remains (green) and the region of RapGAP domain that is atrophied (orange). The dimerisation domain at the N-terminal is shown in gray and the interacting protein Rap1B is shown in blue. Amino acid residues involved in interactions with Rap1B are shown as gray sticks.
alignment of the rat RapGAP and the human Rap1GAP domain sequences clearly indicates a large deletion at the C-terminal end of the rat RapGAP domain, while showing 30% sequence identity in the aligned region (Figure 1.8B). Sequence mapping of the rat RapGAP domain onto the human Rap1-GAP protein (PDB: 3BRW) indicates structural loss in the catalytic domain (residues 301-414) (Figure 1.8C, orange). The catalytic domain is an α/β structure with mixed parallel/antiparallel arrangement of β-strands and a conserved C-terminal alpha helix and interacts with the Rap1B protein (Scrima et al., 2008). The catalytic centre comprising Asn290 is close to the nucleotide-binding region and the protein interface (Daumke et al., 2004; Scrima et al., 2008). The observed atrophy does not affect the catalytic centre or residues involved in Rap1B interaction, therefore suggesting that the atrophied domain may be functional. Interestingly this domain atrophy is not observed in the other isoforms of rat RapGAP protein. Isoform-2 (906 amino acids) and isoform-3 (2,035 amino acids) have complete full-length RapGAP domains suggesting that exon loss mediated by alternative splicing could be a probable mechanism in mediating atrophy at the C-terminal end of RapGAP domain in isoform-1.
1.3.3 Upstream domain-bounded atrophy
125 cases were initially identified where atrophy was predicted in domain regions that were bounded by an upstream non-homologous domain. After manual inspection none of the identified examples were determined as true cases of domain atrophy, but were failure modes of the pipeline.
1.3.4 Downstream domain-bounded atrophy
Type example: 2-hydroxyacid dehydrogenase, NAD binding domain (2-Hacid_ dh_C) (Pfam: PF02826)
The 2-hydroxyacid dehydrogenase NAD-binding (2-Hacid_dh_C) domain in
the C-terminus of the domain. The domain is found to have nearly a quarter of the canonical structure missing indicated by the atrophy score of 0.23 (Figure 1.9A). The C-terminal end of the 2-Hacid_dh_C domain is bounded by the downstream ATP-grasp domain. Similar atrophy is also observed in the 2-Hacid_dh_C domain of Bacillus anthracis (UniProt: C3PBM5, PDB: 3Q2O). These two cases represent true downstream domain-bounded atrophy events, which are validated by experimental structures.
2-Hacid_dh_C domains are found in dehydrogenases and oxidoreductases in prokaryotes and eukaryotes. The bacterial PurK and PurE proteins are involved in a two-step conversion of 5-aminoimidazole ribonucleotide to 4-carboxy-5-aminoimidazole ribonucleotide (Brugarolas et al., 2011). The crystal structure of
S. aureus 2-Hacid_dh_C domain (PDB: 3ORQ) adopts a partial Rossmann fold and exhibits secondary structural embellishments including an additional alpha helix (α2) and β-strand (β3) (Figure 1.9B) (Brugarolas et al., 2011). The canonical full-length 2-Hacid_dh_C reference structure for comparison was chosen from
Lactobacillus jensenii D-lactate dehydrogenase (PDB: 4PRL), which adopts a Rossmann fold with six parallel β-strands bound to NAD (Figure 1.9C) (Kim et al., 2014).
Superposition of structures of the atrophied domain (3ORQ) and the reference domain (4PRL) indicates a partial loss of secondary structural elements at the C-terminus of 3ORQ. The β-strands β2-β1-β4 of the atrophied domain align with the
strands β2-β1-β3 of the reference domain, respectively, but there are no
equivalent residues in the atrophied domain to match strands β4-β5-β6 of the
reference domain (residues 225-298). Interestingly the atrophy at the C-terminus of the domain does not affect the ligand-binding site at the N-C-terminus. The atrophied domain retains the ‘reverse’ Rossmann fold motif (GXXGXG) in the loop connecting β1 and α1 of the atrophied domain. I observe that the
binding-motif and interaction sites within the atrophied and the reference domain are conserved and present at structurally equivalent locations (3ORQ; residues: 16-21, 38-41 and 4PRL; residues: 153-158, 175-178). The presence of the conserved binding motif suggests that the atrophied domain might bind to the adenine
Figure 1.9 Downstream domain-bounded atrophy of 2-Hacid_dh_C domain.
(A) Schematic representation of domain architecture in Staphylococcus aureus
PurK (UniProt: A6QFS4). Atrophy at the C-terminal region of 2-Hacid_dh_C domain (green) is indicated by dashed lines. (B) Crystal structure of the atrophied S. aureus 2-Hacid_dh_C domain (PDB: 3ORQ). Arrow indicates region of structural loss at the C-terminus. (C) The complete reference structure of L. jensenii 2-Hacid_dh_C domain (PDB: 4PRL). The conserved NAD (yellow stick) binding ‘reverse’ Rossmann motifs in atrophied and reference domains are highlighted in dark pink and light pink respectively. (D) Superposition shows the structural elements of 4PRL, highlighted in orange, that are atrophied in 3ORQ.
moiety, however, other important residues at the C-terminus of the reference domain such as Asp259 and the catalytically important His295 located near the nicotinamide moiety are absent (Kim et al., 2014; Tishkov et al., 1996).
Type example: RNase_E_G domain (Pfam: PF10150)
The RNase_E_G domain is an example of a putative downstream domain-bounded atrophy, for which structural loss was inferred through sequence mapping onto a homologous structure. The RNase E domain of Pyrococcus furiosus RNA-binding protein AU-1 was identified with atrophy at the C-terminus indicated by an atrophy score of 0.19.
The P. furiosus RNA-binding protein AU-1 (UniProt: Q8U4Q7) is 469 amino acid residues long and consists of the RNase_E_G domain (Pfam: PF10150; Figure 1.10A, green) and the domain of unknown function DUF402 (Pfam: PF04167; Figure 1.10A, red) at the C-terminus. The RNA-binding protein is a large oligomeric complex that binds specifically to AU-rich RNA sequences and involved in RNA metabolic processes (Kanai et al., 2003).
The N-terminal region of the profile HMM matches the P. furiosus RNase_E_G domain from amino acid residues 150 to 264. The sequence region between the domains (residues 265 to 369) is poorly matched by the RNase_E_G profile HMM; but although poorly matched this region can still be part of the RNase_E_G domain suggesting that the maximum size the RNase_E_G domain within this sequence could have is from residues 150 to 369. Therefore I have extended the RNase_E_G domain boundary till the amino acid residue 369 to include sequences that were missed by the profile HMM. Pairwise sequence alignment of the extended P. furiosus RNase_E_G domain (amino acid residues 150 to 369) with the E. coli RNase_E_G reference domain (UniProt: P21513; PDB: 2C0B, amino acid residues 121 to 391) shows sequence loss at the C-terminal end of the P. furiosus RNase_E_G domain (Figure 1.10B) indicating that despite extending the domain boundary the RNase_E_G domain is atrophied at the C-terminal end.
C
Figure 1.10 Downstream domain-bounded atrophy of RNase_E_G domain.
(A) Schematic representation of RNase_E_G domain from P. furiosus RNA-binding protein AU-1 (UniProt: Q8U4Q7) with RNase_E_G domain (green) and DUF402 (red). Dotted lines denote the missing region from the C-terminal of the domain. (B) Pairwise sequence alignment showing sequence within the E. coli reference domain that is deleted (orange) in the P. furiosus RNase_E_G domain. (C) Sequence mapping on to the structure of E. coli RNase_E_G (PDB: 2C0B) shows structural elements that are lost in P. furiosus RNase_E_G domain, highlighted in orange. Single strand RNA is shown in blue, and active site residues are show as gray sticks.
The E. coli RNase_E_G domain (PDB: 2C0B) is a large multi-domain structure consisting of S1, 5’ sensing region, RNase H and DNase I subdomains (Callaghan et al., 2005). The DNase I subdomain is the catalytic centre of the complex and is made of two α-helices and six antiparallel β-strands in the order β1-2-3-4-6-5. The
active site residues Asp303 and Asp346, present on β3 and β4 respectively,
co-ordinate a Magnesium ion, which cleaves the scissile phosphate on the RNA backbone through nucleophilic attack (Callaghan et al., 2005). Sequence mapping shows the region of atrophy in the C-terminus of the DNase I subdomain (residues 339 to 393) (Figure 1.10C, orange), with which the atrophied domain shares 21% sequence identity. The atrophied domain region as seen from sequence mapping shows loss of one of the active site residue Asp346. The P. furiosus RNA-binding protein AU-1 is a homo-oligomer trimeric complex (Kanai et al., 2003). Since the experimental structure of the atrophied domain is not available, I hypothesize that the interactions with the C-terminal domain, DUF402 might stabilise the atrophied domain within the trimeric complex.
1.3.5 Within-domain atrophy
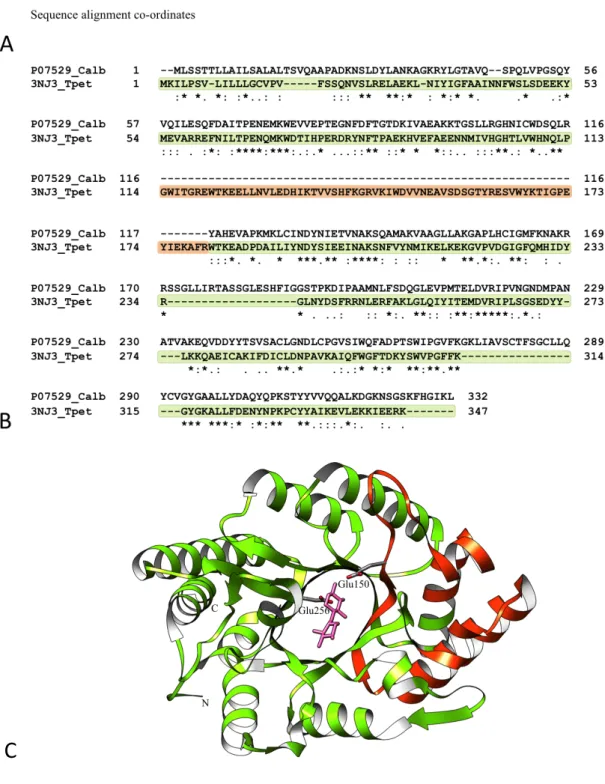
Type example: Glycosyl hydrolase family 10 (Pfam: PF00331)
The glycosyl hydrolase family 10 (Glyco_hydro_10) domain from the endo-1,4-beta-xylanase (UniProt: P07529) of Cryptococcus albidus was identified with atrophy within the domain interior.
The endo-1,4-beta-xylanase protein is 332 amino acid residues long made of a single glyco_hydro_10 domain. Xylanase are found in bacteria, fungi and other microbes (Beg et al., 2001; Polizeli et al., 2005), which degrade hemicellulose by breaking down beta-1,4-xylan into xylose. The C. albidus endo-1,4-beta-xylanase is an inducible extracellular enzyme with xylobiose as its natural inducer (Biely et al., 1980). Sequence scan of C. albidus endo-1,4-beta-xylanase against the profile HMM of the glyco_hydro_10 domain family matches the full-length sequence except at the amino acid residues 115 and 116, wherein the match state co-ordinates 85 to 162 of the profile HMM are not found, indicating
deletion of sequences from within the domain (Figure 1.11A). Using eq