Page 1 of 1
FedUni ResearchOnline
https://researchonline.federation.edu.au
Copyright NoticeThis is the post-peer-review, pre-copyedit version of an article published in Database Systems for Advanced Applications. The final authenticated version is available online at:
https://doi.org/10.1007/978-3-030-18576-3_6
Copyright © 2019, Springer Science+Business Media, LLC, part of Springer Nature.
PU-Shapelets: Towards Pattern-based Positive
Unlabeled Classification of Time Series
Shen Liang1,2, Yanchun Zhang2,3(), and Jiangang Ma4
1
Fudan University, China,
2
Cyberspace Institute of Advanced Technology (CIAT), Guangzhou University, China
3 Victoria University, Australia,
4 School of Science, Engineering and Information Technology,
Federation University Australia
Abstract. Real-world time series classification applications often involve positive unlabeled (PU) training data, where there are only a small setP Lof positive labeled examples and a large setU of unlabeled ones. Most existing time series PU classification methods utilize all readings in the time series, makeing them sensitive to non-characteristic readings. Characteristic patterns named shapelets present a promising solution to this problem, yet discovering shapelets under PU settings is not easy. In this paper, we take on the challenging task of shapelet discovery with PU data. We propose a novel pattern ensemble technique utilizing both characteristic and non-characteristic patterns to rank U
examples by their possibility of being positive. We also present a novel stopping criterion to estimate the number of positive examples in U. These enable us to effectively label allU training examples and conduct supervised shapelet discovery. The shapelets are then applied to online classification. Extensive experiments demonstrate the effectiveness of our method.
Keywords: time series, shapelets, positive unlabeled classification
1
Introduction
Time series classification (TSC) is an important research topic with applications to medicine [3,9], biology [4], electronics [17], etc. Conventional TSC [2] tasks are fully supervised. However, real-world TSC problems often fall into the category of positive unlabeled (PU) classification[8]. In such cases, only a small set
This work is funded by NSFC grants 61672161 and 61332013. We sincerely thank Dr Nurjahan Begum and Dr Anthony Bagnall for granting us access to the code of [3] and [7], all data contributors of [5], and all our colleagues who have contributed their valuable suggestions to this work.
P L of positive and labeled training examples and a large set U of unlabeled ones are available to help distinguish between two classes1. For example, in heartbeat classification for medical care, we may need to train a classifier based on a limited number of abnormal heartbeats and a large number of unlabeled (normal or abnormal) ones [3]. To the best of our knowledge, no conventional supervised TSC methods can be applied to such cases where only one class is labeled, thus specialized PU classification methods are required.
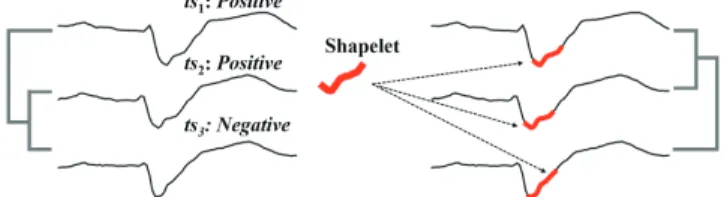
Most existing PU classification methods for time series [17,13,4,3,16,6] are whole-stream based, utilizing all readings in the training examples. This makes them sensitive to non-characteristic readings [19,15]. One effective solution to this problem is time series shapelets [18,10,7,19,15], which are characteristic patterns2 that can effectively distinguish between different classes. For instance, consider three electrocardiography time series from the
TwoLeadECG dataset [5]. Under whole-stream matching (Fig. 1 left) with the highly effective [4] DTW distance [13,16,6],ts2 is incorrectly deemed to be more similar tots3thants1. In contrast, with a shapelet (Fig.1right), we can obtain its best matching subsequence in each time series, and uncover the correct link.
Fig. 1.A comparison of whole-stream based and shapelet-based methods. While the former incorrectly linksts2 withts3(left), the latter uncovers the correct link (right).
In this paper, we undertake the task of shapelet discovery with PU data. To the best of our knowledge, no previous work deals with this problem. Note that existing shapelet discovery methods [18,10,7,19,15] cannot be directly transferred to PU settings. Concretely, a classic framework [18,19] of shapelet discovery is to extract a pool of subsequences as shapelet candidates, rank them with an evaluation metric, and select the top-ranking ones as shapelets. For the choice of the evaluation metric, supervised metrics [18,10,7] can effectively discover high-quality shapelets. However, they need labeled examples from both classes, while under PU settings, only one class is (partly) labeled. An unsupervised
evaluation metric [19,15] aims to maximize the inter-class gap and minimize the intra-class variance, yet this rationale often fails to hold, which is likely due to
1
The termpositive unlabeled can be confusing, wherepositive actually meanspositive labeled. In this paper, we still usepositive unlabeled (PU) to refer to what is actually
positive-labeled unlabeled. However, in other cases, we usepositive/negative to refer to all positive/negative examples, regardless of whether they are labeled or not. Positive examples that are labeled will be explicitly referred to as beingpositive labeled (PL).
2
Fig. 2.The workflow of our PU-Shapelets (PUSh) Algorithm.
the typically noisy and high-dimensional nature of time series, and the sparsity of small datasets.
Faced with the difficulties of directly applying existing shapelet discovery methods, we propose our novel PU-Shapelets (PUSh) algorithm. To be specific, we opt to first label the unlabeled (U) examples, thus obtaining a fully labeled training set. This enables us to conduct supervised shapelet discovery. To label theU examples, we present a novelPattern Ensemble (PE) technique that iteratively ranks all U examples by their possibility of being positive. PE utilizes bothpotentiallycharacteristic andpotentiallynon-characteristic shapelet candidates, without the need to know their actual quality. We then develop a novel Average Shapelet Precision Maximization (ASPM) stopping criterion. Based on a novel concept calledshapelet precision, ASPM determines the point where the PE iterations should stop [17,13,4,3,16,6]. All U examples ranked before and at this point are labeled as being positive and the rest are considered negative. ASPM is essentially an estimation of the number of positive examples in U. Having labeled the entire training set, we select the shapelets with the supervised evaluation metric ofinformation gain[18,10]. The discovered shapelets are used to build a nearest-neighbor classifier for online classification. The complete workflow of PUSh is shown in Fig.2.
Our main contributions in the paper are as follows.
– We present PU-Shapelets (PUSh), which addresses the challenging task of discovering time series shapelets [18,10,7,19,15] with positive unlabeled (PU) data. As far as we know, this is the first time this task has been undertaken.
– We develop a novel Pattern Ensemble (PE) technique to iteratively rank the unlabeled (U) examples by their possibility of being positive. PE effectively utilizes both potentially characteristic and potentially non-characteristic patterns, without the need to know theiractual quality.
– We present a novel Average Shapelet Precision Maximization (ASPM) stopping criterion. Based on a novel concept called shapelet precision, ASPM can effectively estimate the number of positive examples in
Uand determine when to stop the PE iterations. We combine PE and ASPM to label allU examples. We then conduct supervised shapelet selection and build a nearest-neighbor classifier for online classification.
– We conduct extensive experiments to demonstrate the effectiveness of our PUSh method.
The rest of the paper is organized as follows. Section 2 introduces the preliminaries. Section 3 presents our PUSh algorithm. Section 4 reports the experimental results. Section5reviews the related work. Section6concludes the paper.
2
Preliminaries
We now formally define several important concepts used in this paper. We begin with the concept of positive unlabeled classification [8].
Definition 1. Positive unlabeled (PU) classification.Given a training set with a (small) setP Lof positive labeled examples and a (large) setU of unlabeled examples, the task of positive unlabeled (PU) classification is to train a classifier with P andU and apply it to predicting the class of future examples.
We move on to the definitions of time series and subsequence.
Definition 2. Time series and subsequence. A time series is a sequence of real values in timestamp ascending order. For a length-L time series T =
t1, . . . , tL, a subsequence S of T is a sequence of contiguous data points in T.
The length-l (l ≤ L) subsequence that begins with the p-th data point in T is written as S=tp, . . . , tp+l−1.
We then introduce the concept of subsequence matching distance (SMD).
Definition 3. Subsequence matching distance (SMD). For a length-l subsequence Q = q1, . . . , ql and a length-L time series T = t1, . . . , tL, the
subsequence matching distance (SMD) between Q and T is the minimum distance between Q and all length-l subsequences of T under some distance measure D, i.e.SM D(Q, T) =min{D(Q, S)|S=tp, . . . , tp+l−1,∀p,1≤p≤L−l+ 1}.
For the choice of the distance measure, we apply the length-normalized Euclidean distance [10], which is the Euclidean distance between two equal-length subsequences divided by the square root of the equal-length of the subsequences.
We now formally define the concept of orderline [18,10,19,15]
Definition 4. Orderline. Given a subsequence S and a time series dataset
DS, the corresponding orderline OS is a sorted vector of SMDs betweenS and
all time series inDS.
We conclude with the definition of time series shapelets.
Definition 5. Time series shapelets.Given a set DS of training time series, time series shapelets are characteristic subsequences that can distinguish between different classes in DS. Concretely, given a shapelet candidate set CS consisting of subsequences extracted from time series in DS, let m be the desired number of shapelets. Time series shapelets are the top-m ranking subsequences in CS under some evaluation matric E. E indicates how well separated different classes are on the orderline of a shapelet candidate.
3
The PU-Shapelets Algorithm
We now present our PU-Shapelets (PUSh) algorithm. Following the workflow shown in Fig. 2, we will first elaborate on how to label the unlabeled (U) set, and then introduce the shapelet selection and classifier construction processes.
3.1 Labeling U Examples
We now introduce the process of labelingU examples. Our first step is to obtain a pool of patterns as shapelet candidates, which will also be useful when labeling theUset. Concretely, we set a range of possible shapelet lengths. For each length
l, we apply a length-l sliding window to each training time series (regardless of whether it is labeled or not), extracting all length-l subsequences in the training set and adding them to the candidate pool. The final pool of shapelet candidates is obtained when all possible lengths are exhausted [18,10,7,19,15].
Having obtained all shapelet candidates, we now move on to labeling theU
set. This is typically achieved by first rank theU examples by their possibility of being positive, and then estimate the number npu of positive examples in
U [17,13,4,3,16,6,11,12], thus the top-ranking npu examples inU are labeled as being positive and the rest are labeled as being negative. This workflow has been illustrated in Fig. 2. We now separately discuss how to rank the U examples, and how to estimate the number of positive examples.
Ranking U examples with Pattern Ensemble (PE) We first discuss ranking the U examples. Previous works [17,13,4,3,16,6] have adopted the
propagating one-nearest-neighbor (P-1NN) algorithm [21]. P-1NN works in an iterative fashion. In each iteration, the nearest neighbor of the positive labeled (P L) set in the unlabeled (U) set is moved fromU toP L. The nearest neighbor of P L in U is defined as the U example with the minimum nearest neighbor distance to P L, i.e.
N N(P L, U) = arg min{N N Dist(u, P L)|u∈U} (1) The iterations go on until U is exhausted. The order by which theU examples are added intoP Lis their rankings.
The problem with previous works is that when obtaining the nearest neighbors, they calculate the distances between entire time series, utilizing all the readings. This makes them susceptible to non-characteristic readings. In contrast, we attempt to actively minimize the interference from non-characteristic shapelet candidates. However, as was discussed in Section 1, no existing evaluation metric can effectively estimate the qualities of the candidates under PU settings. Without such prior knowledge, which candidates should we rely on? The answer is surprisingly simple:All of them.
Fig. 3.The workflow of pattern ensemble (PE).
To be specific, we develop the followingPattern Ensemble (PE)technique, whose workflow is shown in Fig. 3. PE adopts a similar iterative process
as P-1NN. However, in each iteration of PE, we let each shapelet candidate individually identify the nearest neighbor of P Lin U on its orderline (Fig.4), and vote for it. TheU example receiving the most votes is moved to P L. The iterations stop when U is exhausted, and the order by which U examples are moved toP Lis their rankings.
Fig. 4.An illustration of finding the nearest neighbor ofP LinU on an orderline.
At first glance, PE seems highly unlikely to perform well, especially when the number of non-characteristic patterns significantly exceeds that of characteristic ones. However, note that in many cases, while the non-characteristic patterns do not significantly favor the positive set, they are not significantly biased to the negative set either. This is because non-characteristic readings exist not only in negative examples, but also positive ones. As a result, various non-characteristic patterns can vote for both negative and positive examples, thus cancelling out the effect of each other. On the other hand, the characteristic patterns strongly favor the positive class, ensuring that an actual positive example wins the vote. This effect is illustrated in Fig.5.
Fig. 5.An illustration of the rationale of pattern ensemble. HereP Lcontains only one example. While the votes from non-characteristic patterns cancel each other out, the characteristic patterns ensure the correct example is chosen.
Compared with previous works [17,13,4,3,16,6], our method also utilizes potentially non-characteristic readings. The critical difference is that for each time series, our method exploitsmultiple patterns. In contrast, previous works utilizeonly onepattern (i.e. the entire time series itself). This means the negative effect of one non-characteristic pattern cannot be cancelled out by the positive effect of another, making previous works less robust than our method.
The complete process of ranking U examples with PE is illustrated in Algorithm 1. To begin with, we cache the number of initial positive labeled examples (line 1), then iteratively take the following steps until U is exhausted (line 2): We first initiate a vote counter (line 3; note that among the|P L|+|U|
indices, only|U|are valid. The others are simply used to avoid index mapping.). Then, we let every shapelet candidate S (line 4) identify the nearest neighbor
Algorithm 1: PatternEnsemble(P L,U,CS)
Input : initial positive labeled examplesP L, initial unlabeled examplesU, shapelet candidate poolCS
Output:U example rankingsR(by theU examples’ possibilities of being positive) 1 np0=|P L|; 2 whileU̸=∅do 3 votes=zeros(1,|P L|+|U|); 4 foreachS∈CS do 5 us= FindNN(P L,U,S); 6 votes(us) + +;
7 nextP =argmax(votes);
8 P L= [P L, nextP];U =U\ {nextP};
9 R=P L(np0+ 1 :end);
10 returnR;
receiving the most votes (line 7) is moved to P L(line 8). The order by which theU examples are added intoP Lis their rankings. (lines 9-10).
The Average Shapelet Precision Maximization (ASPM) Stopping Criterion With the U examples ranked, we can now move on to estimating the number npu of positive examples in U. Note that for iterative algorithms such as the aforementioned P-1NN [21] and our PE, estimatingnpuis essentially finding a stopping criterionto decide when to stop the iterations. All examples ranked before and at the stopping point is labeled as being positive, and the rest are considered negative. Previous works [17,13,3,16,6] have proposed several stopping criteria for whole-stream based P-1NN algorithms. However, these methods are susceptible to interference from non-characteristic readings, and some [17,13,6] are incompatible with our PE technique.
In light of these drawbacks, we present a brand new stopping criterion tailored to our PE technique. We first introduce the novel concept ofshapelet precision. In a certain iteration of PE, for the currentP Lset and a patternS, letLS and
RS be the sets of the leftmost and rightmost|P L|examples on the orderline of
S. The shapelet precision (SP) ofS with respect toP Lis
SPSP L= max(|P L∩LS|,|P L∩RS|)
|P L| (2)
Fig.6provides an illustration of shapelet precision.
Note that SP is derived from the concept of precision in the classification literature. Essentially, we ”classify” the leftmost (or rightmost) |P L|examples on the orderline as being positive, and evaluate the ”classification” performance with SP. Intuitively, at the best stopping point whereP Lis most similar to the
Fig. 6.An illustration of shapelet precision.
the top shapelet candidates should be the highest. Based on this intuition, we develop the followingAverage Shapelet Precision Maximization (ASPM)
stopping criterion, whose workflow is illustrated in Fig.7.
Fig. 7. The workflow of the Average Shapelet Precision Maximization (ASPM) stopping criterion.
To be specific, after each iteration of PE (lines 3-10 of Algorithm 1), we select the top-k assumed shapelets (rather than actual shapelets, since we do not know if they are actually the final shapelets yet) with the highest SP values and calculate their ASP score. Each iteration with the highest ASP value is considered to be apotential stopping iteration (PSI).
To break the ties between multiple PSIs with a same ASP value, we consider theirgaps. Suppose iterationsi and j (i < j) are two consecutive PSIs (i.e. all iterations between them, if any, are non-PSIs with lower ASP scores), their gap is defined as
gap(i, j) = {
j−i−1, ifj−i−1>1
0, otherwise (3)
Essentially, the gap between i andj is the number of non-PSIs between them. If the gap is 1, we consider it accidental and reset the gap to 0.
After getting all gaps, we set a gap threshold gT h that equals half the maximum gap between consecutive PSIs (except when the maximum gap is 0, where gT h is set to a random positive value). We find the first ”large” gap gap0 ≥ gT h. Under the assumption that the positive class is relatively compact while the negative class can be diverse [4], gap0 indicates a decision boundary between the positive and negative classes. Later ”large” gaps may indicate boundaries between sub-classes of the negative class. Atgap0, we select the final stopping point in one of three cases (Fig.8).
1. Nogap0 exists (namely the maximum gap is 0). Here we select the last PSI as the stopping point. The rationale is that on the orderlines of multiple
assumedshapelets, the rankings of the negative examples are too diverse to yield a high ASP score, thus all PSIs correspond to the positive class.
2. Neither of the PSIs ibeforegap0 andj after gap0is isolated (we say a PSI is isolated if there are no PSIs before and after it within the range ofgT h). Here we selecti as the stopping point. The rationale is that in the last few iterations beforei, the rankings of the remaining positive unlabeled examples are relatively uniform on multiple orderlines, resulting in high ASPs before and ati. Similarly, the rankings of the first few negative unlabeled examples are relatively uniform, resulting in high ASPs at and afterj.
3. At least one of i and j is isolated. Here we selectj as the stopping point. Empirically, if i is isolated, i being a P SI is more likely a coincidence. If
j is isolated, it is more likely that on multiple orderlines, the rankings are diverse for both the last few positive unlabeled examples (betweeniandj) and the first few negative unlabeled examples (afterj), yet a clear decision boundary between the positive and negative classes is atj, resulting in an isolated point with a high ASP score.
Fig. 8.Different strategies of stopping point selection in the three cases of ASPM.
To determine the number ofassumed shapeletsk, we set a largest allowed value maxK and examine all k ∈ [1, maxK]. We find the stopping point for eachkand pick the one with the maximumgap0. Ties are broken by picking the one with the latest stop. This reduces the risk of false negatives, which is more troublesome than false positives in applications such as anomaly detection in medical care. Also, to prevent too early or too late a stop, we pre-set the lower and upper bounds of the stopping point. Note that we usually only need loose bounds to yield satisfactory performance, which are relatively easy to estimate in real applications.
Our ASPM stopping criterion is illustrated in Algorithm2. After initiation (line 1), we examine each possible number kofassumed shapelets (line 2). We first calculate the ASP values for all iterations (lines 3-6), and then obtain the PSIs (line 7). Next, we obtain the gap threshold gT h (line 8) and gap0 along with the two PSIs before and after it (line 9). We then select the stopping point for the currentk (lines 10-12), and update the best-so-far stopping point if the currentkis the better than previous ones (lines 13-14). The best stopping point is obtained after examining all kvalues (line 15).
Having obtained the stopping point, we label allU examples ranked before and at it as being positive and the rest as being negative. The newly labeledU
Algorithm 2: ASPM(R, CS,lb,ub,maxK)
Input : theU example rankingsR, the shapelet candidate poolCS, the lower and upper bounds of the stopping pointlbandub, the maximum number ofassumed shapeletsmaxK
Output: the stopping pointbestStop 1 bestStop= INF;maxGap0 =−INF;
2 fork= 1 :maxK do 3 aspList= [];
4 foriter= 1 :|R|do
5 asp= getAvgShapeletPrecision(CS,R,iter,k);
6 aspList= [aspList, asp];
7 psiList= getPotentialStopIter(aspList,lb,ub); 8 maxGap= getMaxGap(psiList);gT h=⌈maxGap/2⌉;
9 [gap0, i, j] = getGap0(psiList,gT h);
10 if gap0 == 0thenstop=psiList(end);
11 else if !(isIsolated(i)||isIsolated(j))thenstop=i;
12 elsestop=j;
13 if maxGap0< gap0thenmaxGap0 =gap0;bestStop=stop;
14 else if maxGap0 ==gap0 &&bestStop < stopthenbestStop=stop;
15 returnbestStop;
3.2 Selecting the Shapelets and Building the Classifier
With a fully labeled training set, we can now select the shapelets using a supervised evaluation metric [18,10,7]. Concretely, we adopt the classic [18]
information gainmetric [18,10] to rank and select the top-mshapelet candidates as the final shapelets. Next, we conduct feature extraction with the shapelets. To be specific, we represent each training time series with anm-dimensional feature vector in which each value is the SMD between the time series and one of the shapelets. This representation is called shapelet transformed representation [7]. The feature vectors are used to train a one-nearest-neighbor classifier. To classify a future time series, we obtain its shapelet transformed representation and assign to it the label of its nearest neighbor in the training set.
4
Experiments
For experiments, we use 21 datasets from [5]. For brevity, we omit further description of the datasets. The names of the datasets will be presented along with the experimental results, and their detailed information can be found on [5]. All datasets have been separated into training and test sets by the original contributors [5]. We designate examples with the label ”1” in each dataset as being positive, and all others as being negative. Let the number of positive training examples in each dataset benp, For datasets withnp≥10, we randomly generate 10 initialP Lsets for each dataset, each containing 10% of all positive
training examples. For datasets with np <10, we generatenp initial P Lsets, each containing one positive training example. All experimental results are averaged over the 10 (ornp) runs.
Our baseline methods come from [17,13,4,3,6]. Like our PUSh method, they also label the U examples by first ranking them, and then find a stopping criterion. To rank theU examples, the baselines utilize the P-1NN algorithm [21] (see Section3.1) on the original time series with one of three distance measures: Euclidean distance (ED) [17,3], [4] DTW [13,6], and DTW-D [4]. As to stopping criteria, our baselines utilize eight stopping criteria: W [17], R [13],
B[3] andG1-G5[6] which are a family of five stopping criteria. Note that the description of criterion W in [17] is insufficient for us to accurately implement it. Luckily, another criterion is implicitly used by [17], which is the one we use. To make up for not testing the former, we first find a stopping point using the latter and then examine all iterations before and at this point, reporting only the best performance achieved. Also, criterion B [3] only supports initialP Lsets with a single example. For initial P Lsets with multiple examples, we use each example to individually find a stopping point and pick the one with the minimum RDL value (RDL is a metric used in [3] to determine the stopping point). In our experiments, we compare PUSh (i.e. PE+ASPM) against the combination of each of the threeU example ranking methods with each of the eight stopping criteria, resulting in a total of 24 baseline methods. For all 25 methods being compared, we label all U examples before and at the stopping point as being positive, and the rest as being negative. The fully labeled training set is used for one-nearest-neighbor classification.
For parameter settings, we set the range of possible shapelet lengths to 10 : (L−10)/10 :L, whereLis the time series length. For Algorithm 2, we set the lower bound lbto 5 if the number of positive examples np ≥10. Otherwise, it is set to 1 which is essentially no lower bound at all. The upper bound ub is set ton×2/3−np0, wherenis the total number of training examples and np0 is the size of the initial P L set. This means we assume that the positive class makes up no more than two thirds of all training data. Again, we stress that these settings are usually loose bounds than can be estimated relatively easily. For fairness, we apply the same lower and upper bounds to our baselines. The maximum number of assumed shapelets maxK is set to 200. The number of final shapeletsmis set to 10. As we will show later, our method is not sensitive to m. For DTW and DTW-D, we set the DTW warping windows as the values recommended by [5], including the setting of no warping window. If the setting on [5] is 0, DTW is reduced to ED and DTW-D is ineffective. In such cases, we set the warping windows to 1%, 2%, . . . , 10% of the time series length L, and only report the best results. The parameters cardinality andβ for criteria B [3] and G1-G5 [6] are set to 16 and 0.3 as suggested by the original authors.
For reproducibility, our source code can be found at [1]. All experiments were run on a laptop computer with Intel Core i7-4710HQ @2.50GHz CPU, NVIDIA GTX850M graphics card (GPU acceleration was used to speed up DTW computation [14]), 12GB memory and Windows 10 operating system.
4.1 Performance of Labeling the U examples
We first look into the performance of labeling the U set. Note that this can be seen as classifying the U set, thus we can apply an evaluation metric for classification. Here we adopt the widely used [13,11,12,16,6]F1-score, which is defined asF1 = 2×precision×recall /(precision+recall).
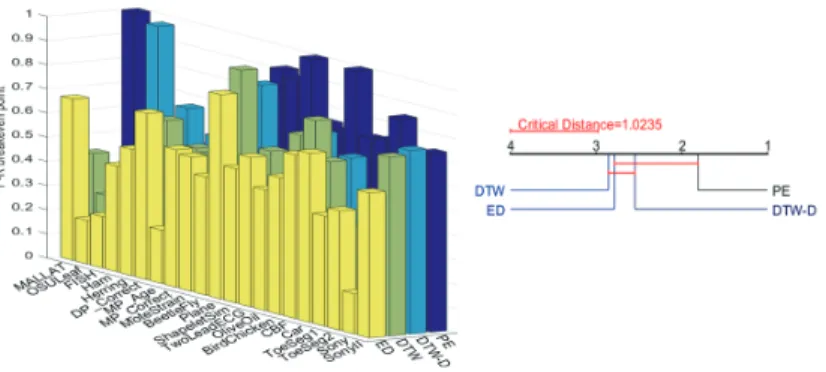
Fig. 9.Performances of ranking theU examples (disregarding the stopping criteria).
left) Precision-recall breakeven points. right) Critical difference diagram for all four methods. PE outperforms all baseline methods and significantly outperforms DTW.
We first evaluate the performance of PE. In this case, we need to disregard the effect of the stopping criterion. Therefore, we assume the actual number of positive examples np is known, and the stopping point is where there are
np examples in P L. At this point, precision, recall and F1-score share the same value, which is called precision-recall (P-R) breakeven point [17]. The P-R breakeven points for all methods are illustrated in Fig. 9. There are no significant differences among the performances of the three baseline methods. Our PE outperforms all baselines and significantly outperforms DTW.
Fig. 10.Performances of labeling theUset (taking into account the stopping criteria).
left)F1-scores.right)Critical difference diagram for PUSh (PE+ASPM) and the top-10 baselines. PUSh significantly outperforms the others.
We then take the stopping criteria into account. The F1-scores at the stopping points are shown in Fig.10. Among the top-10 baselines, no significant
difference in performance is observed. Most top ranking baselines utilize one of G1-G5. Their high performances is likely due to G1-G5’s abilities to take into account long term trends in minimum nearest neighbor distances [6]. Our PUSh (PE+ASPM) significantly outperforms the top-10 baselines.
4.2 Performance of Online Classification
We now move on to classification performance. Once again we use the F1-score for evaluation. We need to first set the number of shapeletsmfor our PUSh. We have setm= 10 : 10 : 50 and performed pairwise Wilcoxon signed rank test on the performances of PUSh under these settings. The minimump-value is 0.0766. With 0.05 as the significance threshold, there are no significant differences among these settings. We set mto 10 for shorter running time.
Fig. 11. Online classification performances. left) F1-scores. right) Critical difference diagram for PUSh (PE+ASPM) and the top-10 baselines. PUSh is as competitive as DTWD-R and significantly outperforms the others.
The classification performances are shown in Fig.11. Not surprisingly, most of the top ranking methods in theU example labeling process (Fig.10) remain highly competitive. This is because for online classification, the labels of the training examples are the labels obtained from theU example labeling process,
not theactuallabels (which are unknown forU). Therefore the performance of labeling U directly affects the classification performance. While no significant difference is observed among the top-10 baselines, our PUSh (PE+ASPM) significantly outperforms nine of them and is as competitive as DTWD-R.
4.3 Running Time
We now look into the efficiency aspect of PUSh. For the training step (from labeling theU examples to building the classifier, see Fig.2), the computational bottlenecks are obtaining the orderlines and calculating the shapelet precisions. Let the number of training examples be N and the length of the time series be L, there are O(N L) shapelet candidates. For each candidate, the amortized
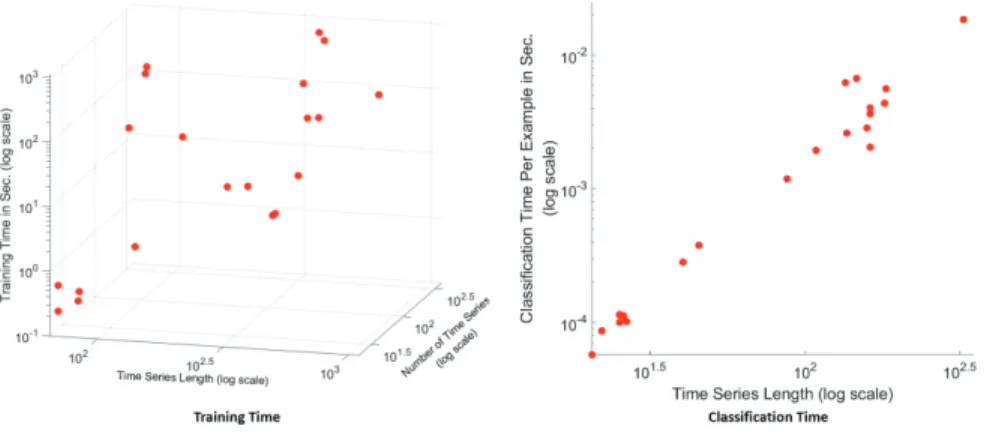
time to obtain its orderline is O(N L) using the fast algorithm proposed by [10], and the time to calculate its SP values in all iterations is O(N2), thus the total time is O(N2L2) + O(N3L). As is shown in Fig.12(left), despite the relatively high time complexity, PUSh is able to achieve reasonable running time, with the longest average running time less than 1100 seconds.
Fig. 12.Running time of PUSh. Note that all axes are in log scale.left)Training time.
right)Online classification time per example.
For online classification, the bottleneck is to obtain the shapelet transformed representation [7] (see Section 3.2), whose time is O(L2) per test example. As is shown in Fig. 12 (right), for time series lengths in the order of 102 to 102.5 (which is typical in applications such as heartbeat classification [3] in medicine), the time is in the order of 10−3to 10−2seconds, which is sufficient for real-time processing.
5
Related Work
PU classification of time series [17,13,4,3,16,6,11,12] is a relatively less well-studied task in time series mining. Most existing works [17,13,4,3,16,6] are whole-stream based propagating one-nearest-neighbor [21] algorithms which tend to be sensitive to non-characteristic readings [19,15]. [11,12] selects local features from time series. However, the selected features are discrete readings
that do not necessarily formcontinuous patterns, while the latter often contains valuable information on the trend of the data. In this work, we explicitly discover characteristic patterns called shapelets, which have been applied to supervised classification [18,10,7] and clustering [19,15,20]. Previous works utilize both supervised [18,10,7] and unsupervised evaluation [19,15] metrics to assess shapelet candidates. However, both are not directly suitable for PU settings. Therefore we opt to first label theU set and then conduct supervised shapelet discovery.
Most previous works on PU classification of time series [17,13,4,3,16,6] iteratively rank theU examples by their possibility of being positive. A stopping criterion is needed to determine where to stop the iterations. Existing stopping criteria can be divided into two types: Distance-based criteria [17,13,6] utilize distances betweenP LandU to decide the stopping point. Minimum description length based criteria [3,16] utilize the initialP Lto encode the training set. The stopping point is where the encoding is most compact. Both types of criteria suffer from the interference from non-characteristic readings, and distance-based criteria are not compatible to our method. This has motivated us to develop our novel ASPM stopping criterion.
6
Conclusions and Future Work
In this paper, we have taken on the challenging task of positive unlabeled [8] discovery of time series shapelets [18,10,7,19,15]. To label the U set, we have developed a novel pattern ensemble (PE) method that ranksU examples with both potentially characteristic andpotentially non-characteristic patterns, with no need to know their actual qualities. We have also developed a novel ASPM stopping criterion, which estimates the number of positive examples based on the novel concept of shapelet precision. After labeling the entire training set, we have conducted supervised shapelet selection and built a one-nearest-neighbor classifier. Extensive experiments have demonstrated the effectiveness and efficiency of our method. Currently, our method utilizes the orderlines of all shapelet candidates, which is highly costly in terms of space and time efficiency. For future work, we plan to develop heuristics for more efficient selection of shapelet candidates for the PE subroutine. We also plan to apply GPU acceleration to our method.
References
1. PU-Shapelets source code,https://github.com/sliang11/PU-Shapelets
2. Bagnall, A., Lines, J., Bostrom, A., Large, J., Keogh, E.: The great time series classification bake off: a review and experimental evaluation of recent algorithmic advances. Data Min. Knowl. Discov. 31(3), 606–660 (2017)
3. Begum, N., Hu, B., Rakthanmanon, T., Keogh, E.: Towards a minimum description length based stopping criterion for semi-supervised time series classification. In: 2013 IEEE 14th International Conference on Information Reuse Integration. pp. 333–340 (2013)
4. Chen, Y., Hu, B., Keogh, E., Batista, G.: DTW-D: Time Series Semi-supervised Learning from a Single Example. In: Proceedings of the 19th ACM SIGKDD International Conference on Knowledge Discovery and Data Mining. pp. 383–391 (2013)
5. Chen, Y., Keogh, E., Hu, B., Begum, N., Bagnall, A., Mueen, A., Batista, G.: The UCR Time Series Classification Archive (July 2015),
6. Gonz´alez, M., Bergmeir, C., Triguero, I., Rodr´ıguez, Y., Ben´ıtez, J.: On the stopping criteria for k-nearest neighbor in positive unlabeled time series classification problems. Information Sciences 328, 42–59 (2016)
7. Hills, J., Lines, J., Baranauskas, E., Mapp, J., Bagnall, A.: Classification of time series by shapelet transformation. Data Mining and Knowledge Discovery 28(4), 851–881 (2014)
8. Li, X., Liu, B.: Learning from positive and unlabeled examples with different data distributions. In: European Conference on Machine Learning. pp. 218–229 (2005) 9. Ma, J., Sun, L., Wang, H., Zhang, Y., Aickelin, W.: Supervised anomaly
detection in uncertain pseudoperiodic data streams. ACM Transactions on Internet Technology 16(1), 4:1–4:20 (2016)
10. Mueen, A., Keogh, E., Young, N.: Logical-shapelets: an expressive primitive for time series classification. In: Proceedings of the 17th ACM SIGKDD international conference on Knowledge discovery and data mining. pp. 1154–1162 (2011) 11. Nguyen, M.N., Li, X., Ng, S.: Positive Unlabeled Learning for Time Series
Classification. In: Proceedings of the Twenty-Second International Joint Conference on Artificial Intelligence. pp. 1421–1426 (2011)
12. Nguyen, M.N., Li, X., Ng, S.: Ensemble based positive unlabeled learning for time series classification. In: International Conference on Database Systems for Advanced Applications. pp. 243–257 (2012)
13. Ratanamahatana, C.A., Wanichsan, D.: Stopping Criterion Selection for Efficient Semi-supervised Time Series Classification. In: Software Engineering, Artificial Intelligence, Networking and Parallel/Distributed Computing, pp. 1–14 (2008) 14. Sart, D., Mueen, A., Najjar, W., Keogh, E., Niennattrakul, V.: Accelerating
dynamic time warping subsequence search with GPUs and FPGAs. In: Data Mining, 2010 IEEE 10th International Conference on. pp. 1001–1006 (2010) 15. Ulanova, L., Begum, N., Keogh, E.: Scalable clustering of time series with
u-shapelets. In: Proceedings of the 2015 SIAM International Conference on Data Mining. pp. 900–908 (2015)
16. Vinh, V.T., Anh, D.T.: Two Novel Techniques to Improve MDL-Based Semi-Supervised Classification of Time Series. In: Transactions on Computational Collective Intelligence XXV, pp. 127–147 (2016)
17. Wei, L., Keogh, E.: Semi-supervised Time Series Classification. In: Proceedings of the 12th ACM SIGKDD International Conference on Knowledge Discovery and Data Mining. pp. 748–753 (2006)
18. Ye, L., Keogh, E.: Time series shapelets: a novel technique that allows accurate, interpretable and fast classification. Data mining and knowledge discovery 22(1-2), 149–182 (2011)
19. Zakaria, J., Mueen, A., Keogh, E.: Clustering time series using unsupervised-shapelets. In: Data Mining, 2012 IEEE 12th International Conference on. pp. 785– 794 (2012)
20. Zhou, J., Zhu, S., Huang, X., Zhang, Y.: Enhancing Time Series Clustering by Incorporating Multiple Distance Measures with Semi-Supervised Learning. Journal of Computer Science and Technology 30(4), 859–873 (2015)
21. Zhu, X., Goldberg, A.B.: Introduction to semi-supervised learning. Synthesis lectures on artificial intelligence and machine learning 3(1), 1–130 (2009)