Vol. 2, No. 2, 2014 www.scholink.org/ojs/index.php/jbtp
Original Paper
The Influence of Support by a Network with Structural Holes on
the Performance of Student Startups
Martin Haring1
1 Domain Management and Economics of the University of Applied Sciences in Amsterdam, the
Netherlands
* Martin J. Haring, E-mail: [email protected] Abstract
This paper analyses the influence of the support from the environment, in which students live and work, on the success of student startups. A unique experiment was conducted, in which one group of students was confronted with a network of external specialists and the other group was not confronted with this network. This experiment dealt with the endogeneity problem that is often related with social networks, because this time part of the network was externally delivered to the startups involved in the experiment. The experiment also delivered data from which we can conclude that student startups in a more traditional market profit more from a dense network than from a network with structural holes in the first six months after starting their businesses. Student startups that started in less developed markets seemed to profit more from structural holes in this startup phase. In both cases there was no significant evidence that a network with structural holes contributed to a higher performance of student startups in their first six months. This paper ends with recommendations for universities how to help their student startups to succeed better within the educational system.
Keywords
student startups, experiment, structural holes, social capital, networks, entrepreneurship, education 1. Introduction
In the entrepreneurial network literature there is no consensus at the moment about the configuration of the network of a new firm. While some have argued that cohesive strong ties contribute to the success of a new firm (e.g. Hite & Hesterley, 2001), others seem to be in favor of weak-ties networks at the early stage of firm development (Elfring & Hulsink, 2007). A systematic analysis of the optimal configuration of entrepreneurs social capital in the early firm stage is therefore a territory that needs more specific research.
Social networks can be shaped at random or intended. In the first case the entrepreneur depends on luck and in the second case an entrepreneur seeks for connections with specific persons or companies. In the case of the organization and coordination of resources social activity and social interactions are
required. The start of a new enterprise means that existing social relationships have to be activated and new ones created (Bruderl and Preisendorfer, 1998, Elfring and Hulsink, 2007). Different social networks can be connected to one another. One of the vehicles of this connection can be entrepreneurship: entrepreneurship is building bridges between previous disconnected social circles (Burt, 1992; Schumpeter, 1934). Concerning this last topic some research has been done. It seems to be obvious that an entrepreneur has ties or is developing ties in the industry he is working in, but he also needs to have extra-industry links with e.g. informal investors, educational curricula and the media to allow him to demonstrate his congruence with existing norms and practices, thereby facilitating access to valuable resources that support growth and survival of the new founded enterprise (Zimmerman and Zeitz, 2002). The development of ties to different social networks is one of the aspects of entrepreneurial behavior and helps with the developing of the critical processes a new venture has to deal with. This developments also gives an endogeneity problem while dealing with conclusions drawn from network research. In most literature networks are considered to be exogenous and not influenced by variables like the social and human capital of the founders of the new firm (Stuart and Sorensen, 2007).
When a social network is not connected directly to another social network we speak of a structural hole, a separation between non-redundant contacts. The hole is a buffer like an insulator in an electric circuit. As a result of the hole between them, two contacts provide network benefits that are in some degree additive rather than overlapping (Burt, 1992). It appears that new ventures that occupy structurally advantageous network positions by bridging structural holes within the larger business community have privileged access to external resources, benefit from entrepreneurial learning, identify more business opportunities and enjoy higher reputations (Stam, 2008).
To address the issues stated before we decided to conduct a unique experiment within the group of several student startups involved in a minor program entrepreneurship at the University of Applied Sciences in Amsterdam. Part of the group was introduced to a network with specialists from different industries and the other part was not introduced to this network. With this experiment we wanted to answer the question if the introduction to a social network with structural holes influences the results of a startup in its early stage. We also wanted to address the endogeneity problem and were able to measure the effect of strong and weak ties on the success of new firms.
105 startups were included in our experiment. 23 of them are still in business at this moment. The results of the experiment do not show that the performance of the treatment group was significantly better than that of the control group. The rest of this paper is structured as follows: section 2 gives more details about the design and context of the field experiment, section 3 describes the data and reports results of the analyses made. Section 4 presents the empirical findings and, finally, section 5 discusses the findings and draws conclusions.
2. Context and Design 2.1 Context
The startups that we studied were all started during a minor program in Entrepreneurship at the University of Applied Sciences of Amsterdam. Students from all schools of the University of Applied Science in the Netherlands are allowed to choose this program and follow it for a period of six months. The University of Applied Sciences of Amsterdam is divided into seven schools: the School of Design and Communication, the School of Economics and Management, the School of Education, the School of Health Professions, the School of Social Work and Law, the School of Sports and Nutrition and the School of Technology. 60 percent of the participants in the program were students in the School of Economics and Management, as shown in Figure 1.
Figure 1. Percentage minor students from schools of the university
The students had to start their own company in groups of two to four students. In exceptional cases students were allowed to start their business on their own. This was most often allowed if they already had a business partner from outside the university. The activities of the minor program were located off the university campus within a business center with all kinds of small, creative companies. Students could use this place as their dedicated work space. In the first two weeks of the minor program we focused on concept development by means of brainstorm sessions and on group formation. Students
were advised to form teams with complementary skills. In this period they also developed a startup document in which they formulated their business model, their target for the first half year and the deliverables at the end of the period. An internal coach was also assigned to each group. The internal coaches were specialized in, for example, sales, marketing, law or international business. All the coaches that were involved in the minor program have had their own business or were still active in their own company. Each coach worked with three groups during the course of an half year.
Over the next sixteen weeks, the students started to shape their startups. They registered at the Chamber of Commerce, they developed a website, if necessary they developed a prototype, they might have imported a product, they gathered the resources to start their business, they visited network meetings, sold their products/services, took care of free publicity, etc. During this period the students were obliged to follow classes on the subjects of marketing, finance, sales, business writing, giving elevator pitches, using the business canvas (Osterwalder, 2010), debating, intellectual properties, law and taxes. The theory of effectuation (Sarasvathy, 2001) was starting point in guiding the students. Every student startup had to take care of its own investments. They also spent an entire week making a commercial, teaser or viral for their company, and during that process they were guided by professional filmmakers. During the course we invited entrepreneurs to share their stories with the students, organized a debate about entrepreneurship and showed the commercials to a professional jury at an Oscar-like awards ceremony. The course ended with an elevator pitch competition involving the ten best startups before a jury of informal investors in which they could win a prize. The students were rewarded for their efforts with 30 ECTS-credits after an assessment about the goals they achieved.
After the course the students had the possibility to do their internship within their own firm for a period of six months. In this period they were guided by a coach from the minor program. A special program with master classes, peer reviews and consulting had been developed for these students. The experiment reported in this paper was conducted in the academic years 2009-2010 and 2010-2011. The total number of students in those years was 495 and the total number of companies started was 165, giving an average team size of 3 students. In June 2012, 23 companies were still active. In this article, 135 companies were analyzed.
Table 1. Number of companies
Academic year Number of companies Still active in June 2012
1-9-2009 – 1-2-2010 44 8
1-2-2010 – 1-7-2010 32 4
1-9-2010 – 1-2-2011 54 5
2.2 Design
Once the students had formed their teams, the treatment group received an e-mail in week four. In this e-mail the people from the network of specialists were introduced and their contact details were given to the students. In week eight the teams from the treatment group were invited for a consult with a business consultant from the network. He spoke to every team personally and advised about their concept and introduced them to possible clients or other business partners. In that way, the treatment group gained potential access to a network of specialists that could help their business move forward. Within this network the students could find help in areas such as product development, production, launching customers and investments. The students of the control group were not introduced to that network. The experts from the network were not informed that they were part of an experiment. They were asked if the students were allowed to contact them for help. The internal coaches of the students were not informed as to whether their team belonged to the treatment group or control group. The groups were randomly assigned to the treatment group by means of a randomizer. In week sixteen the entire group of students were interviewed about their respective networks.
3. Data 3.1 Variables
In the first week of their minor program the students had to fill out a survey with questions about individual characteristics such as age, education, work experience and family background. Their average age was approximately twenty-three, all students had work experience and work on average fourteen hours a week at the moment of being interviewed and over 35% has a father or mother who is or was an entrepreneur.
The baseline survey also included questions to measure entrepreneurial skills like market awareness, creativity and flexibility. Market awareness is the ability of the entrepreneur to sympathize with the needs of his (potential) target group and to anticipate on the behavior of his customers and competitors. Creativity is the ability to adopt views from different perspectives and to turn problems into new opportunities. Flexibility is the ability to adapt. Successful entrepreneurs react to changes they observe in their environment, such as new needs of clients or new competitors in their market (Oosterbeek, van Praag and Ijsselstein 2010). Moreover, the survey included statements that are combined through factor analysis into measures of entrepreneurial traits such as the need for autonomy, persistence, risk taking, self-efficacy and social orientation. These traits are supposed to be constant over time and possibly influential for entrepreneurial decisions and outcomes (Parker and van Praag 2010, Oosterbeek et al. 2010).
In the last week of their minor program the students had to fill out a survey with questions concerning the development of the team and the processes that took place in the team. Questions related to processes within the team translated into measures of group potency, decision making, mutual monitoring and coordination, credibility and specialization (Hoogendoorn et al., 2011).
The test items were statements and respondents indicated using a 7-point scale the extent to which they agreed with each statement. 1 The statements loaded into several factors (with Cronbach alpha’s
ranging from 0.6 to 0.88) that can be used as determinants of successful entrepreneurship and of team development, see Table 2.
Table 2. Cronbach Alpha’s reading of test items
Variables Questions C α Variables Questions C α
Entr. Skills N. for power 4 0.75
Creativity 4 0.85 N. for autonomy 4 0.67
Flexibility 4 0.71 N. for achievement 4 0.68
Market awareness 4 0.6 Team processes
Entr. Traits Group coordination 3 0.88
Endurance 4 0.8 Group potency 3 0.83
Risk taking 4 0.8 Group specialization 3 0.67
Self-efficacy 4 0.71 Group credibility 3 0.67
Soc.orientation 4 0.76 Team monitoring 3 0.73
Decision-making 3 0.61
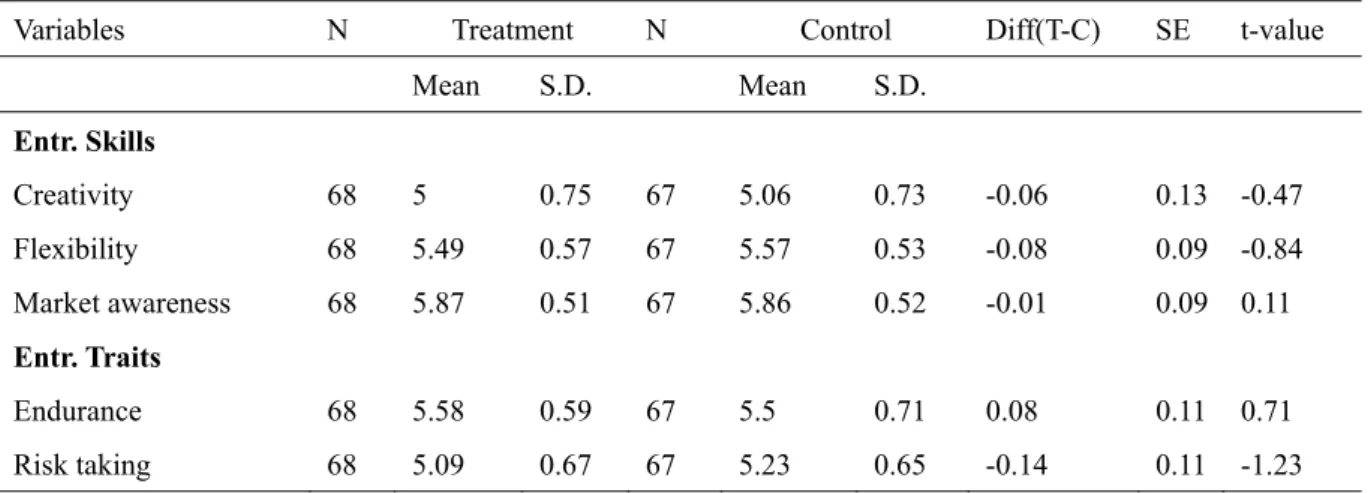
The startups were all randomly assigned to the treatment and control group. To be sure that there were no significant differences, before the treatment, in the skills, traits and group processes we compared the groups on these variables by using a two sample mean comparison test, which showed that all aspects were equally divided over the two groups, as shown in Table 3.
Table 3 Comparison treatment and control group
Variables N Treatment N Control Diff(T-C) SE t-value
Mean S.D. Mean S.D. Entr. Skills Creativity 68 5 0.75 67 5.06 0.73 -0.06 0.13 -0.47 Flexibility 68 5.49 0.57 67 5.57 0.53 -0.08 0.09 -0.84 Market awareness 68 5.87 0.51 67 5.86 0.52 -0.01 0.09 0.11 Entr. Traits Endurance 68 5.58 0.59 67 5.5 0.71 0.08 0.11 0.71 Risk taking 68 5.09 0.67 67 5.23 0.65 -0.14 0.11 -1.23
1 Examples of the statements are: “I can motivate other people”, “Other people say I am creative”, “I
Self-efficacy 68 4.96 0.55 67 5.02 0.59 -0.06 0.10 -0.61 Soc.orientation 68 5.51 0.59 67 5.59 0.61 -0.08 0.10 -0.77 N. for power 68 4.85 0.58 67 4.90 0.64 -0.05 0.11 -0.48 N. for autonomy 68 5.02 0.51 67 5.13 0.53 -0.11 0.09 -1.23 N. for achievement 68 5.77 0.51 67 5.86 0.54 -0.09 0.09 -1 Team processes Group coordination 66 5.20 1.04 64 5.07 0.95 0.13 0.17 0.74 Group potency 66 5.46 0.70 64 5.27 0.92 0.19 0.14 1.33 Group specialization 66 5.06 1.1 64 5.06 0.91 0.00 0.18 0 Group credibility 66 3.63 0.63 64 3.78 0.47 -0.15 0.1 -1.54 Team monitoring 66 5.48 1.1 64 5.11 0.89 0.37 0.18 2.1 Decision-making 66 4.98 0.69 64 4.94 0.67 0.04 0.12 0.33
At the end of the semester all groups were interviewed about the results they produced and the people and companies that were involved in bringing the startup to the stage that it was in at that moment. The interview was about their turnover, costs and profit, but also about being registered at the chamber of commerce, patenting, financing, marketing activities, employees and the continuation of the business (Davidsson and Honig 2003). The students were also interviewed about the development of their network. They had to answer questions about the startups’ most important contacts until that moment in the areas of finance, marketing, legal issues, distribution and sales. The frequency of the contact to them, the person who introduced the contact to the startup, their relation to the person who introduced the contact, which contacts knew each other and the importance to the startup were also recorded, according to the format used by Bhagavatula et al. (2010).
In this study we treat the networks of the startups as ‘egonetworks’. Ego is the person, in this case the startup, whose network is solicited, while the alters are his contacts. The instrument used to map the network of the startup is called a “name generator” (Bailey and Marsden 1999). We asked the student to give us the names of the people who were the most significant in helping them to reach their goals during the minor. Research has shown that the issues important to startups are: obtaining legitimacy, initiating ties with stakeholders (potential customers, investors, manufacturers, etc.) and obtaining and recombining resources (product development, obtaining inputs and initiating marketing and promotion) (Delmar and Shane 2004, Elfring and Hulsink 2003). We therefore asked the students who helped them in those areas. In line with Marsden (1993), we used three types of name interpreter items: 1) the attributes of the alters, such as their position within an organization and who introduces the alter to the startup; 2) the dyadic features of the relationship between ego and alter, for instance the intensity, duration and importance; 3) the characteristics of the relationships between the various alters (family, friend, relative or business contact).
(Laumann et al., 1978) it is a set of nodes (persons, organizations) linked by a set of social relationships (friendships, transfer of funds, overlapping memberships) of a specified type. The types we are talking about in the network literature can be the strong ties or weak ties as defined by Granovetter (1983). Where strong ties can be pointed out as relatives, friends and e.g. neighbors and weak ties can be described as acquaintances or friends of friends. The criteria used are: the frequency of contact, the emotional intensity of the relationship, the degree of intimacy, and reciprocal commitments between the actors involved.
The network variables we used in this study were network size, network density, average tie strength and network constraint. Network size, which was added as a control variable, is the total number of alters (either weak or strong) to which a startup is connected. It is measured simply by counting the unique relationships of the startup (referred to as alters).
Network density is the total number of relationships between the startup and his unique alters, divided by the total number of potential ties that are theoretically possible between a startup and his alters (Burt 1978). The density gives information on how cohesive and homogeneous the network is as a whole. The higher the density, the more connected are the actors of the network to each other.
To measure the average tie strength, the duration of the relation until the time of questioning, the frequency of meetings (daily, weekly, monthly, …) and the intimacy (family, friend or acquaintance) of each startup’s alter were coded to create a dichotomous variable for each of the specific topics. These outcomes were subsequently added to create an indicator for the strength of the tie. The average tie strength of all alters is measured by adding the value of the tie strength of all the alters and dividing the result by the number of alters of a particular startup (Bhagavatula et al. 2010).
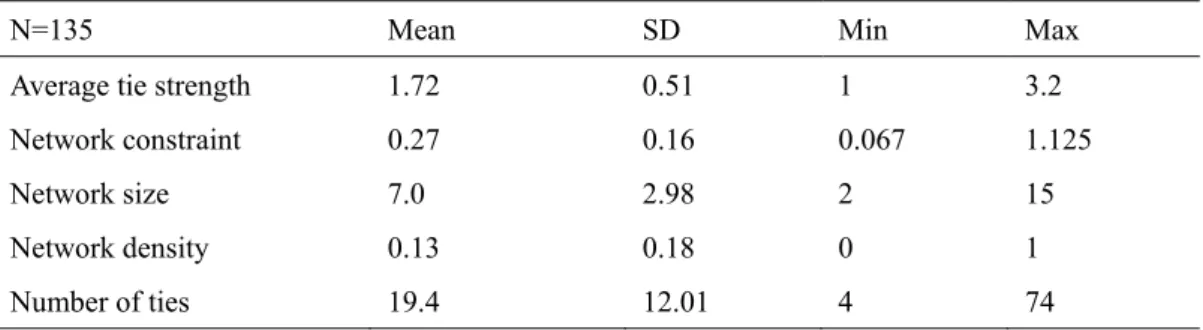
Network constraint indicates the extent to which a startup is constrained by the structure of the network involving his alters (Burt 2000). The lower its value, the more structural holes the startup’s network contains. In Burt’s terms, the fewer the number of ties between an ego’s contacts, the more advantageous is the ego’s network. A network with a lot of structural holes gives the ego (in this case the startup) in the center of the network the advantage of gaining information before the information reaches others in his network. This advantage makes it possible for the startup to react to developments in the market before others. Because of this advantage the startup gains trust within his network of his clients and other stakeholders (e.g. investors). The network results of the interviews are shown in Table 4.
Table 4. Descriptive statistics of network variables after 20 weeks of the minor program entrepreneurship
N=135 Mean SD Min Max
Average tie strength 1.72 0.51 1 3.2
Network constraint 0.27 0.16 0.067 1.125
Network size 7.0 2.98 2 15
Network density 0.13 0.18 0 1
Number of ties 19.4 12.01 4 74
4. Results
Table 4 shows the network results of the total population of this research. When we divided the total results into the treatment and control group we concluded that there are no significant differences between these groups (also controlled by two sample mean comparison tests). We had expected a difference in the results, in particular in the case of network constraint. The constraint of the treatment group should have been smaller if the startups from this group had profited optimally from the network with structural holes, but the data showed that the constraint was of the same size as the startups of the control group. These data are shown in table 4a. The column of the treatment and control group give the mean values after 20 weeks of being a startup and their Standard Deviation, the column named “Diff(T-C)” shows the difference between both means and the column named “SE” shows the Standard Error of the difference.
Table 4a. Two sample mean comparison test between treatment and control group
Variables N Treatment N Control Diff (T-C) SE t-value
Mean S.D. Mean S.D.
Average tie strength 68 1.7 0.49 67 1.73 0.54 -0.03 0.09 -0.34 Network constraint 68 0.26 0.180 67 0.28 0.14 -0.02 0.03 -0.72
Network size 68 7.2 3.00 67 6.8 2.96 0.4 0.51 0-78
Network density 68 0.13 0.19 67 0.12 0.16 0.01 0.03 0.33
Number of ties 68 19.7 12.3 67 19.19 11.8 0.51 2.08 0.25
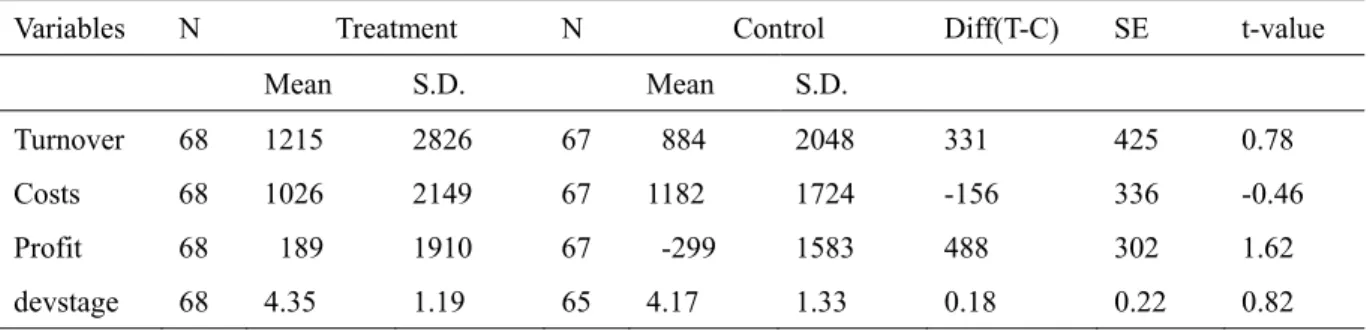
Table 5 shows descriptive statistics of three performance measures based on the interviews with 135 teams. The average turnover amounted to 1,058 Euros, with a standard deviation of 2,475 Euros. After 20 weeks, 82 teams ran a loss and 52 teams made a profit (before taxes). A two sample mean comparison test showed no significant difference between the treatment and control group (Table 5a). In Table 5a we also compared the development stage (devstage) of the startups and we used a scale of 1-5 in which 1=idea stage, 2=prototype, 3=tested by clients, 4=in production and 5=sold on the market.
Table 5. Descriptive statistics of dependent variables after 20 weeks of the minor program entrepreneurship
N=134 Mean SD Min Max
Turnover 1050 2467 0 18000
Costs 1104 1944 0 15000
Profit -53 1766 -7000 10400
Table 5a. Two-sample t test shows no significant difference between treatment and control group
Variables N Treatment N Control Diff(T-C) SE t-value
Mean S.D. Mean S.D.
Turnover 68 1215 2826 67 884 2048 331 425 0.78
Costs 68 1026 2149 67 1182 1724 -156 336 -0.46
Profit 68 189 1910 67 -299 1583 488 302 1.62
devstage 68 4.35 1.19 65 4.17 1.33 0.18 0.22 0.82
We also compared the constraint of the network within the different branches the startups were acting in (Table 6). In this case there was a difference at a 10% level between the mean of the teams in the service/trade branch and the one of the teams involved in product development. This points in the same direction as the difference in tie strength between these groups. A startup involved in product development needs more weak ties and also more structural holes to bridge the gap in knowledge between the student startup and the market.
Table 6. Constraint of network in different branches
3=prod.dev. (15)
Constraint Mean S.D. Mean S.D. Difference SE
1=service (62) 0.31 0.2 0.20 0.07 0.11 0.053*
2=trade (58) 0.25 0.11 0.20 0.07 0.05 0.030*
* p<0.1
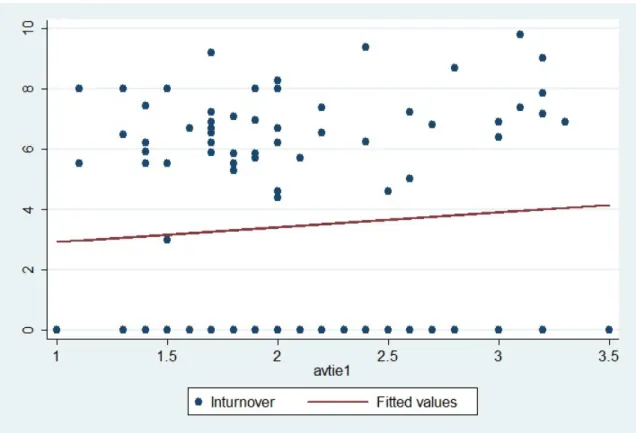
As stated earlier, the support from someone’s environment plays a role in the success of a student startup. One of the variables measuring the support from the network is the strength of the ties involved in the network of a startup. We measured the average tie strength of the startups in their first half year and regressed it with the turnover of the startup in that period. The outcome of the regression showed that there was a clear correlation (at 95% level) between the average tie strength and the height of the turnover. If the average tie strength increases by 0.1 point the turnover increases by € 98. The adjusted R-square is 4% so the influence is rather small. It seems to point in the direction that a dense network
contributes to the growth of the turnover of student startups in their early startup phase.
Figure 2. Scatter plot of the regression of turnover (transformed into natural log value) and average tie strength
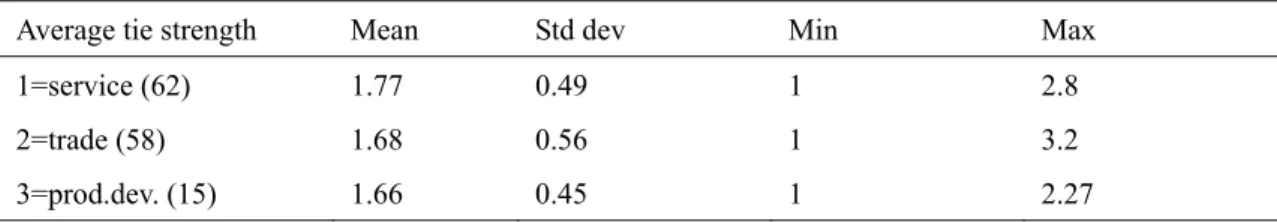
This correlation might be related to the fact that many of the student startups were operating in a consumer market and were able to sell their product to family and friends. Therefore, the closer the ties, the more committed the people in the startup’s network were promoting the startup among their friends and relatives. The students started businesses in the service industry providing catering, organizing events, offering personal training or help with tax returns, and so on. Within the trade industry they were starting businesses to sell fashion items like clothing, bags, laptop sleeves and jewelry. The products that they were developing included items for the gadget market, bicycle accessories or healthcare related items (e.g. a special massage table). The average tie strength for the startups that were developing new products was lower than that of the other groups of startups (see Table 7), so there were more weak ties in those networks. Because of the complexity of product development those groups might have been forced to look for contacts beyond family and friends.
Table 7. Average tie strength in diverse branches
Average tie strength Mean Std dev Min Max
1=service (62) 1.77 0.49 1 2.8
2=trade (58) 1.68 0.56 1 3.2
3=prod.dev. (15) 1.66 0.45 1 2.27
During the network interview, 89 out of 105 startups (85%) mentioned their internal coach as an important contact for the development of their businesses. In this period they met their internal coach every week for a consult of one hour. On a scale of one to seven the contribution of their internal coach was appreciated on average with 5.7. The students interviewed mentioned their internal coaches help with the group process, product development, planning and motivation most often.
The treatment group mentioned the help of one of the people of the external network eight times (52 startups). Therefore 15% of the startups actually said that they benefited from the external network. They met with these external contacts one to four times during the minor program. They judged the contribution of these people on average with 4.1 on a scale of 7. Only in one case the contact with the external network led to a long term relationship in which one of our students actually started a business partnership with somebody from the external network. On average the contribution of the external network was therefore appreciated far less than the help of the internal coach from the minor program. The fact that a large group of students (60%) were not sure whether they would continue their business due to study obligations might be one of the factors that made it hard for the people in the external network to commit to these startups.
I also analyzed all dependent (social network, entrepreneurial skills, entrepreneurial traits, team processes) and independent variables (Results) that I mentioned before in a regression result table (Table 8). From this table I can conclude that especially the team processes had a positive impact on the turnover and profit of the student startups in their first half year. The average tie strength is positively connected to the development stage of the student startup. This points in the direction that the stronger the ties, the more developed a student startup can be in the first six months of its development. The results of the regression table also show that some of the Entrepreneurial skills and traits are negatively correlated with the development of the profit of the student startup in the first six months.
5. Conclusion, Discussion and Recommendations
The results of the research on the effect of the support that students receive from the environment in which they live and work and the influence of that support on the results of the startup they begin, lead us to conclude that friends and family play an important role in the first phase of a startup in traditional branches like services and trade. This is in line with the conclusions drawn in earlier research done on this topic (Elfring and Hulsink 2007, Bruderl and Preisendorfer 1998, Renzulli, Aldrich and Moody
2000). In more uncertain markets such as product development, on the other hand, the results of the research suggest that a network with weak ties and more structural holes is important. This is also in line with research done on this topic (Renzulli et al. 2000; Rowley, Behrens & Krackhardt 2000). The experiment with the introduction of a network with structural holes to a group of student startups showed no significant differences in the results made by the different groups of students. The introduction did not guarantee that the students made use of the network, or that there was a follow-up after becoming acquainted with members from the network. The most important factors were: the product/service wasn’t challenging enough for the members of the network (40%), the students had too much doubt about continuation of the start up after the minor period (60%) and there was no match between students and members of the network (20%). The members of the network could point out more than one reason when interviewed. This result seems to point in the direction that there is no advantage in having a network with structural holes in the early startup phase for student startups, who are not committed to their startup.
The students pointed out in the interviews that the influence of their internal coach during the process of starting up their business was important. In particular the support with respect to motivation, product development, group processes and planning were important. This therefore supports the conclusions of earlier research (Ruda et al. 2009). The coaches involved in the minor program all had their experiences in starting business on their own and this might have contributed to the appreciation of the students and can be a recommendation for educators involved in developing curricula on this subject. The fact that the students were committed full time to the startup during the entrepreneurship minor contributes to the external validity of the results of this study. Confronted with real time challenges and the fact that they were still in a situation where they had to finish their bachelor’s degree, however, made it sometimes hard to commit to the startup and to make the necessary sacrifices, including financial ones, to bring the startup to the next level. This also could be taken into account by educators that are aiming at helping students with creating their own companies.
This article only deals with the short period of half a year, therefore follow-up research is needed to find out how the student startups that went on with their business, developed. At the moment we are still collecting data about the student companies that are still in the market.
If universities really want to contribute to the economic development of their country by stimulating students to startup their own businesses, they also should consider to take the right measures to make this happen. A six-month course in which the students can have a first experience of entrepreneurship seems to be a step in the right direction, but if no thoughts are given to the follow-up, the output could be considered to be just a minor contribution. This study shows that within two years only 23 of the 165 startups are still surviving. 14% seems to be a score to be satisfied with, but with the right precautions it might have been a higher score. I challenge the university to make entrepreneurship a more important goal within the education system so that by making use of custom-made solutions we can deliver more students with a finished university education and the title of CEO of their own
business. Doing so we may get rid of the myth that the most successful entrepreneurs are drop-outs from the educational system.
References
Bailey, S., & Marsden, P. V. (1999). Interpretation and interview context: Examining the General Social Survey name generator using cognitive methods. Social Networks,21, 287-309.
Bhagavatula, S., Elfring, T., van Tilburg, A., & van de Bunt, G. G. (2010). How social and human capital influence opportunity recognition and resource mobilization in India’s handloom industry.
Journal of Business Venturing,25, 245-260.
Bruderl, J., & Preisendorfer, P. (1998). Network support and the success of newly founded businesses.
Small Business Economics,10, 213-225.
Burt, R. S. (1978). Applied network analyses overview. Sociological Methods & Research,7, 123-130. Burt, R. S. (1992). Structural holes: The social structure of competition. Cambridge, MA: Harvard
University Press.
Burt, R. S. (2000). The network structure of social capital. Research in Organizational Behavior, 22, 345-423.
Bruderl, J., & Preisendorfer, P. (1998). Network support and the success of newly founded businesses.
Small Business Economics,10, 213-225.
Davidsson, P., & Honig, B. (2003). The role of social and human capital among nascent entrepreneurs.
Journal of Business Venturing,18, 301-331.
del-Palacio, I., Sole, F. & Batista-Foguet, J. M. (2008). University entrepreneurship centres as service businesses. Service Industries Journal,28, 939-951.
Delmar, F., & Shane, S. (2004). Legitimating first: Organizing activities and the survival of new ventures. Journal of Business Venturing,19, 385-410.
Driessen, M. P., & Zwart, P. S. (1999). The role of the entrepreneur in small business success: The Entrepreneurship Scan. Working paper, University of Groningen.
Elfring, T., & Hulsink, W. (2003). Networks in entrepreneurship: The case of high-technology firms.
Small Business Economics,21, 409-422.
Elfring, T., & Hulsink, W. (2007). Networking by entrepreneurs: Patterns of tie-formation in emerging organizations. Organization Studies,28, 1849-1872.
Granovetter, M. (1983). The strength of weak ties: A network theory revisited. Sociological Theory, 1, 201-233.
Hage, J. T. (1999). Organizational innovation and organizational change. Annual Review of Sociology, 25, 597-622.
Harkema, S., & Schout, H. (2008). Incorporating Student-Centred Learning in Innovation and Entrepreneurship Education. European journal of education.
performance of business teams: Evidence from a field experience. Tinbergen Institute Discussion Paper (No. 11-074/3).
Laumann, E. O., Galaskiewicz, J., & Marsden, P. V. (1978). COMMUNITY STRUCTURE AS INTERORGANIZATIONAL LINKAGES. Annual Review of Sociology, 4, 455-484.
Luthje, C., & Franke, N. (2003). The ‘making’ of an entrepreneur: Testing a model of entrepreneurial intent among engineering students at MIT R&T management (pp. 135-147).
Marsden, P. V. (1993) The reliability of network density and composition measures. Social Networks, 15, 399-421.
Oosterbeek, H., van Praag, M., & Ijsselstein, A. (2010). The impact of entrepreneurship education on entrepreneurship skills and motivation. European Economic Review,54, 442-454.
Parker, S. C., & van Praag, M. (2010). Group status and entrepreneurship. Journal of Economics & Management Strategy,19, 919-945.
Renzulli, L. A., Aldrich, H., & Moody, J. (2000). Family matters: Gender, networks, and entrepreneurial outcomes. Social Forces,79, 523-546.
Rowley, T., Behrens, D., & Krackhardt, D. (2000). Redundant governance structures: An analysis of structural and relational embeddedness in the steel and semiconductor industries. Strategic Management Journal,21, 369-386.
Ruda, W., Martin, T., & Danko, B. (2009). Target Group-Specific Design of Student Entrepreneurship Support. A German Example Focusing on Start-Up Motives and Barriers. Acta polythechnica Hungarica, 5-22.
Sarasvathy, S. D. (2001). Causation and effectuation: Toward a theoretical shift from economic inevitability to entrepreneurial contingency. Academy of management Review, 26(2), 243-263. Schumpeter, J. A. (1934). The theory of economic development. Cambridge, MA: Harvard University
Press.
Stam, W., & Elfring, T. (2008). Entrepreneurial orientation and new venture performance: The moderating role of intra- and extraindustry social capital. Academy of Management Journal, 51,
97-111.
van Gelderen, M., Thurik, R., & Bosma, N. (2006). Success and risk factors in the pre-startup phase.
Small Business Economics,26, 319-335.
Zimmerman, M. A., & Zeitz, G. J. (2002). Beyond survival: Achieving new venture growth by building legitimacy. Academy of Management Review,27, 414-431.
Table 8. Regression table (n=135) of student startups Mean SD 1 2 3 4 5 6 7 8 9 10 11 12 13 14 15 16 17 18 19 20 21 22 23 24 Social network 1.size 2.80 0.83 2.avstrties 1.70 0.51* 0.06 3.constraint 0.27 0.16 ‐0.02 ‐0.05* 4.netwsize 7.00 3.00 0.02 0.15** ‐0.61* 5.density 0.13 0.18 ‐0.01 0.06 0.79+ ‐0.15* 6.nmbties 19.40 12.00 ‐0.09 0.10 ‐0.31+ 0.83+ 0.18* Entr. skills 7.creativity 5.04 0.74 ‐0.17 ‐0.10 ‐0.12 ‐0.01 ‐0.15* ‐ 0.06 8.flexibility 5.50 0.55 0.02 ‐0.06 ‐0.01 ‐0.06 ‐0.07 ‐ 0.06 0.49+ 9.marketaware 5.90 0.51 0.24+ ‐0.04 0.04 ‐0.05 ‐0.01 ‐ 0.05 0.16* 0.43+ Entr. traits 10.endurance 5.60 0.65 ‐0.06 ‐0.07 ‐0.11 0.08 ‐0.07 0.08 0.16* 0.38+ 0.29+ 11.risktaking 5.20 0.66 ‐0.10 ‐0.11 0.01 ‐0.04 ‐0.03 ‐ 0.05 0.54+ 0.46+ 0.15* ‐0.02 12.selfeff 5.00 0.57 0.02 0.14 ‐0.05 0.12 0.03 0.10 0.29+ 0.38+ 0.21 0.28+ 0.22** 13.soc. or. 5.50 0.60 ‐0.06 ‐0.12 ‐0.04 ‐0.03 ‐0.13 ‐ 0.01 0.43+ 0.45+ 0.26+ 0.13 0.48+ 0.12 14.needforpow 4.90 0.60 ‐0.03 ‐0.11 ‐ 0.19** 0.16* ‐0.14 0.15 0.34+ 0.31+ 0.16* 0.20** 0.35+ 0.25+ 0.34+ 15.needforaut 5.10 0.52 ‐0.03 ‐0.05 ‐0.12 0.02 ‐0.10 0.06 0.35+ 0.48+ 0.30+ 0.50+ 0.26** 0.41+ 0.45+ 0.39+ 16.needforach 5.80 0.53 ‐0.03 0.11 0.04 0.03 0.02 0.06 0.31+ 0.35+ 0.23+ 0.36+ 0.39+ 0.38+ 0.30+ 0.29+ 0.42+ 17.coordin. 5.10 0.99 ‐0.03 ‐0.05 0.07 0.04 0.08 0.13 ‐0.06 0.19** 0.09 0.16* 0.11 0.15* ‐0.01 0.14 0.18** 0.10 18.potency 5.40 0.82 0.07 0.00 0.04 0.05 0.10 0.07 0.00 0.20** 0.14 0.22** 0.11 0.21** 0.04 0.11 0.19** 0.14 0.81+ Team process 19.specializ. 5.10 1.00 0.21** ‐0.08 ‐0.15* 0.08 ‐ 0.19** 0.00 0.14 0.18** 0.22** 0.15* 0.18** 0.18** 0.17** 0.25+ 0.31+ 0.13 0.45+ 0.51+ 20.credibility 3.70 0.56 0.07 ‐0.03 0.03 ‐0.03 0.04 ‐ 0.08 ‐0.04 0.00 0.06 ‐0.04 ‐0.08 0.03 ‐0.01 ‐0.06 0.04 0.07 ‐0.18 ‐0.14 ‐0.03 21.team mon. 5.30 0.97 0.23** 0.00 0.03 0.02 0.09 0.09 ‐0.11 0.16* 0.30+ 0.15* 0.00 0.11 0.12 0.03 0.26+ 0.00 0.60+ 0.60+ 0.50*** ‐0.04 22.dec.making 5.00 0.68 ‐0.05 ‐0.01 0.13 ‐0.16* 0.06 ‐ 0.10 0.01 0.08 0.07 0.11 ‐0.04 0.04 0.02 ‐ 0.16* 0.13 0.02 0.41+ 0.50+ 0.48*** ‐0.04 0.50+ Results 23.turnover 1050.80 2467.00 ‐0.05 0.02 0.01 0.06 0.06 0.11 ‐0.05 0.03 0.06 0.04 ‐0.01 0.07 ‐0.07 0.11 0.04 ‐0.04 0.17* 0.15* 0.15* ‐0.04 0.23+ 0.12 24.profit ‐53.20 1765.60 0.15* ‐0.02 0.12 ‐0.11 0.09 ‐ 0.03 ‐ 0.24** ‐ 0.18** 0.00 0.04 ‐0.23+ ‐0.11 ‐0.23+ ‐0.08 ‐0.13 ‐ 0.23+ 0.08 0.14 0.08 ‐ 0.15* 0.22** 0.18** 0.62+ 25.devstage 4.30 1.30 ‐0.01 0.19** 0.10 0.07 0.14* 0.12 ‐0.12 ‐0.06 ‐0.02 ‐0.05 ‐0.06 0.13 ‐0.09 0.02 ‐0.10 0.06 0.09 0.16* 0.06 ‐0.06 0.13 0.07 0.21** 0.15* +p<0.01 **p<0.05 *p<0.1
Avstrties=Average Tie strength, netwsize=network size, nmbties=number of ties, marketaware=marketawareness, selfeff=self efficacy, soc.or.=social orientation, needforpow=need for power, needforaut=need for autonomy, needforach=need for achievement, coordin.=coordination within the group, specializ.=specialization within the group, team mon.=monitoring within the team, dec.making= decision making in the team, devstage=development stage of the startup.