Digital Object Identifier 10.1109/ACCESS.2019.2942485
Mobile Edge Computing-Based Data-Driven Deep
Learning Framework for Anomaly Detection
BILAL HUSSAIN 1, (Student Member, IEEE), QINGHE DU 1, (Member, IEEE), SIHAI ZHANG 2, (Member, IEEE), ALI IMRAN3, (Member, IEEE),
AND MUHAMMAD ALI IMRAN 4, (Senior Member, IEEE)
1Shaanxi Smart Networks and Ubiquitous Access Research Center, School of Information and Communications Engineering, Xi’an Jiaotong University, Xi’an
710049, China
2Key Laboratory of Wireless-Optical Communications, Chinese Academy of Sciences, University of Science and Technology of China, Hefei 230026, China 3School of Electrical and Computer Engineering, University of Oklahoma, Tulsa, OK 74135, USA
4School of Engineering, University of Glasgow, Glasgow G12 8QQ, U.K
Corresponding author: Qinghe Du ([email protected])
This work was supported in part by the National Natural Science Foundation of China under Grant No. 61671371, and in part by the Fundamental Research Funds for the Central Universities.
ABSTRACT 5G is anticipated to embed an artificial intelligence (AI)-empowerment to adroitly plan, optimize and manage the highly complex network by leveraging data generated at different positions of the network architecture. Outages and situation leading to congestion in a cell pose severe hazard for the network. High false alarms and inadequate accuracy are the major limitations of modern approaches for the anomaly—outage and sudden hype in traffic activity that may result in congestion—detection in mobile cellular networks. This indicates wasting limited resources that ultimately leads to an elevated operational expenditure (OPEX) and also interrupting quality of service (QoS) and quality of experience (QoE). Motivated by the outstanding success of deep learning (DL) technology, our study applies it for detection of the above-mentioned anomalies and also supports mobile edge computing (MEC) paradigm in which core network (CN)’s computations are divided across the cellular infrastructure among different MEC servers (co-located with base stations), to relief the CN. Each server monitors user activities of multiple cells and utilizesL-layer feedforward deep neural network (DNN) fueled by real call detail record (CDR) dataset for anomaly detection. Our framework achieved 98.8% accuracy with 0.44% false positive rate (FPR)—notable improvements that surmount the deficiencies of the old studies. The numerical results explicate the usefulness and dominance of our proposed detector.
INDEX TERMS Cellular network, anomaly detection, call detail record, deep learning, big data analytics, sleeping cell, congestion detection.
I. INTRODUCTION
To address the manifold capacity thirst in upcoming genera-tion of cellular systems (5G), researchers are actively investi-gating advanced technologies: ultra-dense networks, massive multiple-input multiple-output (MIMO) systems, cognitive radios, etc. [1]. These will enforce radical changes to the cellular infrastructure making it more complex; an artifi-cial intelligence (AI)-empowerment will therefore be piv-otal in many aspects to efficiently manage the network. The associate editor coordinating the review of this manuscript and approving it for publication was Junaid Shuja.
The AI-enabled features can leverage big data generated from the network [2, Fig. 3] to solve network-related issues.
Each year in the US alone, more than $15 billion are depleted in handling cell outages [1] that costs the network operators in the form of operational expenditure (OPEX). Cell outage has a special case called sleeping cell, in which inferior services are provided by a cell to its users and it experiences a total or partial deterioration without generating any alarm—it behaves normal from the perspective of oper-ation, administration and maintenance unit of the network. Sleeping cell can emerge due to multiple reasons: hardware failure due to a fault in antenna, cabling or other component
at eNodeB [3]; and random access channel (RACH) fail-ure due to RACH misconfiguration, firmware/software fault or exorbitant load at eNodeB [4, Sec. 3].
Abrupt rise in user traffic of a cell can lead towards congestion (circumstance with increasing traffic but rel-atively smaller throughput to satisfy the demand, inter-rupting network’s performance and user’s quality of experience (QoE) [5]) if remedial actions are delayed [6]. Such actions may include: offloading traffic to other base stations [7], allocating extra resources [6], and dynamic pricing in quality of service (QoS)-enabled networks [8]. A precise congestion discovery is fundamental for an effec-tive congestion-control mechanism. It’s indispensable for the QoS-enabled networks providing services that assure high QoS to the end-clients [8]. Sleeping cell and congestion, both can severely affect user’s QoE that may consequently increase the churn rate [1]; because annoyed users are more likely to switch network provider rather than calling customer service [9]. It will also result in revenue loss to the service provider if timely detection and necessary action is delayed.
An anomaly is an observation that violates standard pat-tern or considerably deviates from the overall norm of the data [10]. In cellular networks, anomalies can have a contex-tual meaning. Wanget al.[11] defined anomaly as a city scene (highway, tourist area, railway station, etc.) that has unusual network performance indicator values and characteristics, to carry out network optimization. Papadopouloset al.[12] utilized billing-related information to identify anomalous mobile devices that carryout attacks against cellular network. In [13], a significantly deviated user QoE as compared with the predicted QoE is defined as an anomaly, and is utilized for network optimization.
In this paper, we treat and henceforth refer both network performance-related problems—sleeping cell and soared traffic that might result in congestion—as anomalies. Since sleeping cell or possible congestion can lead to a situation having unusually low or high cell traffic activity, respectively; we use anomaly in cell traffic pattern as proxy for anomaly in the network performance. Hence, we leverage subscriber call detail records (CDRs) for the anomaly detection. Tradition-ally, CDRs are compiled and maintained for administrative use (such as, for keeping proof of user’s network usage for billing purpose), but nowadays they are also exploited for diverse purposes: Securing 5G networks against cyberat-tacks [12], analyzing cell site [14], enabling energy efficient networks [15], and studying human mobility patterns [16].
Deep learning (DL) outperformed the performance of many conventional ML techniques and accomplished break-throughs in various domains: computer vision, natural lan-guage processing, and genomics [18]. Additionally, mobile edge computing (MEC)—based on decentralized compu-tation, network management, and storage, as compared with centralized cloud computing architecture—has recently gained attention for its potential utility in 5G networks to push computation towards the network edges (e.g. access points and base stations). It aims to relief core network (CN)
from executing heavy-computation tasks and enables latency-critical and computation-intensive applications at resource-constrained mobile devices by leveraging huge idle storage space and computation power already available at the net-work edges [19], [20]. We contemplate DL blended with MEC can play a decisive role in the anomaly detection that will in turn improve user’s QoE and network’s QoS, increase customer retention, and reduce OPEX for the cellular operators.
This research addresses the detection problems in the view-point of DL and MEC. We build upon our previous work [21] and present an enhanced MEC-supported anomaly detection framework, executed at each MEC server monitoring a group of cells. The framework is based onL-layer feedforward deep neural network (DNN) that relies on real CDRs and aims to detect the anomalies with higher accuracy and lower false positive rate (FPR). In contrast to our rudimentary work [21], this extended research contains the following additional fea-tures, it:
1. Proposes MEC-based framework in which computa-tion is offloaded to MEC servers, distributed across the cellular network, for efficient and robust anomaly detection.
2. Utilizes an advanced optimization technique known as adaptive moment estimation (ADAM) as compared with its predecessor known as momentum. Compara-tive analysis of ADAM’s performance with previously used optimization method is also performed using var-ious additional measures: error rate, precision, recall and F1.
3. Introduces additional results to compare the training time of our model implemented by utilizing different optimization techniques.
4. Presents preprocessing algorithm, and explains the CDR data in more details with data visualization and a sample of raw CDR dataset to fully describe the DNN’s implementation.
Overall, this study makes the following contributions: 1. Applies an MEC-based DL framework that capitalizes
on several modern DL techniques from the literature, to attain optimal performance for each cell and reliefs CN of heavy computation.
2. Exploits historical data to infer past user behav-ior’s trend for anomaly detection in recently-collected 10-minute user activity log datum (test instance). 3. Integrates an extra feature by considering Internet
usage activity (neglected in the previous works) besides call and SMS, for a more robust framework.
The remainder of paper is organized as follows. Rele-vant work is summarized in Section II. Preliminaries to our DL based anomaly detection framework are explained in Section III. Framework’s implementation is described in SectionIV. Subsequently, results and framework’s per-formance evaluation are discussed in Section V. Finally, discussion on results and concluding remarks are drawn in SectionVI.
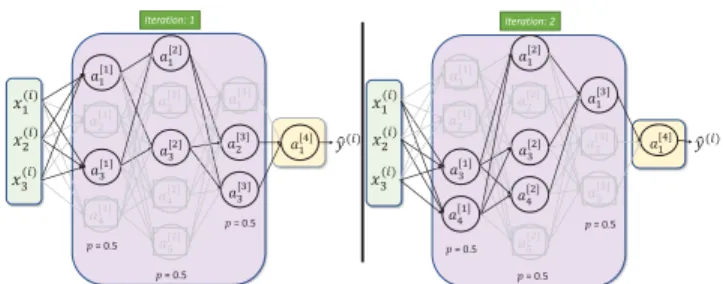
FIGURE 1. (a)System topology: The computation for anomaly detection is spread across the cellular infrastructure having a number of MEC servers (each collocated with a base station) that monitor user activities of a group of cells (depicted by blue, green and gray colors) by analyzing their call detail records (CDRs). The CDRs are generated at the core network (CN) and are sent to the relevant servers that perform data analytics. Upon detection of anomalous cell(s), the server communicates the anomalous cell ID(s) with the CN to initiate remedial actions.(b)MEC server’s functioning: Raw CDRs are preprocessed to have a feature vectorx(i). The vector is then passed to aL-layer feedforward deep neural network (DNN) that finally produces a predicted outputyˆ(i). Note, we exclude details on the parameters (wij[l]andb[il]) and also consider a single example for clarity.
II. RELEVANT WORK
Current and old cellular networks treat anomaly detection as an important issue due to its apparent benefits to the network operators and the users. It is addressed in the lit-erature by using variety of methods—mostly by utilizing various ML methods on some key performance indicators (KPIs) or measurements collected via minimize drive testing (MDT) feature of third generation partnership project (3GPP) release 10 [22].
Detection of sleeping cell engendered by hardware malfunction in the base station was carried out in [3], [23]–[26], in which catatonic sleeping cell (a cell in which user activity completely halts) was focused. On the other hand, [4], [27] oriented their studies to detect sleeping cell caused by RACH failure, in which crippled sleeping cell (a cell in which user traffic abates in contrast to nor-mal) was targeted. Imran et al.[2] reported 94% detection accuracy using k-nearest neighbor-based anomaly detection model. Masood et al. [28] proposed a deep learning(deep autoencoder)-based detector utilizing signal to interference plus noise ratio (SINR) and reference signal received power (RSRP) values of neighboring and serving BSs (extracted via MDT functionality). However, the above approaches only consider spatial data collected for a single time occur-rence that yields instantaneous detection of sleeping cells; therefore, the result could be transitory with a minute affect on QoS and may disappear by the time it is corrected [29, Sec. IV C]. Apart from sleeping cell, Ramneeket al.[8] worked on detection of congestion for QoS-enabled networks.
In contrast, following studies dealt with the problems by employing data analytics on CDR dataset and proposed a lighter ML-based solution as their method utilized the exist-ing data (CDRs) rather than KPIs; procurement of KPIs demands additional resources that burdens the network [1].
Parwezet al.[6] applied k-means and hierarchical clustering algorithms to detect soaring traffic (that may lead to conges-tion) in a cell by analyzing past one week data. Although the approach resulted in 90% accuracy, but it was time-inefficient as past one week data were considered to find the anomaly. Improving upon their work, [1] utilized a statistical-based semi-supervised ML approach to detect sleeping cell (both, catatonic and crippled) and the situation leading towards con-gestion in past hour’s data (having records for outbound and inbound call and SMS activities) by exploiting CDR dataset that had information about past several week’s user activities. They reported 92% accuracy; however, they also gained 14% false positive rate (FPR)—such a high FPR means that false alarms may waste a significant OPEX and resources.
As compared with the above works, our MEC-based solution utilizes data analytics (by incorporating past data with temporal features into the decision making, yielding in detecting long-term anomalies rather the instantaneous ones) and state-of-the-art techniques in DL literature to generate maximum accuracy and minimum FPR by analyzing each 10-minute CDR data-segment. The provided solution is (1) lighter for CN, as it is based on distributed deployment of MEC servers that distributes computation for anomaly detec-tion instead of burdening the CN; (2) agile, as it utilizes CDR dataset instead of requesting addition data from the network; (3) robust, as it incorporates an extra Internet activity feature, apart from call and SMS activities; and (4) high-precision, as it has lesser false alarms and higher accuracy.
III. PRELIMINARIES
A. TOPOLOGY OF SYSTEM, AND VISUALIZATION AND CHARACTERIZATION OF THE DATASET
Topology of system, shown in FIGURE1(with functioning of the MEC server) and fully portrayed in SectionIV, is estab-lished upon long term evolution - advanced (LTE-A) cellular
FIGURE 2. Data visualization: The spatiotemporal data are divided spatially into 100×100 cells across Milan city and temporally into 10-minute logs for a total of 62 days starting from 1st Nov., 2013 to 1st Jan., 2014.(a)An overlay of the 10,000 cells with Milan’s map (taken from Bing Maps). Each cell has a 235 m side length. A region, indicated by a red square, is zoomed-in for clarity.(b)Cell ID 5638, covering portion of a road alongside San Siro stadium, is shown.(c)and(d)illustrates user traffic activities of the cell ID 5638 in terms of SMS and call (both outbound and inbound), and Internet, respectively.
TABLE 1. Sample of raw CDR dataset from 1st January, 2014.
network [1, Fig. 1]. CDR dataset utilized in this study was generated at LTE-A’s CN and made available by Telecom Italia [30].
The geo-referenced spatiotemporal (CDR) data contain over 319 million user-activity records for a 100×100 cells spread across Milan, Italy. An overlay map of these 10,000 cells with Milan’s map is shown in FIGURE2(a). The dataset is temporally divided into 10-minute timestamps for a two-months duration from 1st Nov., 2013 to 1st Jan., 2014; provided in 62 files, each containing records of a single day. Each file contains on average 5.15 million records and each record contains five user-specific activity features: SMS incoming, SMS outgoing, call incoming, call outgo-ing and Internet usage. Some details pertainoutgo-ing to the sub-scriber—phone number, location and exact number (or unit) of each activity—are removed in order to preserve privacy. However, the provided quantity of activities is proportional to the real amount of activities [1]. A sample of the CDR dataset is given in Table1.
To visualize the dataset, we focus on cell ID 5638 that covers an area close to San Siro stadium in western Milan (FIGURE2(a) and (b)). Since the measurements of SMS and call activities (both inbound and outbound) have same scale [30], we extract and combine them for each hour and 62 days, illustrated in FIGURE2(c). Similarly, the Internet activity is depicted in FIGURE2(d). The annotated anomalous traffic activity spikes on 22nd Dec., 2013 correlates with an ongoing
soccer match [31]; the one on 1st Dec., 2013 is also due to an ongoing match, and is also evident in the results of [1, Fig. 7(a)] and [6, Table 1].
B. DATA PREPROCESSING AND SYNTHESIS
For each cell, day, and 10-minute timeslot in a 24-hours timeline; raw CDRs are pre-processed to extract the features that are then merged to create a vector x(i) ∈ R5 (here-after, referred as an instance), where i is the index of the example. DL model requires large number (hundreds or even
Algorithm 1Data Preprocessing
Inputs: CDRDataset: Raw dataset containing subscriber
activities, recorded for each 10-minute duration and stored in the form of 62 files, each file representing a single day.
CID: Identification number of the target cell.
TimeStampValues: Contains numeric values of the beginning
of every 10-minute time interval (in Unix epoch) during the intended 3-hours range.
Output:Xtotal
Method:
1:foreach filef inCDRDataset
2: Import filef and store its contents in a matrix. 3: Replace blanks with 0.0 (to avoid error in summing
NaN, in later steps).
4: Remove the column containing Country codes. 5: Update the matrix by storing entries only related to
CID.
6: Remove the column containing Cell ID. 7: foreach timestamptinTimeStampValues
8: Sum all inbound SMS activity values and store them asSMSin.
9: Sum all outbound SMS activity values and store them asSMSout.
10: Sum all inbound call activity values and store them asCALLin.
11: Sum all outbound call activity values and store them asCALLout.
12: Sum all Internet activity values and store them asInternet.
13: StoreSMSin,SMSout,CALLin,CALLout andInternetas one example in a vectorx. 14: Store examplexas a column entry in matrix
Xtotal.
15: end
16:end
17:returnXtotal.
thousands) of examples to work on, that may correspond to CDRs of more than a year; however, we only have a total of 62 examples (for each timeslot and corresponding to 62 days). To overcome this hindrance and for data aug-mentation, we consider all the examples in a 3-hours range as examples belonging to a single 10-minute timeslot. This yields a total of 1,116 examples (6 examples per hour× 3 hours×62 days) that are arranged in the form of a matrix Xtotal ∈ R5×1,116. Since human activities vary during
dif-ferent hours of a day; selection of a single 3-hours range would confine the interpretation of our results for only that range. Thus for a broader scope, we utilize three different ranges in our experiments: morning, from 6 to 9 am; after-noon, from 11 am to 2 pm; and evening, from 5 to 8 pm. The preprocessing method is summarized in Algorithm 1. The examples Xtotal are synchronously shuffled to have an
identical distribution and to increase the effectiveness of the algorithm [32, Ch. 8]. We then divide them into training set
with 781 examples (70% of the total) and test set having the remaining 335 examples.
Deep neural network (DNN) utilized in our research is based on supervised learning; hence, labeled dataset is com-pulsory for training and testing the model. Since output label y(i) ∈ R1 (for each example in the training and test sets) is missing in the CDR data, we synthetically generate it by using Euclidean norm. An examplex(i) is considered a point in 5-dimensional Euclidean space. The corresponding output labely(i)is marked 1 (anomaly) if the example’s norm kx(i)k2deviates more than the norm of one standard deviation (SD)σSD ∈ R5 from the meanµ ∈ R5: kµ−σSDk2 >
kx(i)k2>kµ+σSDk2; otherwise 0 (normal). Note, a higher SD means inclusion of more points as normal and having lesser anomalous points; this might not work well to detect performance deviations of a cell and hence we choose one SD. We can calculate the elements of mean and SD using the standard equations from statistics. We also utilize train set for this purpose. We arrange the corresponding labels of train and test set examples to form matricesYtrain ∈R1×781and
Ytest ∈R1×335, respectively.
C. PERFORMANCE METRICS
We employed several metrics for our model’s performance evaluation. Their values are calculated using the predicted test set outputYˆtest ∈ R1×335and its comparison with the
actual test set labelsYtest; and by using information from the
confusion matrix [33], comprised of the following:
• True positive (T+ve): number of examples labeled as
anomalies by the algorithm (in the predicted test set output) that are also anomalies according to the test set labels.
• True negative (T−ve): number of examples marked as
normal and are actually normal instances.
• False positive (F+ve): number of examples misclassified as anomalies.
• False negative (F−ve): number of examples mislabeled as normal instances.
Using confusion matrix, we calculate the following per-formance metrics: accuracy (prediction’s success rate), error rate, precision (fraction of positive instances that are truly positive), recall (fraction of T+ves from the total number
of positive examples), FPR (F+ves out of all the negative
examples), and F1(weighted harmonic mean of the precision and recall); by using the following equations [33]:
Accuracy= T+ve+T−ve T+ve+T−ve+F+ve+F−ve , (1) Error rate= F+ve+F−ve T+ve+T−ve+F+ve+F−ve =1−Accuracy,(2) Precision= T+ve T+ve+F+ve, (3) Recall= T+ve T+ve+F−ve , (4) FPR= F+ve F+ve+T−ve, (5)
and
F1=2 Precision×Recall
Precision+Recall. (6) D. SOFTWARE
The preprocessing and results are generated by exploit-ing MATLAB and the complete DNN is actualized usexploit-ing Python (programming language). Experimentation is per-formed in a commercial PC (i7-7700T CPU, 16GB RAM, and Windows 10 64-bit operating system).
IV. IMPLEMENTATION
In this section, we briefly discuss the implementation details of L-layer feedforward deep neural network (DNN), inte-grated in our anomaly detection framework and how it is trained for each individual cell—optimally tuned in terms of number of layers, number of units each hidden layer contains, weight initialization strategy, regularization, and optimiza-tion method to yield maximum performance. Once trained, the framework residing in the MEC server can utilize the DNN to detect anomalies in the testing phase: when CDRs arrive after every 10-min duration. The framework can occa-sionally re-train the network as the performance degrades over time.
A. DEEP LEARNING BASED ANOMALY DETECTOR
We apply L-layer feedforward DNN having an input layer l =0, hidden layers froml=1 toL−1 and an output layer L, illustrated in FIGURE1(b), whereL represents number of (hidden and output) layers in the network. Each layer has one or more units (represented by circles in the figure) that uses a non-linear activation function to produce the output. Functions like sigmoid, hyperbolic tangent (tanh), rectified linear unit (ReLU), and leaky ReLU (LReLU) are thoroughly discussed in our previous work [21]; while Swish—gated version of sigmoid activation function—is a new function, reported to yield better results as compared with ReLU [34]. It is mathematically expressed below:
Swish function:
g(z)=z×σ(z) (7) where, σ represents the sigmoid function. Sigmoid func-tion is utilized in the output layer and one of the afore-mentioned functions is applied in the hidden layers. The model schematics with forward and backward propagations are also explained in [21]. Once the parameters (weights and biases) are fine-tuned, the trained DNN uses forward propagation to predict the output Yˆtest by utilizing the test
set.
B. IMPROVING PERFORMANCE OF DNN
We leveraged different modern DL techniques in our frame-work, described below, to improve and render optimal performance.
FIGURE 3. Dropout on hidden layers of a 4-layer network during iterations 1 and 2.pis the retention probability.
1) WEIGHT INITIALIZATION METHODS
Gradient exploding or vanishing is a major problem faced during training phase due to inappropriate weight initializa-tion, that makes learning difficult for the model. Heedful selection of initialization strategy can cure this and improve DNN’s performance by assigning weight values that are neither too small nor too large [17, Ch. 6]. We experiment with the following weight initialization strategies: Common, Xavier, and He (explained in details in [21]) in this study.
2) REGULARIZATION
A fundamental challenge to DNN is of overfitting, in which the model performs well on training set but fails to generalize to new examples. Regularization, which refers to modifica-tion of the learning algorithm, is used to control overfitting and reduce the test error [32].L2regularization, also known as weight decay, is the most common type of regularization. It penalizes the square values of the weights in the cost function in order to drive all the weights to smaller values. Smaller values lead to simpler hypotheses, which are most generalizable [17].
Dropout [35] is another regularization technique in which neurons (along with their connections) are randomly shut down during training of a DNN; and hence at each itera-tion, a different model is trained that uses only a subset of the total neutrons. The dropped neurons do not contribute to the training in both forward and backward propagations. A better generalization to an unseen data can be achieved as this technique prevents the network to have dependency on any particular neuron by making its presence unreliable [36]. FIGURE3demonstrates dropout mechanism using a 4-layer network (for simplicity).
Our experiments embed the above-discussed regulariza-tion techniques in the DNN model.
3) OPTIMIZATION METHODS
ADAM [37] is one of the most effective adaptive learning rate optimization algorithm for training a DNN that com-bines ideas from momentum (described in detail in [21]) and RMSProp (another optimization method for the details of which, readers can refer to [38]). ADAM uses the following update rule for weightW[l]:
W[l]=W[l]−α v corrected dW[l] q scorrected dW[l] + (8)
TABLE 2. Hyperparameters’ values utilized in this study for different optimization methods.
where, vcorrected
dW[l] and s corrected
dW[l] (given below) are bias
cor-rections, of first moment and second raw moment esti-mates, respectively, to account for their zero initialization [32, Ch. 8], [37]; andis a small number added for numerical stability. vcorrecteddW[l] = vdW[l] 1−(β1)t (9) scorrecteddW[l] = sdW[l] 1−(β2)t (10)
where, vdW[l] and sdW[l] (given below) are exponentially
weighted moving averages of historical gradient and the squared gradient, respectively;t counts the steps carried by ADAM update; andβ1, β2∈[0,1) are hyperparameters that control the two averages.
vdW[l] =β1vdW[l]+(1−β1)dW[l] (11)
sdW[l] =β2sdW[l]+(1−β2) (dW[l])2 (12)
The update rule for bias parameter b[l] is similar to the above rule. We implement ADAM in our DNN model and compare its test performance (in terms of various metrics mentioned in Sec.III-C) with gradient descent (GD), mini-batch GD, and momentum. For this purpose, the hyperparam-eter values mentioned in Table 2are used, along with = 1×e−8(suggested default value [32, Ch. 8]). Additionally, we investigate their training time.
V. EXPERIMENTAL RESULTS AND PERFORMANCE EVALUATION
We present various experimental results in this section. Although the CDR dataset contains records pertaining to 10,000 cells, our DNN model performs anomaly detection for a single cell at a time. To demonstrate robustness and transferability of our model, we present results based (aver-aged) on randomly chosen 1,000 cell IDs out of the total 10,000 cell IDs (available in Milan dataset). In addition, we also present results processed by using a small subset (up to ten cell IDs) for a detailed analysis and compari-son. Note that mentioning of morning, afternoon or evening followed by a cell ID indicates that the model is trained
TABLE 3.Performance statistics of our anomaly detector utilizing mini-batch GD with ADAM and its comparison with Momentum.
and tested on a corresponding 3-hours range data (discussed in Sec.III-B).
A. NUMBER OF LAYERS AND HIDDEN UNITS
The performance of a DNN can vary across the spectrum ofL andn[hl]. In practice, framework would search for their optimum values that yield maximum accuracy for each cell by empirically evaluating their impact on the test accuracy of our DNN. To demonstrate this, we varyL from 2 to 20 andn[hl]from 1 to 50 using data from cell IDs 1 (Afternoon hours), 1943 (Evening hours), 5638 (Morning hours), and 9607 (Evening hours)—due to the inadequate space, we only show outcomes of these four randomly chosen cell IDs.
Our empirical results in the form of heatmaps, illustrated in FIGURE 4, elucidates the impact of various settings of n[hl] and L on the test accuracy. We also highlighted three particular examples signifying maximum accuracies. It can be seen that deeper layer having moderate number of hidden units yield the highest accuracy. Dual maximum accuracies imply that one might be computationally efficient to attain than other. For simplicity, we setL andn[hl] to 17 and 25, respectively, for our further experiments (for all cell IDs). B. ACTIVATION FUNCTIONS
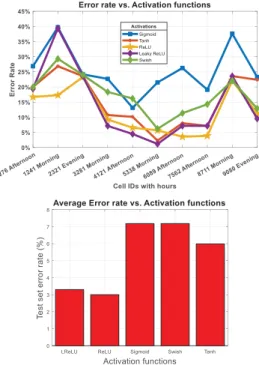
We run our model with mini-batch GD having hyperparame-ter values listed in Table2, to find an activation function that yields maximum performance. FIGURE5(top) and (bottom) illustrates the effect of utilizing various activation functions in terms of error rate by using a subset of total cell IDs
FIGURE 4. Test accuracies for cell IDs 1 (Afternoon hours), 1943 (Evening hours), 5638 (Morning hours), and 9607 (Evening hours) for various configurations ofn[l]
h (number of hidden unit(s) per hidden layer) andL(number of layers).
FIGURE 5. Impact of utilizing various activations in hidden layers on DNN’s performance.
and 1,000 cell IDs, respectively. We can clearly observe that sigmoid achieved the feeblest performance with highest error rate for most of the cell IDs in FIGURE5(top) while Swish also yielded overall poor performance that is evident in FIGURE5(bottom). Interestingly, for cell ID 2321, all the
FIGURE 6. Effects of using various weight initialization techniques on DNN’s performance.
activations performed uniformly. Overall, ReLU surpassed other activation functions as evident in both of the figures and hence we choose ReLU for further experiments.
C. WEIGHT INITIALIZATIONS
We continue with our previous model configuration and the randomly chosen cell IDs, and initialize weights according to Common, Xavier, and He initialization methods (explained in details in [21]). We also set ReLU activation in hidden layers for this purpose, as discussed previously. FIGURE6 exem-plifies the impact of selecting various weight initialization schemes on DNN’s test accuracy. We can observe that He surpassed other initialization strategies and yielded highest average accuracy.
FIGURE 7. Influence of using different optimization methods on various DNN’s performance metrics.
FIGURE 8. Average training time analysis of different optimization methods.
D. OPTIMIZATION TECHNIQUES
The superiority of mini-batch GD with momentum and ADAM over ordinary batch GD is clear in FIGURE 7. Although, in cell ID 4671, momentum has slightly bet-ter performance than ADAM but overall mini-batch GD with ADAM surpassed all other optimization techniques. It accomplished highest accuracy, recall, and F1; and also, lowest error rate and FPR in most of the cells. Note, for cell ID 7816, ADAM achieved a perfect performance.
In Table3, we report various performance measures of our anomaly detector, averaged over the results from randomly selected 1,000 cell IDs, along with the improvement we got by utilizing ADAM as compared with the momentum. As compared with our previous work [21] in which we uti-lized mini-batch GD with momentum for anomaly detection, we achieved significant performance improvements by utiliz-ing mini-batch GD with ADAM in this paper.
E. TRAINING TIME
Another advantage of utilizing ADAM is faster training time that is evident in FIGURE8in which we compare the aver-age training time of our model utilizing all the discussed optimization methods. Mini-batch GD with momentum con-sumes maximum training time, while ADAM deplete the lowest, and is the most suitable optimization method.
VI. CONCLUSION AND INSIGHTS FOR FUTURE WORK
Performance-wise, our MEC-based DL framework eclipsed the previous anomaly detection methods [1], [2], [6]. It can potentially improve network’s QoS and user’s QoE; and trun-cate OPEX for the network operators. Our proposed frame-work accomplished 0.44% FPR (Table 3), a significantly reduced value as compared with the reported 14% in [1]; and 98.8% accuracy, a great improvement as compared with the reported 94% accuracy in [2].
Our study endorses the concept of harnessing the largely untapped CDRs (using big data analytics) instead of utiliz-ing traditional measurements and analytical approaches for the network analysis [1], [15]. Our research’s main inno-vation is the incorporation of the Internet activity feature (disregarded in previous works [1], [6]) that makes our research more robust as our DL framework can detect anoma-lies pertaining to a situation when Internet activity swiftly rises/declines but the call and SMS activities are normal. An example of such situation could be an abruptly increased Internet activity during a music festival inferring a neces-sity of additional network resource allotment. In addition, MEC-based approach reliefs core network from heavy com-putation tasks, offloaded to various MEC servers spread across the network.
A deterrent in practical implementation of our deep learn-ing approach is the requirement of deluge of examples to extract a meaningful pattern in the CDR data; however, uti-lizing larger dataset—the acquisition of which is another issue due to privacy concerns—can surmount the difficulty. We can then preprocess the dataset using more sophisticated software: Apache Hadoop or Spark [1]. Another restraint on fully employing our approach is the possession of labeled data due to the supervised nature of our algorithm; affixing fault data, generated at the core network and containing historical alarms’ logs [2], with CDRs and then labeling them accord-ingly can overcome this restraint.
The timestamp interval of 10 minutes is crucial for the results and hence more variation could be tested in the future studies to determine the impact of increasing the time dura-tion granularity to perform more coarse-grained analysis, i.e. take three 10-min intervals instead of just one; or the granularity can also be decreased to perform more fine-grained analysis, i.e. by considering even smaller than a single 10-minute interval (the practical LTE network can be set to generate CDR dataset in such settings). Hence it will be an interesting future direction that could be explored. In this connection, our previous work considered [1] a 1-hour interval instead of 10 minutes—we combined six 10-minute timestamp activities—and detected anomalies in the 1-hour user activity data by using semi-supervised machine learning method. In the current research work, we however chose to decrease the interval so that the anomaly detection could be performed quickly and hence the remedial or diagnostic actions could be taken sooner.
Because of the potential of upcoming cellular networks to have an AI-empowerment, the implemented algorithms need to be quicker, increasingly proficient and less perplexing: future works can explore meliorative methods. We can also extend our study for anomaly detection in Internet of things (IoT) [39]; however, due to the limited resources (such as power consumption) the IoT devices might have entirely different activity pattern that will need more examination. With rising fame of DL technology, which has an enormous potential for utility in 5G networks, our work applies DL to accomplish substantial performance betterments for abnor-mality detection. This indicates reduction in OPEX for cel-lular operators along with an improvement in the network’s QoS and user’s QoE.
REFERENCES
[1] B. Hussain, Q. Du, and P. Ren, ‘‘Semi-supervised learning based big data-driven anomaly detection in mobile wireless networks,’’China Commun., vol. 15, no. 4, pp. 41–57, Apr. 2018.
[2] A. Imran, A. Zoha, and A. Abu-Dayya, ‘‘Challenges in 5G: How to empower SON with big data for enabling 5G,’’IEEE Netw., vol. 28, no. 6, pp. 27–33, Nov./Dec. 2014.
[3] F. Chernogorov, J. Turkka, T. Ristaniemi, and A. Averbuch, ‘‘Detection of sleeping cells in LTE networks using diffusion maps,’’ inProc. IEEE 73rd Veh. Technol. Conf. (VTC Spring), Yokohama, Japan, May 2011, pp. 1–5. [4] F. Chernogorov, S. Chernov, K. Brigatti, and T. Ristaniemi, ‘‘Sequence-based detection of sleeping cell failures in mobile networks,’’Wireless Netw., vol. 22, no. 6, pp. 2029–2048, Aug. 2016.
[5] Sandvine, ‘‘Network congestion management: Considerations and tech-niques, version 2.0,’’ Sandvine, Waterloo, ON, Canada, White Paper, 2015. [Online]. Available: https://www.sandvine.com/hubfs/downloads/ archive/whitepaper-network-congestion-management.pdf
[6] M. S. Parwez, D. Rawat, and M. Garuba, ‘‘Big data analytics for user-activity analysis and user-anomaly detection in mobile wireless network,’’
IEEE Trans. Ind. Informat., vol. 13, no. 4, pp. 2058–2065, Aug. 2017. [7] Y. Li, B. Shen, J. Zhang, X. Gan, J. Wang, and X. Wang, ‘‘Offloading in
HCNs: Congestion-aware network selection and user incentive design,’’
IEEE Trans. Wireless Commun., vol. 16, no. 10, pp. 6479–6492, Oct. 2017. [8] Ramneek, P. Hosein, W. Choi, and W. Seok, ‘‘Congestion detection for QoS-enabled wireless networks and its potential applications,’’J. Com-mun. Netw., vol. 18, no. 3, pp. 513–522, Jun. 2016.
[9] Case Study: P3 Insights Help Swiss Operator Rise to the Top of the Mobile Network Pack, P3 Commun., Case Study, Aachen, Germany, Aug. 2017. [10] V. Chandola, A. Banerjee, and V. Kumar, ‘‘Anomaly detection: A survey,’’
ACM Comput. Surv., vol. 41, no. 3, pp. 15:1–15:58, 2009.
[11] Y. Wang, Z. Wu, Q. Li, and Y. Zhu, ‘‘A model of telecommunication network performance anomaly detection based on service features clus-tering,’’IEEE Access, vol. 5, pp. 17589–17596, Mar. 2017.
[12] S. Papadopoulos, A. Drosou, and D. Tzovaras, ‘‘A novel graph-based descriptor for the detection of billing-related anomalies in cellular mobile networks,’’IEEE Trans. Mobile Comput., vol. 15, no. 11, pp. 2655–2668, Nov. 2016.
[13] W. Sun, X. Qin, S. Tang, and G. Wei, ‘‘A QoE anomaly detection and diagnosis framework for cellular network operators,’’ inProc. IEEE Conf. Comput. Commun. Workshops (INFOCOM WKSHPS), Hong Kong, China, Apr./May 2015, pp. 450–455.
[14] J. Hoy, Forensic Radio Survey Techniques for Cell Site Analysis. Chichester, U.K.: Wiley, 2015.
[15] A. Zoha, A. Saeed, H. Farooq, A. Rizwan, A. Imran, and M. A. Imran, ‘‘Leveraging intelligence from network CDR data for interference aware energy consumption minimization,’’IEEE Trans. Mobile Comput., vol. 17, no. 7, pp. 1569–1582, Jul. 2018.
[16] S. Jiang, J. Ferreira, and M. C. Gonzalez, ‘‘Activity-based human mobility patterns inferred from mobile phone data: A case study of Singapore,’’
IEEE Trans. Big Data, vol. 3, no. 2, pp. 208–219, Jun. 2017.
[17] J. Patterson and A. Gibson, Deep Learning. Sebastopol, CA, USA: O’Reilly Media, 2017.
[18] Y. LeCun, Y. Bengio, and G. Hinton, ‘‘Deep learning,’’Nature, vol. 521, no. 7553, pp. 436–444, May 2015.
[19] Y. Mao, C. You, J. Zhang, K. Huang, and K. B. Letaief, ‘‘A survey on mobile edge computing: The communication perspective,’’IEEE Commun. Surveys Tuts., vol. 19, no. 4, pp. 2322–2358, 4th Quart., 2017.
[20] E. Ahmed, A. Ahmed, I. Yaqoob, J. Shuja, A. Gani, M. Imran, and M. Shoaib, ‘‘Bringing computation closer toward the user network: Is edge computing the solution?’’IEEE Commun. Mag., vol. 55, no. 11, pp. 138–144, Nov. 2017.
[21] B. Hussain, Q. Du, and P. Ren, ‘‘Deep learning-based big data-assisted anomaly detection in cellular networks,’’ inProc. IEEE Global Commun. Conf. (GLOBECOM), Abu Dhabi, UAE, Dec. 2018, pp. 1–6.
[22] W. A. Hapsari, A. Umesh, M. Iwamura, M. Tomala, B. Gyula, and B. Sebire, ‘‘Minimization of drive tests solution in 3GPP,’’IEEE Commun. Mag., vol. 50, no. 6, pp. 28–36, Jun. 2012.
[23] J. Turkka, F. Chernogorov, K. Brigatti, T. Ristaniemi, and J. Lem-piäinen, ‘‘An approach for network outage detection from drive-testing databases,’’J. Comput. Netw. Commun., vol. 2012, pp. 1–13, Sep. 2012, Art. no. 163184.
[24] A. Zoha, A. Saeed, A. Imran, M. A. Imran, and A. Abu-Dayya, ‘‘A SON solution for sleeping cell detection using low-dimensional embedding of MDT measurements,’’ inProc. IEEE 25th Annu. Int. Symp. Pers., Indoor, Mobile Radio Commun. (PIMRC), Washington, DC, USA, Sep. 2014, pp. 1626–1630.
[25] A. Zoha, A. Saeed, A. Imran, M. A. Imran, and A. Abu-Dayya, ‘‘Data-driven analytics for automated cell outage detection in self-organizing net-works,’’ inProc. 11th Int. Conf. Design Reliable Commun. Netw. (DRCN), Kansas City, MO, USA, 2015, pp. 203–210.
[26] C. M. Mueller, M. Kaschub, C. Blankenhorns, and S. Wanke, ‘‘A cell outage detection algorithm using neighbor cell list reports,’’ in Proc. Self-Organizing Syst. 3rd Int. Workshop (IWSOS), Vienna, Austria, 2008, pp. 218–229.
[27] F. Chernogorov, S. Chernov, K. Brigatti, and T. Ristaniemi, ‘‘Sequence-based detection of sleeping cell failures in mobile networks,’’ Jan. 2015,
[28] U. Masood, A. Asghary, A. Imrany, and A. N. Mian, ‘‘Deep learning based detection of sleeping cells in next generation cellular networks,’’ inProc. IEEE Global Commun. Conf. (GLOBECOM), Dec. 2018, pp. 206–212. [29] A. Asghar, H. Farooq, and A. Imran, ‘‘Self-healing in emerging cellular
networks: Review, challenges, and research directions,’’IEEE Commun. Surveys Tuts., vol. 20, no. 3, pp. 1682–1709, 3rd Quart., 2018.
[30] Telecommunications—SMS, Call, Internet—MI. Accessed: Sep. 1, 2019. [Online]. Available: https://dandelion.eu/datagems/SpazioDati/telecom-sms-call-internet-mi/description/
[31] Palacio Wins Milan Derby for Inter. Accessed: Sep. 1, 2019. [Online]. Available: http://www.chinadaily.com.cn/sports/2013-12/23/ content_17190655.htm
[32] I. Goodfellow, Y. Bengio, and A. Courville,Deep Learning, Cambridge, MA, USA: MIT Press, 2016.
[33] R. Bali, D. Sarkar, B. Lantz, and C. Lesmeister,R: Unleash Machine Learning Techniques. Birmingham, U.K.: Packt Publishing, 2016. [34] P. Ramachandran, B. Zoph, and Q. V. Le, ‘‘Searching for
acti-vation functions,’’ Oct. 2017, arXiv:1710.05941. [Online]. Available: https://arxiv.org/abs/1710.05941
[35] N. Srivastava, G. Hinton, A. Krizhevsky, I. Sutskever, and R. Salakhutdinov, ‘‘Dropout: A simple way to prevent neural networks from overfitting,’’J. Mach. Learn. Res., vol. 15, no. 1, pp. 1929–1958, 2014.
[36] N. Buduma and N. Lacascio,Fundamentals of Deep Learning. Sebastopol, CA, USA: O’Reilly Media, 2017.
[37] D. Kingma and J. Ba, ‘‘Adam: A method for stochastic optimization,’’ inProc. Int. Conf. Learn. Representations. San Diego, CA, USA, 2015, pp. 1–15.
[38] T. Tieleman and G. Hinton, ‘‘Neural networks for machine learning: Lec-ture 6.5 RMSProp,’’ Tech. Rep., 2012.
[39] Q. Du, H. Song, and X. Zhu, ‘‘Social-feature enabled communications among devices toward the smart IoT community,’’IEEE Commun. Mag., vol. 57, no. 1, pp. 130–137, Jan. 2019.
BILAL HUSSAIN(S’10) received the B.E. degree (Hons.) in electrical engineering from Bahria Uni-versity, Pakistan, in 2010, and the M.Sc. degree in information and communications engineering from the University of Leicester, U.K., in 2011. He worked for several years in the academia as a Lecturer. He is currently pursuing the Ph.D. degrees in information and communications engi-neering with Xi’an Jiaotong University, China, and The Hong Kong Polytechnic University [under a Dual Doctor of Philosophy (Ph.D.) Program]. His broader research interests include applications of artificial intelligence and big data analytics in wire-less communication systems (6G/5G mobile networks), mobile edge and fog computing in cellular systems, and cyber-physical system (CPS) security.
QINGHE DU (S’09–M’12) received the B.S. and M.S. degrees from Xi’an Jiaotong University, China, and the Ph.D. degree from Texas A&M University, USA. He is currently a Professor with the Information and Communications Engineering School, Xi’an Jiaotong University. He has pub-lished over 100 technical articles. His research interests include mobile wireless communications and networking, with an emphasis on machine learning and artificial intelligence over wireless networks, statistical quality-of-service provisioning, secure wireless trans-missions, and 5G/B5G/6G networks. He received the Best Paper Award at the IEEE GLOBECOM 2007 and the Best Paper Award ofChina Commu-nications, in 2017. He serves/has served as an Associate Editor for the IEEE COMMUNICATIONSLETTERSand an Editor forKSII Transactions on Internet and Information Systems. He serves as the Technical Program Co-Chair for the IEEE/CIC ICCC Workshop on Internet of Things (IoT), from 2013 to 2017, the Track Co-Chair for IIKI, from 2015 to 2019, and the Publicity Co-Chair for the IEEE ICC 2015 Workshop on IoT/CPS-Security, the IEEE GLOBECOM 2011, and so on. He has also served as the Technical Pro-gram Committee Member for many world-renowned conferences, including the IEEE INFOCOM, GLOBECOM, ICC, PIMRC, and VTC.
SIHAI ZHANG received the Ph.D. degree from the Department of Computer Science and Tech-nology, University of Science and Technology of China (USTC), Hefei, China, in 2006. He has been with the PCNSS Laboratory, Department of Electronic Engineering and Information Sci-ence, USTC, since 2009. He is currently an Asso-ciate Professor of electronic engineering with the Department of Electronic Engineering and Infor-mation Science, USTC. He has authored or coau-thored over 60 technical articles, such as the IEEE TETC, the IEEE TVT, MONET, and WPC. He initiated the research field of wireless big data, in 2014. He has participated in projects, including the National Science Foundation of China for Machine Type Communications and the Key Pro-gram of the National Natural Science Foundation of China for Wireless Big Data. His research interests include wireless networks, big data analysis, and intelligent algorithms. He has served over 15 international conferences as a member of organizing committee, a TPC Member, or a Reviewer, such as the Publication Chair for WCSP 2014. In 2016, he has co-chaired special sessions on Wireless Big Data in WCSP 2016 and Machine Type Communications in WPMC 2016 and was a Guest Editor of Special Issue on Wireless Big Data for JCIN.
ALI IMRANwas a Research Scientist with QMIC, Qatar, for three years. From October 2007 to Octo-ber 2011, he was with the Institute of Commu-nications Systems (5GIC), University of Surrey, U.K. In that position, he has contributed to a num-ber of pan-European and international research projects while working in close collaboration with key industrial players. He is currently the Found-ing Director of the AI4Networks Research Lab, University of Oklahoma (OU), where he is leading several multinational and industry lead projects on artificial intelligence (AI) for wireless networks. He is also the Co-Founder of a start-up AISON. His research on AI-enabled wireless networks has played pioneering role in this emerging area and has been supported by U.S. $4M in nationally and internationally competitive research funding. He has published over 100 refereed journal and conference articles and has several patents granted and pending.
Dr. Imran is also an Associate Fellow of the Higher Education Academy (AFHEA), U.K., the President of the ComSoc Tulsa Chapter, a member of the Advisory Board for the Special Technical Community on Big Data at the IEEE Computer Society, and a Board Member of ITERA. He received several prestigious awards, such as the IEEE Green ICT YP Award, in 2017, the VPR Outstanding International Impact Award at OU, in 2017, and the Best Paper Award of the IEEE CAMAD 2013. In 2018, he has been named the William H. Barkow Presidential Professor at OU. He is routinely invited to serve as an Advisor to key stakeholder in cellular network ecosystem and as a Speaker and a Panelist on international industrial fora and academic conferences on this topic. For more details, see www.ali-imran.org.
MUHAMMAD ALI IMRAN (M’03–SM’12) received the M.Sc. (Hons.) and Ph.D. degrees from Imperial College London, London, U.K., in 2002 and 2007, respectively. He is currently the Vice Dean of the Glasgow College, UESTC, and a Professor of communication systems with the School of Engineering, University of Glasgow. He is also an Affiliate Professor with the University of Oklahoma, Norman, OK, USA, and a Visiting Professor with the 5G Innovation Centre, Univer-sity of Surrey, Guildford, U.K. He has more than 20 years of combined academic and industry experience, working primarily in the research areas of cellular communication systems. He has authored or coauthored more than 400 journals and conference publications and has been a Principal or
Co-Principal Investigator on more than 10 million in sponsored research grants and contracts. He has supervised more than 40 successful Ph.D. graduates. He holds 15 patents. He is a Fellow of IET and a Senior Fellow of the Higher Education Academy (SFHEA), U.K. He was a recipient of the Award of Excellence in recognition of his academic achievements, conferred by the President of Pakistan, the IEEE ComSocs Fred Ellersick Award, in 2014, the FEPS Learning and Teaching Award, in 2014, and the Sentinel of Science Award, in 2016. He was twice nominated for the Tony Jeans Inspirational Teaching Award. He was a shortlisted finalist for The Wharton-QS Stars Awards, in 2014, the QS Stars Reimagine Education Award, in 2016, for innovative teaching, and the VCs Learning and Teaching Award at the University of Surrey.