Degree Programme in Industrial Engineering and Management
Amir Mostafa Heidari
Exploration of Big Data in Procurement - Benefits and
Challenges
Master’s Thesis
Espoo, April 23, 2018
Supervisor: Professor Kari Tanskanen
Thesis advisor: Doctor Riikka Kaipia
2
Aalto University, P.O. BOX 11000, 00076 AALTO www.aalto.fi Abstract of master's thesis
Author Amir Mostafa Heidari
Title of thesis Exploration of Big Data in Procurement – Benefits and Challenges
Master’s programme Industrial Engineering and Management
Thesis Supervisor Professor Kari Tanskanen
Major or Minor/Code Operations and Service Management / SCI 3049
Department Industrial Engineering and Management
Thesis Advisor D.Sc. Riikka Kaipia
Date 23.04.2018 Number of pages 67 Language English
Abstract
Emergence of Big Data had positive implications in various industries and businesses. Big Data analytics provides the ability to harness massive amount of data for decision making purposes. One of the important use case of Big Data analytics is in supply chain management. Increased visibility, enhanced bargaining position in negotiations, better risk management and informed decision making are examples of benefits gained from Big Data analytics in supply chain. Although there are advances in analytics application throughout supply chain management, sourcing applications are lagging behind other functions of supply chain. The purpose of this study is to analyse use cases of exploiting Big Data for purchasing and supply purposes, in order to help companies having more visibility over the supply market. Data collection in this study was carried out through the use of semi-structured interviews which then were coded and categorized for comparison.
The results pointed out that big data aids in identifying new suppliers. Additionally, having transparency over n-tier suppliers for managing risks were important for companies. Most of the companies are using descriptive analytics. However, they expected to have predictive analytics to become aware of market situation and gain better position in negotiations. Furthermore, this research showed that to prevent supply disruptions, the Big Data analytics should send timely warnings to managers. The main expectations from Big Data analytics are gaining transparency, automation of data collection and analysis, prediction, availability of new data sources, more efficient KPIs and better representation of data. The main hurdle in Big Data initiative is unintegrated and non-homogenous internal data.
3
Acknowledgement
I wish to thank my supervisor professor Kari Tanskanen for introducing me to this project and for having his office door open whenever I had a question. Also I would like to thank my advisor doctor Riikka Kaipia for her guidance throughout the process of this thesis and for her aid in finding case companies of this research. Finally I would like to thank my family for their unconditional support throughout my years of study.
4
Table of Contents
Abstract ... 2
Acknowledgement ... 3
List of figures and tables ... 6
List of abbreviations ... 7
1 Introduction ... 8
1.2 Research gap... 9
1.3 Research objective and research questions ... 10
1.4 Research methodology ... 10
1.4 Structure of the study ... 10
2 Literature review ... 12
2.1 What is Big Data? ... 12
2.2 Business analytics and Big Data analytics ... 14
2.3 Types of analytics ... 16
2.4 Big Data analytics in supply chain management ... 17
2.4.1 Implications of 3Vs in supply chain ... 18
2.4.2 Key success factors of implementing Big Data in supply chain ... 19
2.4.3 Benefits of Big Data in supply chain management ... 22
2.4.4 Challenges of Big Data in supply chain management ... 22
2.4.5 Analytics application in supply chain ... 24
2.5 Procurement and Big Data ... 25
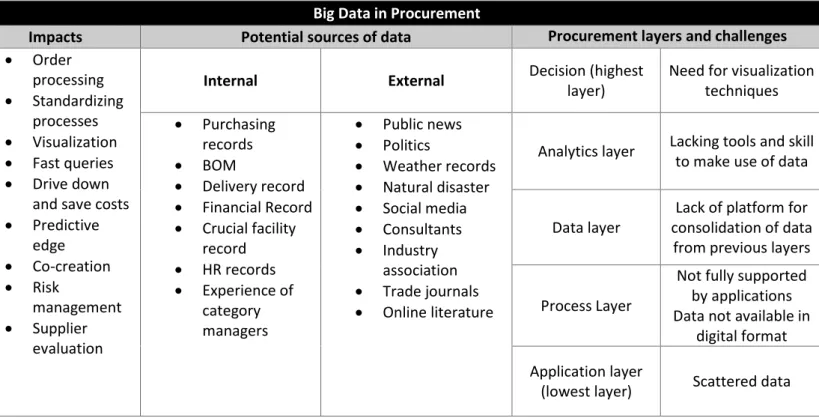
2.5.1 Impact on procurement ... 27
2.5.2 Potential sources of data ... 29
2.5.3 Type of analytics needed ... 30
2.5.4 Current state of procurement and Big Data analytics ... 31
2.6 Literature synthesis ... 33
3 Research methodology ... 36
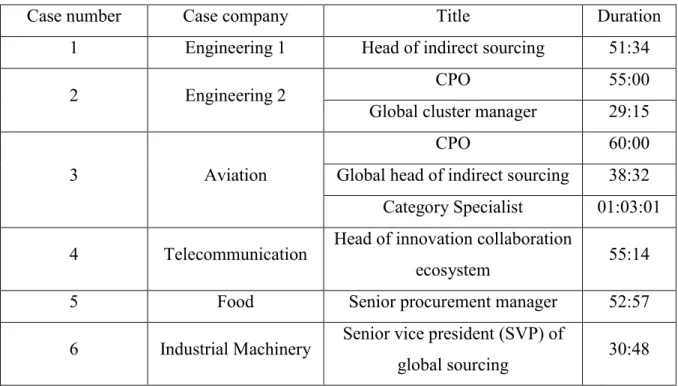
3.1 Case selection and data collection ... 36
3.2 Data analysis ... 38
4 Analysis and results ... 39
4.1 Supply base ... 41
4.1.1 Supplier identification ... 41
4.1.2 Transparency over n-tier suppliers ... 44
4.2 Data analytics current state ... 45
4.3 Desired state ... 49
5
4.5 Risks of Big Data analytics and trusting Big Data analytics ... 56
5 Discussion and conclusion ... 58
5.1 Answering research questions... 58
5.2 Limitations and future research ... 62
6
List of figures and tables
Figures
Figure 1 Big Data 5Vs (modified from Demchenko et al, 2013) ... 13
Figure 2 Taxonomy of data in supply chain (Rozados et al, 2014) ... 18
Figure 3 Analytics Across Supply Chain (modified from Sanders, 2016) ... 24
Figure 4 Layers of procurement (modified from Rafati & Poels, 2015) ... 33
Tables
Table 1 Synthesis of Big Data and analytics ... 34Table 2 Potential of Big Data in supply chain ... 34
Table 3 Big Data in procurement ... 35
Table 4 Interviews... 37
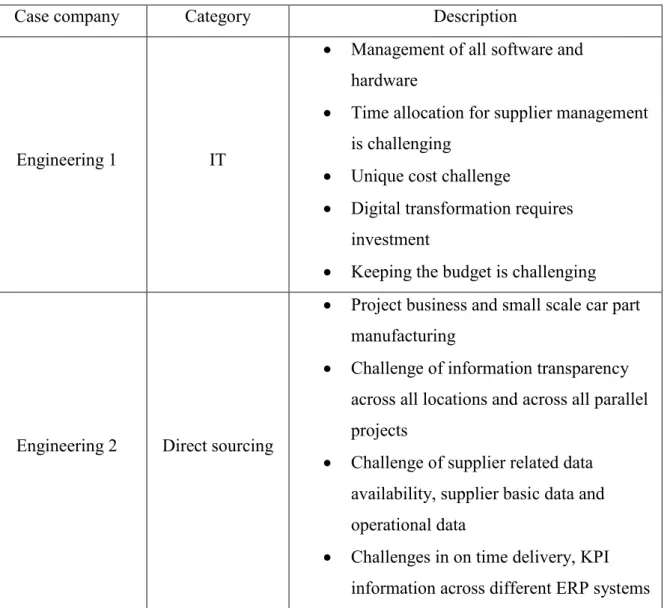
Table 5 Description of case companies ... 39
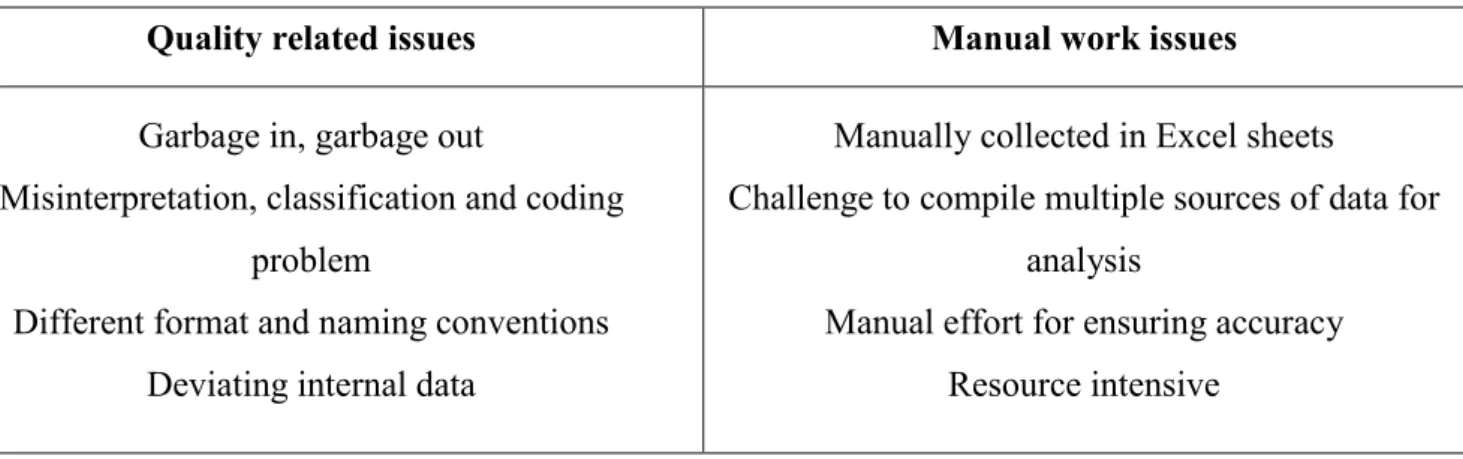
Table 6 Internal data challenges ... 48
Table 7 Expectations from Big Data Analytics ... 54
7
List of abbreviations
AI B2B BI BI&A BOM CPFR CPO CRM DPB EDI ERP HP HR IBM IT KPI OLAP PO RFx ROI SCM SVP TCO Artificial Intelligence Business to Business Business IntelligenceBusiness Intelligence Analytics Bill of Material
Collaborative Planning, Forecasting and Replenishment Chief Procurement Officer
Customer Relationship Management
Data Science, Predictive Analytics and Big Data Electronic Data Interchange
Enterprise Resource Planning Hewlett-Packard
Human Resources
International Business Machines Corporation Information Technology
Key Performance Indicator Online Analytical Processing Purchase Order
Request for Information/Proposal/Quotation Return on Investment
Supply Chain Management Senior Vice President Total Cost of Ownership
8
1 Introduction
Big Data is the hot trend in today’s world that can benefit many industries and businesses. In this study the focus has been particularly set on potential benefits that procurement and sourcing can reap from Big Data analytics implementation but first we need to understand what Big Data is. There are many definitions for Big Data. The Big Data term comes from massive volume of accessible data, that has high velocity in generation of data and transferring that comes from variety of different sources. These sources of data range from omnipresent smart devices of consumers to manufacturing and logistics processes that can be captured thanks to IoT technology. Although Big Data is no longer considered a black box among firms, still its usefulness is not fully understood. Big Data is being exploited for scientific and industry related purposes and supply chain management is no exception. Considering supply chain from upstream players to downstream players, there are lots of operations that generate data which can be used for improving efficiency, gaining transparency and finally leading to competitive advantage. Walmart and Amazon are examples of firms with modern supply chains that implemented analytics capability in their supply chains. Nevertheless, not every firm has adopted this technology. In addition to that, not all functions of supply chain make use of Big Data with same extent.
Companies are focusing more on their core competencies and outsource their non-core operations to gain better margins. With globalization, outsourcing is going beyond continents. Design can be done in one part of world, manufacturing in another low cost country and distribution among other countries in the world. Considering that substantial percentage of a firm’s resources are external resources, its importance has moved procurement from a function working in silo to a strategic function. Procurement is becoming a central function that needs to be coordinated with all other functions. Furthermore, significant amount of a firm’s revenue goes for its procurement. This exhibits importance of procurement in a firm’s bottom-line. Therefore, there are great opportunities for procurement to make use of data. Procurement is behind other functions of a firm in terms of analytics and recently it is gaining more attention.
This research tries to find out how Big Data capabilities can help procurement in sounder decision making. One of the studied aspects was supply base, in order to understand if there are opportunities in identification of new suppliers and monitoring more than immediate suppliers in value chain. Managing suppliers in a global supply chain is a challenging task that Big Data can provide transparency and control towers to facilitate it. Another studied aspect is
9
having access to greater pool of data and what kind of potential data procurement can benefit from. Supply professionals were interviewed to understand what they expect from their procurement systems and how Big Data can contribute to that. What kind of transparency is needed? What needs to be automated? What representation of data is useful? Furthermore, how Big Data can help in procurement risk management. Additionally, the value of social media and issue of trusting data analytics were studied. Nevertheless, there are hurdles in implementation of Big Data analytics that required consideration.
1.2 Research gap
Researches conducted on Big Data’s impact on supply chain have mostly addressed the issue with a holistic view of supply chain. With presence of smart phones and IoT sensors, great focus has been placed on modelling behaviour of customers on demand side, logistics and manufacturing efficiency. When it comes to Big Data and advanced analytics, procurement as mentioned by Sanders (2016) is behind development and research compared to other functions of supply chain even though substantial amount of revenue goes for procurement. Certainly, for a company to succeed in its analytic journey, all of its functions should keep up with each other in implementing Big Data analytics. The literature that addresses Big Data analytics in procurement are quite limited. Sanders (2016) explains Big Data benefits and hurdles in the whole supply chain and all functions of a firm. However, he touches procurement briefly. Richey et al (2016) explores Big Data in supply chain through case studies and studies procurement briefly. Nevertheless, the success factors of analytics identified by Richey et al (2016) is true in Big Data analytics of procurement as well. Similarly, Weng et al (2016) studies Big Data in logistics and supply chain with a brief note on procurement. (Sanders, 2014, p.131-147) has a chapter related to Big Data in sourcing which he identifies some use cases of Big Data in procurement. In terms of risk management Fan et al (2015) also studies risk management in context of supply chain.
The literature related to Big Data in procurement is mostly part of a bigger study in supply chain. The main gap in literature is lack of case studies specifically dedicated to Big Data in procurement. Consequently, this master’s thesis was conducted to get in touch with purchasing professionals through case study and tries to see if similar findings or new findings emerge.
10
1.3 Research objective and research questions
This purpose of this study is to analyse use cases of exploiting Big Data for purchasing and supply purposes, in order to help companies in having more visibility over the supply market. Furthermore, we are looking to elicit needs of supply managers regarding what they expect to gain from intelligent use of data and what intelligence they need to make sound strategic decisions that improves procurement management and lowers supply risk. In order to reach this objective following main research questions was created:
Research Question 1: What potential uses and needs companies are having in the area
of procurement that can be supported with Big Data and advanced analytics?
Research Question 2: What are the challenges and hurdles in implementing Big Data
analytics in procurement?
1.4 Research methodology
Case study method was chosen for this research. As mentioned earlier in research gap since this topic has not been investigated sufficiently earlier, an explorative qualitative approach was adopted to discover new insights about the topic. Case study provides the possibility to look at the phenomenon from various viewpoints and the qualitative nature of study removes constraints of rigid data collection. This research follows the abduction approach since it has a combination of inductive and deductive approach. Initially literature related to topic was identified and reviewed and results were deducted based on empirical data. Empirical data collection was carried out through multiple case studies in form of semi-structured interviews of purchasing and supply management professionals of case companies. Data was coded, analyzed and discussion and conclusion was written based on it.
1.4 Structure of the study
This study is divided into five chapters. In chapter 1, the topic is introduced and objective and importance of study is highlighted. Chapter 2 reviews literature. It starts by defining Big Data analytics followed by its role in supply chain management and finally its role in procurement. Chapter 3 describes research methodology, data collection and data analysis process. Chapter
11
4 presents the results of the study. Chapter 5 draws conclusions and implications while pointing out limitations of study and potential for further research.
12
2 Literature review
2.1 What is Big Data?
Big data is the hot trend in today’s world and companies are trying to harness this concept to leverage it for their business needs. However, companies do not fully understand what actually the Big Data is. It seems that the solution to better performing businesses rests in Big Data, but it is not clear why and how. In order to exploit Big Data to its full potential we need to begin with a thorough understanding of this concept. Forbes’s author, Press (2014) suggests some definitions for big data. Two of its relevant definitions are “The shift (for enterprises) from processing internal data to mining external data” and “A new attitude by businesses, non-profits, government agencies, and individuals that combining data from multiple sources could lead to better decisions”. So when it comes to Big Data, both internal and external data are important and companies are starting to see value in analysing these data. Manyika (2011) sees importance of Big Data in competition, firm’s growth and innovation.
Data is generated in our everyday activities. It is no longer limited to mobile networks or communication and spreadsheets. With digitalization and integration of technology in our day to day life, massive amount of data are collected and this is can be reason for the term “Big Data”. From crowd-funded business models and gadgets, large scale banking and mobility to individuals’ data and our behavioural patterns can be recorded and analysed for improvement of performance or preventing delays and even threats (Koutroumpis & Leiponen, 2013).
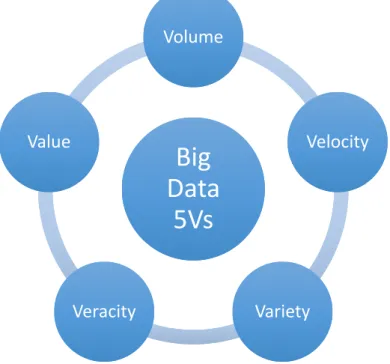
Gartner analyst Doug Laney coined 3 attributes to big data: volume, velocity and variety (Laney, 2001). Nevertheless, Big Data attributes have been evolved. Vossen (2014) considers 4Vs for Big Data and Demchecnko et al (2013) proposes 2 additional Vs to the main 3Vs: value and veracity.
Volume
Clearly the first thing that justifies volume attribute, is the term “Big Data” itself. Volume is the most important feature of big data. This is due to the fact that it is possible to collect data from wide range of sources. These sources are no longer limited to internal data. Data can be collected from sources such as transactions, sensors, behaviours and social networks. Possibility to collect data from various sources contributes to increasing volume of data. Data needs to be “be accessible, searchable, processed and manageable” (Demchenko et al, 2013).
13
As an example, social media like Facebook produce huge amount of data on a daily basis that can be exploited in global scale. What is considered Big Data might not be the same in future because of increase in capacity and data generation, also the type of data and industry generating the data makes it difficult for defining magnitude of volume (Gandomi et al, 2015).
Figure 1 Big Data 5Vs (modified from Demchenko et al, 2013)
Velocity
Velocity refers to speed of generation of data and analysis of it. With prevalence of smart devices and sensors, huge amount of data are being generated that need real-time analytics. Living in time of internet of things, massive amount of data cannot be managed by traditional data management tools and requires big data technologies for storing and analysis (Gandomi et al, 2015).
Variety
Variety describes heterogeneity of data. With technology advances, firms can collect both structured and unstructured data. Structured data in form of spreadsheets and relational databases only comprise 5% of data. Unstructured data are in form of text, audio, image and video (Gandomi et al, 2015). Additionally, collecting data from biological, human and societal systems increases complexity. Furthermore, introducing data technologies in non-digital fields such as psychology and behaviour research leads to further unstructured data (Demchenko et al, 2013).
Big
Data
5Vs
Big
Data
5Vs
Volume Volume Velocity Velocity Variety Variety Veracity Veracity Value Value14
Veracity
Veracity was coined by International Business Machines Corporation (IBM) for reliability of data. For example customer emotions in social media can be biased or judgemental. On the other hand it can contain valuable insights (Gandomi et al, 2015). Veracity has two main components: consistency defined by statistical reliability and trustworthiness that is determined by factors such as origin, reputation and reliability of processing method. Veracity ensures trustworthiness of data in its whole life cycle from collection to processing and storage. Factors that need to be taken into account are integrity, authenticity, identification of sources, timeliness and accountability (Demchenko et al, 2013)
Value
Value dimension of Big Data was introduced by Oracle. Data has low relative value to its volume (Gandomi et al, 2015). Added value is the value that is gained through processing of data. It can bring benefit to processes or can be in form prediction or forecast (Demchenko et al, 2013). Manyika (2011) presents a broader range of possibilities to add value rather than merely prediction and forecast. Big Data provides transparency of information and more frequent usage. Accurate data collection capability can boost performance and enable performing experiments and doing forecasts. Furthermore, customer segmentation will be more detailed for more tailor made products. In the end, analytics capabilities lead to better decision making.
In addition to these main 5Vs, there are variability and complexity. “Variability refers to the variation in the data flow rates” (Gandomi et al, 2015). Complexity arises from existence of many sources of data which makes cleansing it necessary. So far it seems clear that there is no absolute definition for big data and the further we go ahead the more dimensions are seen and maybe there will be more Vs in future as the need for them is discovered.
2.2 Business analytics and Big Data analytics
Holsapple et al (2014) tries to define business analytics in form of a framework with some building blocks. The more technical block blocks of this framework are not discussed since they are not in scope of this thesis. The first building block is movement. In any entity such as an organization or supply chain, the movement is similar to working culture that welcomes
15
usage of analytics. It is grounded in identifying and solving problems through evidence. Simply evidence is not considered as an add-on next to politics that can be overlooked. So the movement is supposed to build a culture that considers evidence as the driver of decision making. This culture fosters creativity, collaboration and realistic view of situations. However, building such philosophy and culture around analytics with a plan on sustaining it and defining key performance indicators (KPI), is a challenge of its own.
Another building block is collection of practices and technologies. This part can exist without the previous block, the movement but it might not be effective enough. In this part lies techniques and technologies that are used for evidence based operation to derive knowledge for decision making. Business analytics is usually viewed by this part, techniques and practices Next building block is transformational process. At this stage the practices and techniques turn evidence into understanding and action. Business analytics has a set of capabilities. These capabilities are usage of statistical and techniques and working with descriptive, predictive and prescriptive analytics that provides evidence for decision making. These types of analytics will be discussed more extensively further ahead. There are examples of putting these capabilities to work: interpretation of competitors’ actions, distilling message in big data, optimization, identifying suppliers’ strategies and new sources of data (Holsapple et al, 2014).
The final important building block is decisional paradigm. Business analytics is considered as an approach in decision making alongside other approaches. These approaches can be in line with each other or can be conflicting. The issue that is raised here is assessing whether this decisional paradigm is appropriate for an organization considering analytics movement and presence of required capabilities. If it is appropriate then design of transformational processes can proceed. Also it is important to think about aligning business analytics with other decisional paradigms and avoiding its misuse. Holsapple et al (2014) explains that business analytics try to achieve competitive advantage and support organization’s strategic goals by informed decision making that yields better results. Nevertheless, it should be noted that owning Big Data analytics on its own does not bring competitive advantage to a firm. It is merely a technology that facilitates decision making and its performance is largely dependent on quality of data and algorithms in use. In order to move in direction of gaining competitive advantage informed decision making should be accelerated. Therefore, it is necessary to gain buy in for Big Data analytics from managers in form of cultural movement mentioned by Holsapple et al (2014). Additionally, managers should be provided with guidelines to implement this technology in their businesses (Chan et al, 2014)
16
Considering data analytics, one can think of it as statistical analysis in form of spreadsheets or some automation through Excel. However when we are talking about Big Data, there are big databases that cannot be analysed manually. Big data analytics deals with massive data by technologies that have eased statistical analysis, data mining and machine learning algorithms. Clustering, classification and regression analysis can be done in large scale. Furthermore, optimization algorithms are easily applicable, thanks to these technologies (Chen et al, 2012).
2.3 Types of analytics
Chen et al (2012) divides business intelligence analytics (BI&A) to 3 levels: BI&A 1.0, BI&A 2.0 and BI&A 3.0.
BI&A 1.0 relies on structured data that is extracted and collected through legacy systems present in companies and analysis is based on statistical analysis and data mining techniques. Sallam et al (2011) considers following capabilities for BI&A 1.0:reporting, dashboards, ad hoc query, search-based Business intelligence (BI), online analytical processing (OLAP), interactive visualization, scorecards, predictive modelling, and data mining.
BI&A 2.0 is result of emergence of search engines like Google and Yahoo which enabled online presentation of businesses and their interaction with other businesses and customers. Web 2.0 services has helped in collection and generation of user contents in social media such as forums and social networks. This has created opportunity for bidirectional communication between customer and business. Some technologies used in this area are: text mining, web mining and social network analysis. BI&A 3.0 is related to prevalence of smart phones and devices. With internet of things, sensors and RFIDs, there are great opportunities for analysis of large scale mobile data.
Analytics are divided into 3 categories: descriptive, predictive and prescriptive.
Descriptive analytics is used whenever necessary. It tries to identify problems and opportunities in the existing processes and functions by techniques such as OLAP and drill down (Wang et al, 2016). It uses historical data to identify patterns and modelling past behaviour (Assunção et al, 2015). Questions that are answered are what has happened in past? What trends existed and what were the exceptions? After obtaining insights from data, it will give alerts and it is capable of visualizing results in a format that is easy to understand (Rozados et al, 2014).
17
“Predictive analytics attempts to predict the future by analysing current and historical data” (Assunção et al, 2015). It has the technology to learn from data thanks to machine learning and data mining algorithms. Time series analysis, advanced forecasting of safety stocks, regression and statistical analysis are examples of techniques used in this type of analytics (Rozados et al, 2014). Waller et al (2013) defines predictive analytics in supply chain as:
Supply chain management (SCM) “predictive analytics use both quantitative and qualitative methods to improve supply chain design and competitiveness by estimating past and future levels of integration of business processes among functions or companies, as well as the associated costs and service levels”.
Prescriptive analytics use the predictions in order to propose actions in situations that will be faced in future whether to benefit from them or avoid risks. Optimizations, simulations, what/if scenario analysis and similar techniques that serve the purpose of dealing with uncertainties is related to this domain (Rozados et al, 2014). This type of analytics is the least common among firms. Additionally, trusting a system with making decision is still subject of consideration in minds of practitioners.
2.4 Big Data analytics in supply chain management
The aforementioned capabilities of big data can be leveraged in supply chain management. From upstream to downstream of supply chains, massive data is generated in each operation and supplier in the chain. Provision of accurate and real time insights help supply chain professionals to continually identify and respond to supply chain issues. These data are in form of structured, semi structured and unstructured data (Rozados et al, 2014).
Figure 2 shows taxonomy of data in supply chain. It is evident that structured data is mostly present in internal systems and has lower volume and velocity. As we go further in horizontal axis variety increases as data becomes more unstructured. At the same time volume and velocity surge. Even though enterprise resource planning (ERP) and customer relationship management (CRM) data are core data, they only compromise a small fraction of whole data sources available to use.
18
Figure 2 Taxonomy of data in supply chain (Rozados et al, 2014)
Gunasekaran et al (2017) argues that big data analytics can aid supply chain through improving visibility, resilience and robustness. It generates cost saving and contributes to competitiveness of a firm. Additionally, firms can use it to beat competition by increased transparency, effective decision making and customer segmentation provided by data capabilities.
2.4.1 Implications of 3Vs in supply chain
Hofmann (2017) argues that out of the 3Vs of big data, velocity plays the biggest role in diminishing bullwhip effects. The data should be captured, processed and transferred as fast as possible not only in a single firm but among all members of supply chain. Due to importance of speed and agility in decision making, velocity enables increased effectiveness in decision making. In a long supply chain that number of intermediaries increases, velocity benefits last upstream player. Richey et al (2016) conducted a study inquiring about Big Data from supply chain professionals. He mentions that most of the respondents noted the increased velocity of the data being produced. Supply chain managers considered velocity of data as both an obstacle and an opportunity.
As mentioned earlier, emergence of smart devices, sensors, RFIDs and internet of things has led to massive generation of data of different sort. Data comes in different formats and different level of structure. So the challenge that variety imposes is, finding new ways of storing and
19
processing data since old databases are only suitable for one type of data. The challenge of volume is mostly evident in multi staged supply chains that there is the possibility of missing volume since data is running across multiple platforms (Hofmann, 2017).
Traditional applications prior to big data only dealt with transactional data and could not react fast to unexpected supply chain events. Therefore, big data applications are needed to make use of these massive data to expedite decision making and bestow agility to supply chain (Hofmann, 2017).
2.4.2 Key success factors of implementing Big Data in supply chain
In Richey et al (2016) supply chain professionals are asked to determine what success factors of implementing Big Data in supply chain management are. The first factor is SC systems integration. They expected improvement in supply chain through an integrated system that they can communicate with suppliers in the same system and leveraging big data capabilities to link that system to market needs. Schoenherr & Speier-Pero (2015) also identifies lack of integration as a barrier to Big Data. Nevertheless, an integrated system incurs cost. The two main costs related to that are buying equipment and training. Although such system can reduce waste, presence of diverse system in supply chain creates data redundancy waste and having fewer systems helps in quality of information. Additionally, it is much easier to build systems from ground zero rather than having multiple systems in place, since connecting systems from different functions and with different format is a challenge of its own. Also Wang et al (2015) argues that great value of Big Data comes from integrated data sources.
Next factor on the list is improved forecasting/decision making. Traditional decision making is mostly based on relationships with suppliers and their background or track record. Big data provides the ability of decision making based on evidence as mentioned earlier. The important point about relationships is mentality. People are used to decision making based on experience and opinion of people they trust. Quantitative analysis is a new practice against this mentality (Richey et al, 2016). Reliance on relationships and experiences for decision making, displays the need for change management for buy in of new morality.
Even with Big Data, communication is key in sound decision making since decisions are intersection of human capital with advanced analytics capabilities. Experts need to interpret data and disseminate it to key stakeholders and disseminating it in a format which is easily
20
understandable. Forecasting provides opportunity for stronger informed decisions and ability to identify more risks (Richey et al, 2016).
Next success factor is human capital. Firms adopting Big Data considered management’s mentality as hindrance in implementation because their emphasis is on relationships rather than quantitative data. These managers have usually a long tenure in the company and they are not used to data driven business. This is due to unavailability Big Data capabilities earlier in their career. In Schoenherr & Speier-Pero (2015), one third of respondents were not familiar with analytics which shows a need for educating people. Nonetheless, at lower level people are needed to put actions into practice. Therefore, people are needed who are knowledgeable in Big Data. Such people can also help in data collection and elevating data quality (Richey et al, 2016). Gao et al (2015) had also conducted a study on success factors of Big Data implementation. One dimension of their results was dedicated to role of people. They believed that current staff should have Big Data skills or people with such skills should be hired externally. Additionally, a multidisciplinary team from different department should take part in Big Data project. Although people who are trained in analytics are necessary for Big Data initiatives, business people who welcome data driven business should be present to reap benefits from available analyst resources.
Security and governance is a big concern for supply chain managers in terms of data ownership, data storage and data privileges. In spite of security risks many managers believe that sharing information provide benefits to all members of supply chain. Even if one member shares information, benefits are more than costs. However, not all information should be disclosed. A good example is pricing information and profit margin.
On the other hand not all the information is kept confidential for financial reasons. There are legal regulations for protecting data privacy and they are industry specific. Healthcare is one of these industries. Patients’ information must remain confidential. Additionally data must be stored safely and this makes ensuring security of cloud storages and internal systems. Even though managers become willing of sharing information, legal requirements might be stricter. In terms of data ownership, many are concerned about who owns the data but in emerging economies data sharing is even stricter (Richey et al, 2016).
Given all the security risks and not a clear stance on what can be shared and what cannot be shared, many managers believe that data sharing decreases risks of decision making not only in top management but in entire organization. Big data is a “potential tool for improving risk
21
management efforts which presently are difficult to manage thoroughly”. There are significant amount of risks associated with suppliers and big data helps in managing them (Richey et al, 2016).
Another challenge for supply chain managers is storage of massive data. While volume of data gives the potential of more analysis, not all of the data is useful. One thing to consider is short term and long term storage of data. Because it is not clear which data is useful in future. It cannot be determined what should be kept and what should not. So the challenge of physical storage is present when we are not aware what should be kept and if we delete data just for storage limitation, it might be of use in future. Nonetheless, there are costs related to infrastructure, protection and capacity. Industries that have poor system integration exacerbate this situation because more effort is needed for organizing data. While managers see opportunities in big data but still they do not exactly know what to do with it. Some managers believe as they start storing and working with data they learn what is useful and what is not but finally the know how to make use of data for decision making is important (Richey et al, 2016).
Big Data helps in gaining operational efficiency. The information gathered can be leveraged to improve all the players that are connected to data driven system. Data gathered not only improves supply chain partners but it is useful for individual functions within these partners e.g. procurement function. However, balancing costs of Big Data system and its potential benefits are challenging (Richey et al, 2016).
The final significant success factor is partner transparency. Supply chain partners want transparency for communication. The term “control tower” is relevant here. What they want is transparency of all plans and platforms and communicating with each other. Respondents believed that transparency is beneficial in gaining trust of supply chain partners since they rely on shared data with clear sources. (Richey et al, 2016).
Richey et al (2016) points out other factors that are were less important in view of their respondents but they are worth mentioning. Importance of data quality and having inputs from different people makes having one version of truth a necessity. This is can be solved by having an integrated system which is not in place in many cases. To have same interpretation from both operational people and strategic people, one version of truth is needed. Managers aspire to have simplified Big Data solutions that is accessible from any location at any time, however some of them believe that this capability should be developed internally and others believe in third party providers. Finally, to achieve one version of truth databases must be cleansed and
22
quality must be improved. As mentioned earlier massive data is available but not every firm knows how to make use of it. They either lack the technology or lack data scientists. In addition to that distinguishing between useful and useless data is a challenge. Therefore, firms have to
climb the learning curve. The goal of a business is optimizing its profits. Big Data and adopting customer orientation helps in this regard. It enables capturing customer views, predicting their needs and customizing products.
2.4.3 Benefits of Big Data in supply chain management
Wang et al (2015) has compiled lists of benefits of Big Data in supply chain management. Benefits are divided in 4 groups: visibility and accuracy of information, operational efficiencies, higher service quality and new business models and better prediction. Regarding visibility it enables product and service visibility, identification of problematic suppliers and problems for suppliers, giving early warnings and reduction of inventory and supply chain risk. Regarding operational efficiencies, it aids in expediting decision making, real time vendor management and real time view of demand and sale for expediting sourcing process. Service quality is improved through close interactions with customer. New business models lead to emergence of companies who are information driven and act as intermediaries. Schoenherr & Speier-Pero (2015) conducted a large scale survey of supply professionals to understand benefits of predictive analytics in SCM. Findings of Schoenherr & Speier-Pero (2015) confirm the list provided by Weng et al (2015) except that it does not mention emergence of business models. Additionally some more benefits are included. For example, greater power in relationship with suppliers and customers, agility in response to changing environment and better bargaining position in negotiations.
2.4.4 Challenges of Big Data in supply chain management
Regardless of general challenges of Big Data that are data management capabilities, privacy, data ownership and deriving meaningful insights from large volume of data, implementing it in each domain has its own unique challenges and requires domain knowledge. Therefore, a supply chain has its own challenges. Usually supply chains are not owned by one specific company, there are multiple number of players, each with their own fragmented system which requires standardization efforts. Many of stakeholders do not understand the value that can be gained by Big Data. Even though sharing information creates value, firms can be hesitant in this regard especially if they are concerned about losing competitive advantage. Finally shared
23
data requires a repository accessible for all partners and such repository currently do not exist (Wang et al, 2015).
Sanders (2016) sees four hurdles in implementation of Big Data analytics in supply chain management. The first hurdle is needle in a haystack. Companies are under influence of Big Data hype and are rushing to implement it not to fall behind the competition, however they are doing it randomly. Therefore relationships and causations found just through number crunching and without focus can yield false results.
The next hurdle is islands of excellence. Firms buy application for specific functions. These algorithms are efficient in optimizing the selected function, however if it is not in coordination with the whole supply chain, these efforts become futile. Leading supply chains such as Walmart’s and Zara’s have understood that optimization of functions in silo is insufficient. In their supply chain any information captured through sell side will be conveyed to all supply chain functions. So any shortage or delay will be coordinated with all of the functions. These advanced companies view supply chain as a system with interconnected functions. Optimization of one function cannot be done without consideration of other functions, since it can increase costs in other functions (Sanders, 2016).
Many companies are struggling with their measurement metrics. Sanders (2016) call it
measurement minutiae. Companies have too many metric to cover everything but only a few know which one is important to focus on. Consequently, companies are moving towards creating fewer customized metrics that are easier to manage.
At last there is the issue of analysis paralysis. Companies have data sources and are generating data through supply chains. They are awash in data, however there is confusion of what to do with this data and where to start that has led to paralysis. They cannot make use of data even though new analytics technology are offered to them (Sanders, 2016). It implies that advanced analytics and technology is not the issue but the data itself is the issue and this issue ranges from structure and format of data to determining its relevancy.
Data quality is issue that should not be overlooked. Hazen et al (2014) mentions that data usefulness is dependent on quality since it will affect decision making. Costs of poor quality data in decision making can be from 8% to 12% of revenue for typical organization and up to 40% to 60% for service organizations. Furthermore, it causes job dissatisfaction and deteriorates trust in organization. There are four dimensions for quality of data: accuracy (error free), timeliness (up to date), consistency (same format) and completeness. “The lack of
24
common data format standards and the transfer of data between dissimilar systems” also undermines reliance of firms on data science, predictive analytics and Big Data (DPB) for growth and innovation (Hazen et al, 2014). Therefore, supply chain managers should be concerned about quality of data as much as they are concerned about their products quality.
2.4.5 Analytics application in supply chain
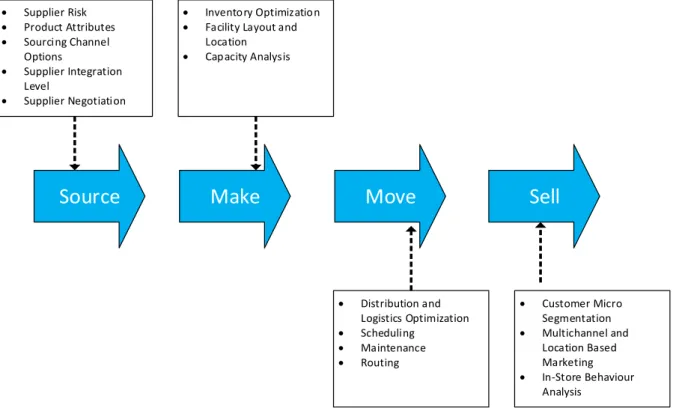
Amazon and Walmart are examples of companies that transformed their supply chains using Big Data. Companies such as Facebook, Google and LinkedIn can also use Big Data capabilities. But for others adopting this technology is costly and the return on investment (ROI) is uncertain. Additionally, firms have massive data but do not know what to do with it and where to start. Furthermore, Big Data analytics require competencies that might not be present in company so it has to be outsourced. With machine learning capabilities we no longer test human hypothesis but we test hypothesis that have not been generated by human (Sanders, 2016). Figure 3 exhibits application of analytics across supply chain.
Source
Make
Move
Sell
Supplier Risk Product Attributes Sourcing Channel Options Supplier Integration Level Supplier Negotiation Inventory Optimization Facility Layout and
Location Capacity Analysis Distribution and Logistics Optimization Scheduling Maintenance Routing Customer Micro Segmentation Multichannel and Location Based Marketing In-Store Behaviour Analysis
Figure 3 Analytics Across Supply Chain (modified from Sanders, 2016)
In this figure supply chain is divided in 4 categories: source, make, move and sell with areas that analytics can help. Each of these blocks has its own subgroups that discussing them is not in scope of this thesis. The concentration of this thesis is on sourcing.
25
2.5 Procurement and Big Data
Although Big Data is exploited in marketing, logistics and other areas of supply chain, focus of this part of literature review is on sourcing and procurement as this thesis is mostly concerned with Big Data’s impacts on procurement. Since sourcing expenditure comprises of 50 to 90 % of a firm’s revenue, there is great opportunity for leveraging Big Data to benefit this part of supply chain. Nevertheless, compared to logistics and operations, sourcing applications are lagging behind and it is expected to gain more attention from now on. Currently sourcing applications are used for segmenting suppliers based on key capabilities, identifying risks, cost measurement and managing tail-spend. Another use case is identifying buying behaviour of customers and using that for supplier negotiations (Sanders, 2016).
In the study conducted by Richey et al (2016), one supply chain professional believed that the advantage that Big Data can provide to procurement is providing trends of procurement. Based on these trends consolidation and pulling of the prevailing volume would give strength in bargaining, in negotiation, improvement of quality, better delivery and lead times and finally better efficiency in plant. Similarly Nair (2015) and Schoenherr & Speier-Pero (2015) suggest same advantages of analytics. Nevertheless, none of the articles go deeper into each of the benefits and how they can be achieved and what kind of data is necessary for them.
Procurement is in charge of upstream suppliers and global sourcing. The large scale of global sourcing results in massive number of transactions and it needs connection with internal finance for visibility, however a large proportion of company’s cost is external expenditure. This expenditure is usually not consistently categorized and integrated with internal costs. One hurdle in integration of this data such as purchase orders (PO), shipping and invoices is their semi-structured nature. So data integration should not be limited to expenditure but it should cover the whole procurement (Rozados et al, 2014). Stakeholders need to know how their money is being spent. One use case of data analytics in procurement is prevention of fraud. Nevertheless, visibility gained through it gives better insights to stakeholders for developing sourcing strategy (Tan et al, 2015). Additionally “Analytics has, in the recent years, been used as a means to significantly reduce costs; by reducing the inventory turnover, transaction costs, cost due to wastage and also by reducing the time spent on negotiating for sourcing and supply purposes” (Karthik et al, 2015).
26
Chowdhary et al (2011) explains that firms might have visibility and transparency over procurement of core products but other product purchases are ad-hoc without monitoring. This is a source of spend leakage that goes unnoticed. Getting grasp of these unnoticed expenditure can help company’s income in crisis time. They argue that current tools available for procurement are mostly reporting tools such as tools that process POs and filters them by different categories. However these tools cannot analyse data to find problematic areas.
Supplier management is an important aspect of procurement and identification of suppliers, monitoring their quality, performance and risks is an inseparable part of it. Furthermore, in strategic sourcing one company can opt to have multiple numbers of suppliers while another one tries to minimize number of suppliers. These decisions can be described by Kraljic’s (1983) framework. Based on his framework complexity of supply base can make a supplier a strategic supplier that can have the advantage over the firm. On the other hand with lower complexity of supply base and how valuable a product is for firm, the firm can have leverage over the supplier with lower switching cost. If a firm seeks to change its position of power relative to a strategic supplier then it needs to find alternative suppliers to disrupt power balance and achieving better deals. Therefore, a firm’s sourcing ability to finding alternative sources of supply becomes important not only in case of power position but also in risk management. Analytics aids in creating a benchmark of industry best practices to evaluate suppliers using multi criteria decision making techniques (Weng et al, 2016)
Mena et al (2014, p.94-95) discusses points to consider while adopting global sourcing. He argues that while companies can fully trust their immediate suppliers (first tier suppliers), they do not have transparency over their suppliers’ suppliers. Consequently, he deems having a control tower to provide “bird-eye” monitoring necessary in controlling lead time and transparency of n-tier suppliers. Furthermore, he explains that in order to have a resilient supply chain that is guarded against supply disruption risks, supply chain should be mapped and critical paths of supply should be identified. Keith et al (2016, p.233-234) talks about gaining market intelligence by analysis of external market. It is argued that you need to understand what can cause disruptions in supply chain whether through something such as a marketing campaign or natural disaster. More importantly you have to be aware of flow of supply. Therefore, there should be awareness of location of suppliers and how they manage supply flow of their upstream suppliers. Even though having visibility of upstream supply can be valuable, they do not consider practicality and feasibility of such efforts.
27 2.5.1 Impact on procurement
Setting analytics to work for procurement requires thorough understanding of sourcing function. Traditionally sourcing was viewed as purchasing process. However, today we know that sourcing is a strategic function. Since substantial amount of a firm’s revenue goes for sourcing, firms have realised it no longer can be a function operating in silo. Conversely it needs to be centralized and communicating with all other functions since its tasks are more than merely purchasing goods. Consequently, applying analytics to sourcing has become more complex. Sanders (2014, p.131-147) talks about impacts of Big Data on sourcing in following categories: order processing, standardization, visualization, more and faster queries, cost savings, predictive edge, enabling co-creation and risk management.
Perhaps the first thing that comes to mind when we are talking about Big Data and information technology (IT) is its application in order processing and automation. Speed of order processing affects customer satisfaction. Order processing is done through customer interface communicating with firm and Big Data improves its efficiency. Electronic data interchange (EDI) speeds up order placement and shipment and automation cuts excess costs of logistics, inventory and warehousing because it is monitored in real-time. Some companies like IBM have divided this cycle into two cycles, order to cash cycle and procure to pay (Sanders, 2014, p.131-147).
Having automation in place aids in standardizing processes and eases global sourcing. It transforms isolated parts of supply chain around the world into one integrated system that customer can contact any of the branches in any country and have its order fulfilled with same standards and procedures (Sanders, 2014, p.131-147).
Another use case for Big Data analytics is that it enables development of new applications and improving existing ones through its ability to visualize big databases and revealing relationships by using formats such as image, diagrams and animations. These aggregated or disaggregated data can further be combined with other data sources such as market information to yield more insights by what-if and scenario analysis (Sanders, 2014, p.131-147). Something that could be done manually and it was cumbersome since one could not collect all the data by his own and without visualization in an easy to understand format, it was difficult to make sense of data.
28
Big Data application enables the ability to run fast queries of different number of scenarios -Scenario analysis aids managers to form views of what might happen in future and what would be the optimal contingency plans to uncertainties of future events and markets (Fan et al, 2015) - additionally, it provides more dimension and filters to view data with lenses such as locations and categories. Furthermore, it facilitates having total cost of ownership (TCO) view on costs and procurement challenges and providing a competitive advantage by answering scenario questions (Sanders, 2014, p.131-147).
One of the reasons for having a centralized procurement and communication with other functions is collaboration to make decisions based on TCO. Procurement needs to be coordinated with designers and suppliers to drive down and save costs. Also collaborative planning, forecasting and replenishment (CPFR) is another mean for forecasting and coordination of different players. It is important to note that with Big Data application it is much easier to foster these collaborations (Sanders, 2014, p.131-147) and include more players and data sources.
Uncertainty is always concern of managers and they seek ways to overcome it. In terms of sourcing, uncertainty can stem from scarcity of supply, or change in performance and quality of top performing suppliers or change in commodities’ price and currency rate fluctuations. Big Data tries to shed light on these issues by scenario planning and forecasting to provide a
predictive edge to procurement (Sanders, 2014, p.131-147). Teece et al (1997) defines dynamic capabilities as ability to reconfigure resources based on changing environment. Building on this definition, Pavlou and El Sawy (2011) propose four dynamic capabilities as tools for resource reconfiguration. These capabilities are sensing, learning, integration and coordination. Improvement in forecasting can act as the sensing capability towards external world. This capability is also beneficial in risk management. Consequently, Big Data analytics can help in building dynamic capabilities. Chen et al (2015) mentions that information processing is a dynamic capability that provides temporary competitive advantage, however Big Data analytics is more than simply information processing.
Nowadays one of the hot topics in business models is a movement to service dominant logic and creating superior value for customer. Proponents of this movement believe that superior value is achieved through co-creation. As an example for manufacturing huge products that require great number of suppliers, Big Data provides the ability of sharing information with the whole chain so that various companies design in accordance with each other. Consequently,
29
with co-creation not only end product is of higher quality and lower defects, it saves time and costs (Sanders, 2014, p.131-147).
Sanders (2014, p.131-147) explains that analytics for risk management are underdeveloped even though they have great importance. Instead of simple metrics he suggests supplier resiliency score. This score considers some numbers risk factors for suppliers and then shows if a specific supplier needs to be monitored for risk and contingency plans. As an example of risks associated with this number, facility location and availability of alternative sites of production is taken into account. Wang et al (2016) suggests that publicly available news and social media channels related to suppliers and markets are sources for risk identification. Another area for risk management is assessing supplier’s performance in response to the risks they have encountered in case of economic crisis or scarcity of suppliers and other relevant events. Weng et al (2016) believes that analytics can help in monitoring performance of suppliers by comprehensive supplier’s data collection and quick analysis.
Another area to consider in Sanders (2014, p.131-147), is child labour and human trafficking. There are strict legislation in some countries regarding this issue and if a supply chain is operating globally then it becomes an important issue. Legislation and laws not only can disrupt the supply chain but also human trafficking damages company’s image and reputation. Big Data analytics helps in identifying high risk areas and detection of this issue. Big Data can utilize discussions on social media to give warnings about potential risk related to forced labour and then firm can investigate issue through more reliable sources. It is important to note that with increasing trend of outsourcing and relying on suppliers, risks associated with supply disruptions surge. Furthermore, by adopting lean production and having minimum inventory, a shortage can disrupt a supply chain. To have a shield against these uncertain events, predictive analytics and scenario planning can become handy. It is important to identify critical paths of supply chain and predict what can go wrong and having a backup solution for that.
2.5.2 Potential sources of data
Fan et al (2015) suggests a framework for managing risks that data should be considered both internally and externally. Internal data are purchasing records for checking quality, bill of material (BOM), delivery records, financial records, crucial facility records and human resources (HR) records. For external resources following sources are suggested: public news, politics, weather records, natural disaster records and social media.
30
The type of social media analysis that is influential for business is social influence analysis. In this type of analysis, influence and their connection in social network are modelled and evaluated. Since behaviour of actors is affected by other actors, it is valuable to understand patterns and strength of influence (Gandomi et al, 2015).
Furthermore, TATA consultancy’s report by Chithur (2014) suggests experience of category managers, consultants, industry associations, trade journals, company annual report and online literature as useful sources of data.
2.5.3 Type of analytics needed
The type of chosen analytics depends on how complex a supply chain is. Supply chains can either be stable, established with low uncertainty or can be evolving with ever changing technology and supply and demand fluctuations. Sanders (2014, p.131-147) determines supply chain complexity by comparing two aspects, demand uncertainty and supply uncertainty and defines four types of supply chain:
Efficiency focused SC (low supply uncertainty, low demand uncertainty) Responsive SC (low supply uncertainty, high demand uncertainty) Risk-Hedging SC (high supply uncertainty, low demand uncertainty) Agile SC (high supply uncertainty, high demand uncertainty)
Efficiency focused supply chains are easiest to manage and predict and the eliminating waste improves the benefits. Therefore, for this supply chain automation of order processing and a simple visualizing dashboard suffices.
Responsive supply chains are used for innovative products. Because of low uncertainty of supply we are mostly concerned with demand uncertainty. Consequently postponement principle is adopted for this SC. Examples are Zara and Hewlett-Packard (HP) who postpone final operations until demand becomes clear. For this SC analytics should be used for implementing postponement.
Risk-Hedging supply chains are prone to supply disruptions and inventory shortage and they keep high inventory stock and share their resources between different companies. For such situation scenario planning comes handy.
Agile supply chains are hardest to manage as they should cope with high customization on demand side while preventing supply disruptions on demand side. Again similar to
risk-31
hedging supply chains they need higher safety stock and they pool and share resources. For this situation, predictive analytics and scenario planning are necessary to avoid risks.
Karthik et al (2015) conducted a study to understand relationship between level of analytics adoption and its perceived benefits in procurement. By level of adoption they mean the degree that analytics cover functions and their perceived benefits are financial benefits, inventory benefits and supplier intelligence. Financial benefits are related to procurement costs, price reduction and customer satisfaction. They found out that level of adoption has direct impact on financial benefits. Maximum benefits is gained when all the departments have put analytics in use. For inventory benefits, the more level of adoption the more benefits gained. This is due to quick decision making for supplier selection and inventory optimization. Despite these benefits, the interesting finding was the relationship between supplier intelligence and perceived benefits. With increase in degree of adoption, supplier intelligence tends to decrease. They argue that this is due to transparency becoming a routine and relationship with supplier becomes the hindrance. When all suppliers are participating, price competition becomes a problem to perceived benefits. In addition to that, relationships and supplier switching costs are problematic. However, overall benefits gained is increased by adoption of analytics.
Another factor that should be taken into account for implementing analytics is change management. As mentioned earlier in framework of business analytics, there is a need for corporate wide movement and cultural change to buy-in analytics and trust data. Sourcing is no different in that sense. Richey et al (2016) mentions answer of one supply chain professional regarding this issue that Koreans are not familiar with decision making based on quantitative. Their past experience and opinion of people whom they trust is more important when it comes to decision making. The obstacle is emotional attribute.
2.5.4 Current state of procurement and Big Data analytics
One place to start observing the situation is spend analysis. Correct spend analysis can increase visibility and identify cost saving opportunities. Nevertheless, success of it is largely reliant on the ability to appropriately access, organize, and analyze data as mentioned by Limberakis (2012). Spend analysis is a top priority operation for procurement professionals that requires integration of multiple data sources and clearly defined data processes. Also procurement needs coordination of other functions to achieve success. In research done by Limberakis (2012) the core issue of spend analysis was quality of internal data from ERP and procurement systems
32
that hindered correct forecasting and identification of saving opportunities. Data quality problem comes from multiple data sources that are not integrated and from usage of manual spreadsheets. 32% of respondents of that research were using spreadsheets as their primary tool. A possible solution to this situation is automation from extraction of data to its enrichment. Nonetheless even in firms who are more advanced in analytics, data extraction has the highest level of automation whereas cleansing, classification, and enrichment are mostly done manually.
Limberakis (2012) suggest that the first step in creating more effective spend analysis tool starts in data extraction effort. The issue of data extraction from multiple sources and cleansing data should be solved and become automated. Then company-wide standards and formats should be adopted so make common understanding across company. In the transformation process suggested by Limberakis (2012), issues need to be solved internally at first and in the last stage company can make use of external data such as market indices, commodity prices and external events impact to be able to make use of predictive analytics and manage risk better. But spend analysis is only one part of procurement.
Rafati and Poels (2015) argue that for fact based decision making, a firm needs both data management and data analytics competency. Data management is more concerned with technical side of issue such as transformation, storage, governance and etc. Data analytics is the part that can derive value from data which was discussed earlier in this review. The situation with procurement analytics is that they use analytical techniques to aid decision making, however the burden is data management capability. The challenges that firms face in managing their data are inaccurate and not timely information of spend patterns and suppliers. In addition to that there are vast volume of data in dispersed systems that makes its management even harder.
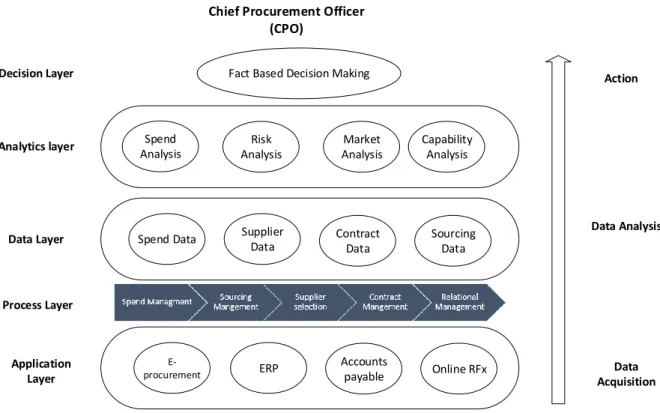
To understand procurement analytical layers and their challenges Rafati and Poels (2015) made the taxonomy in Figure 4. The first layer is application layer. Here lies various systems such as ERP, e-procurement, request for (RFx). The challenge with this layer is that procurement data is scattered across different systems that are not integrated. Next layer is process layer that has key sourcing activities such as spend management and supplier selection. The problem with this layer is that not all of these processes are application based and if there is data for analysis, it is not in digital form. The third layer and the core layer is data layer which contains data on
33
contracts, suppliers and spend. There is lack of platform to consolidate all data sources from pervious layer and a shared storage for analysis.
E-procurement ERP
Accounts
payable Online RFx Spend Data Supplier
Data Contract Data
Sourcing Data Spend Analysis Risk Analysis Market Analysis Capability Analysis Fact Based Decision Making
Chief Procurement Officer (CPO) Application Layer Process Layer Data Layer Decision Layer Data Acquisition Data Analysis Action Analytics layer
Figure 4 Layers of procurement (modified from Rafati & Poels, 2015)
The fourth layer is analytical layer that consists of tools such as market analysis and cost – benefit analysis. This is the layer that derives insight from gathered data to add value to business. Depending on maturity of organization and type of analytics in use, they might lack tools and skills to make use of data. Final layer is decision layer. In this layer there is a need for visualization techniques to transform insights into understandable format for ease of decision making.
2.6 Literature synthesis
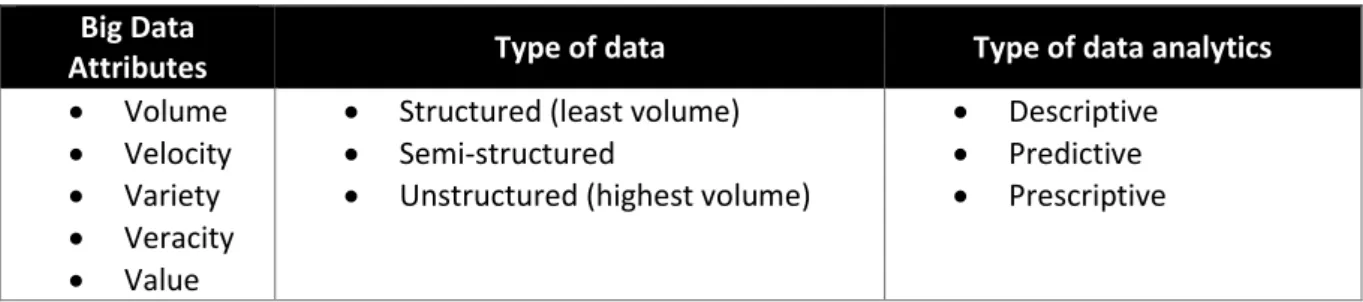
In this section a picture of literature review is depicted to have a comprehensive view of literature. Table 1 shows Big Data characteristics and analytics, Table 2 shows role of Big Data in supply chain and Table 3 shows Big Data in procurement.
34
Table 1 Synthesis of Big Data and analytics
Big Data
Attributes Type of data Type of data analytics Volume
Velocity
Variety
Veracity
Value
Structured (least volume)
Semi-structured
Unstructured (highest volume)
Descriptive
Predictive
Prescriptive
Table 2 Potential of Big Data in supply chain
Big Data in supply chain
Key success factors Benefits Challenges
SC system integration
Improved
forecasting/decision making
Human capital
Security and governance
Storage
Operational efficiency
One version of truth
Increased visibility
Enhanced bargaining position
Ability to respond faster to change
Greater power in relationship with suppliers and customers
Operational efficiency
Accuracy of information
Better risk management
Informed decision making
Needle in haystack (where to start?)
Islands of excellence (uncoordinated functions)
Measurement minutiae (too many metrics)
Analysis paralysis
Data quality
Dispersed systems
Lack of standard data format
The success factors, benefits and challenges of Big Data in supply chain is not completely different from Big Data in procurement. In fact supply chain analytics is a bigger version of analytics. For example, SC system integration, one version of truth, problem with data quality, dispersed systems and some other factors are also true in case of Big Data in procurement. The Big Data in procurement has a more detailed view of analytics used in procurement but has similarities to supply chain analytics. Therefore, the efforts needed to succeed are similar to each other. This view of literature exhibits that literature explains general issues related to Big Data analytic and do not deep further into them to understand how they can be implemented and what their hurdles are, especially in procurement.
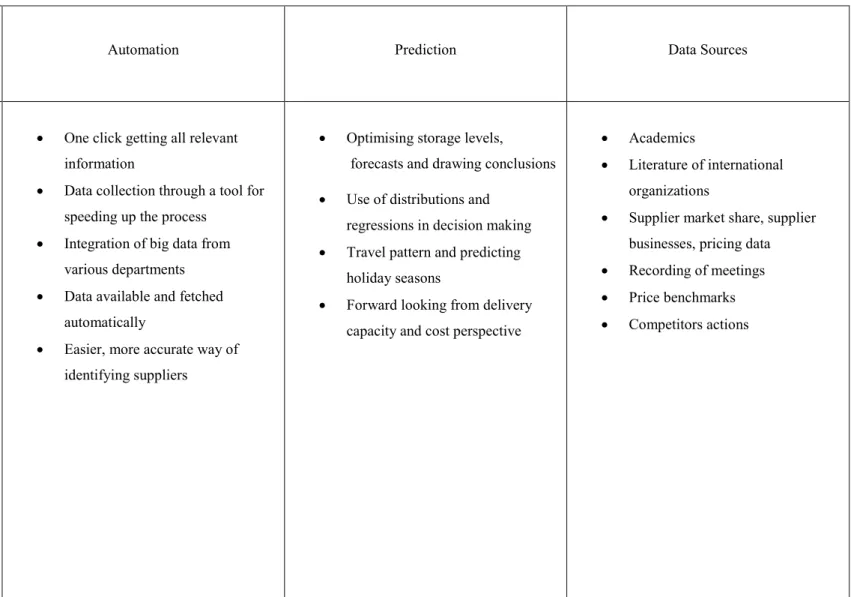
Table 3 illustrates the impacts that Big Data can bring to procurement such as standardization of processes, driving down costs and providing predictive edge. Internal and external sources of data are also compiled. In the two last column of table procurement layers alongside their challenges are depicted.