1
Analyzing superstars' power using Support Vector Machines
Ana Suárez-Vázquez , José R. Quevedo
The main objective of this paper is to explain the influence that superstars have over spectators. The most significant contributions in the field of persuasion are discussed. This theoretical framework suggests some hypotheses that are tested using the data of an empirical study based on a survey of moviegoers. Support Vector Machine (SVM) is used for data analysis and pattern discovery. The SVM prediction capacity is benchmarked against that from linear regression and multinomial logit. The study shows that the SVM has considerable promise for analyzing spectators’ behavior. The observed results allow us to extract some significant conclusions and implications for the process of creating and maintaining the power of a superstar.
Cinema market; star power; persuasion; machine learning; support vector machine JEL Codes: M3, Z1, C6
1 Introduction
The presence of stars is one of the most common marketing claims used in the film industry. However, neither in the industry nor in the academic literature is there total agreement about the relationship between stars and financial success (Nelson and Glotfelty 2012).
2
Star power might work by helping to manage the risk of different participants in the cinema value chain. Financiers, exhibitors, news media and movie audiences are influenced in differing degrees and for different reasons by a cast of superstars (Liu et al. 2013). The purpose of this study is to explore the paths by which superstars affect the last stage of the cinema value chain, the moviegoers.
The majority of the studies that analyze the effects of movie stars over film demand take into account aggregated data of the market. This approach is favored by the availability of information about the cinema market. Indeed, secondary sources such as www.imdb.com or www.boxofficememojo.com provide rich data about the main components of the industry. This aggregated approach has produced mixed findings. Some previous researches reported a positive impact of the involvement of stars in a movie (i.e. Sawhney and Eliashberg 1996; Albert 1998; Simonoff and Sparrow 2000; Basuroy et al. 2003; Walls 2005; Elberse 2007; Karniouchina 2011; Marshall et al. 2013). However, in other studies this relationship is not so clear (Litman 1983; Litman and Kohl 1989; Wallace et al. 1993; Prag and Casavant 1994). To explain these contradictory findings it has been concluded that the real star is not the actor or actress but the movie itself (De Vany and Walls 1999). Thus, the aggregated approach leads to a holistic view of the cinema product where star power requires budget power (Ravid 1999; Hadida 2010). In spite of the difficulty of dissociating the binomial starpower-financial resources, the availability of secondary sources is an important advantage when trying to analyze the cinema industry. However, aggregated data of the market is a double-edged sword. It discourages researchers from using other sources of information more limited in scope and generality but richer in depth. The kind of diagnosis derived from aggregated data has an underlying paradigm which is quite unrealistic nowadays, that is, the “representative spectator”. In this paper we conjecture that the average
3
spectator does not exist and that the analysis of micro choices of spectators can provide valuable insight.
In analyzing star power from an individual perspective it is possible to use the extensive literature about persuasion. The analysis of the power of persons to modify attitudes and behaviors of others is not new. Over the last few decades, persuasion research has increased notably due to the challenges associated to the proliferation of new communication means (Kruglanski and Thompson 1999). Our overall aim is to analyze how the presence of stars in the cast of a film persuades spectators to see that film. As there is no universal definition of star, we compare the most common measures of star power used in the industry and in the literature.
The application of nonparametric statistics has considerably improved cinema results modeling (Walls 2009). As the majority of these improvements have occurred with aggregated analysis of the market, in keeping with our aim we propose to do the same with the analysis of individual data. Cinema demand is characterized by complex dynamics which have resulted in the “Nobody knows anything” principle (Goldman 1983). This principle summarizes the tremendous uncertainty of the sector (Walls 2009). In this kind of contexts, where complex relationships between predictor and target variables are expected and where there is no theory to guide model identification, Support Vector Machine (SVM) predicts accurately (Cui and Curry 2005). SVM is a semiparametric technique with origins in the machine learning literature. It is a computational method to automate the process of knowledge acquisitions from data sets. Although promising, the application of machine learning methods in marketing is quite recent and infrequent (Abernethy et al. 2008). It is even scarcer in the analysis of the cinema market (Cheung et al. 2003). However, it has proved to be very successful in many other disciplines apart from statistics and computer science (Steinwart and
4
Christmann 2008). Two of the major drawbacks of SVM are the difficulty of its interpretation and the fact that they are often considered as black box techniques (Devos et al. 2009). In this paper we try to achieve a balance between the extra degree of complexity associated with these tools and their usefulness to increase current knowledge about superstars’ power.
2 Theoretical background
At first glance the persuasion effect of stars could be considered rather obvious. A positive relation could be expected between the presence of a star and the box office results of a film. However, neither the experience of the industry nor the literature can confirm this relationship (Nelson and Glotfelty 2012). Among the explanations that could underlie these counterintuitive results, this paper centers its attention on the nature of star persuasion.
The complexity of star power is not surprising taking into account the nature of persuasion. The earliest researches in the field clashed head on with reality. The causal relationship detected in a particular context between some variables and persuasion could disappear in others or could even have the opposite relation (Cacioppo et al. 1991). Moreover, persuasion has “ironic effects”. Factors that apparently could diminish persuasion can actually enhance it under specific conditions (Dubois 2011). This diversity of results could be integrated under a framework able to recognize that there are different paths to persuasion. Originally, the most influential approach in this sense was the Elaboration Likelihood Model, ELM (Petty and Cacioppo 1981). Essentially the main contribution of this model was the distinction between persuasion as a result of a diligent consideration of central information (central route of persuasion) versus
5
persuasion as the product of simple inferences (peripheral route of persuasion). A central element in the ELM is the notion that there is a continuum in the elaboration (Petty and Wegener 1999). That is to say, there is a continuum in “the extent to which people think about issue-relevant arguments contained in persuasive messages” (Lien 2001). The two routes are associated with the endpoints of that continuum of elaboration (Areni and Lutz 1988). In spite of its popularity and extensive use, the ELM is not exempt of criticism. The majority of its weaknesses stem from the fact that it is a descriptive rather than an analytic model (Eagly and Chaiken 1993). Thus, as a consequence of its descriptive nature, the model fails to explore psychological processes underlying the model and it is difficult to test and falsify (O’Keefe 1990; Mongeau and Stiff 1993). However, it is a useful framework to understand the effect of persuasion and to ascertain under what circumstances some persuasive elements are important or not (Cook et al. 2004).
Another well-established model in social psychology concerned with the effects of persuasion is the Heuristic Systematic Model or HSM (Chaiken et al. 1989). The most important commonality between the ELM and the HSM is that both are dual-process models. While the ELM establishes two different routes to persuasion (central and peripheral), the HSM posits that persuasion may be accomplished via two modes, the systematic mode and the heuristic mode. The systematic mode is related with a high degree of elaboration while the heuristic mode is associated with less effort in the elaboration of message arguments. Thus, systematic processing implies a detailed scrutiny of message data. Heuristic processing implies basing the judgments on simple decision rules (Meyers-Levy and Maheswaran 2004).
Departing from the ELM and HSM as milestones in the persuasion research agenda, Kruglanski and Thompson (1999) proposed the integration of the two processes of
6
persuasion into one. The result is the unimodel of persuasion. Under this integrative model, the ELM and the HSM can be viewed as special cases of the same underlying process. According to the unimodel, persuasion “is a process during which beliefs are formed on the basis of appropriate evidence“ (Kruglanski and Thompson 1999). The notion of persuasive evidence includes all informational contents relevant to a conclusion. The cues/heuristics of the peripheral route/heuristic mode, and the message arguments of the central route/systematic mode can be viewed as different types of persuasive evidence but they do not imply a qualitative difference in the persuasive process. There is only one process of reasoning departing from different types of evidence (O’Keefe 2002). According to this, it can be posited that:
H1: Star power is the result of the whole informational content of the presence of a star in the cast of a film.
One assumption shared by the ELM and the HSM is that persuasion is affected by the recipient’s involvement. The involvement determines the generosity of the recipient in the processing of information (Petty et al. 1983). Central route processing is more likely to occur when involvement is high, while peripheral route processing is more likely to occur when involvement is low (Christensen et al. 1997). There are three factors that positively affect involvement (Olson and Thjømøe 2003): risk perceptions (Batra and Ray 1985), strong personal interest in a subject matter (Zaichkowsky 1994) and general interest in learning (Bloch et al. 1986; Capon and Lutz 1983; Thorelli and Engledow 1980). Broadly speaking, the attendance of a film is a no-risk consumption situation. However, it can be associated to a high level of involvement in the case of spectators that are particularly interested in cinema and enjoy watching cinema films. The ELM
7
and the HSM associate the high involvement with the preponderance of the central route or systematic mode. In fact, this distinction among persuasive effects under different conditions of involvement has been considered as one of the most interesting features of these models in their application to the field of consumer research (Areni and Lutz 1988). So, it could be stated that:
H2: Star power exerted through a central or systematic route of persuasion is more important when spectators’ interest in the cinema market is high.
So far the previous theoretical background and the hypotheses proposed explain which variables should be considered to analyze stars persuasion. The following section presents an empirical study carried out to measure these variables (Section 3.1) and expresses in mathematical terms the expected relationships between those variables (Section 3.2).
3 Methodology
3.1 Data and variables
A personal survey was used to collect the data. Previous studies show that the main segment of cinema audience is young people with high levels of education (Collins et al. 2002), and this coincides with the profile of the cinema audience in the region of Spain where the empirical study was carried out (Ministry of Culture 2011). Taking this profile into account, the population of the study was defined as young people with university studies. A sample of 320 respondents was randomly selected by a stratified sampling, using gender of respondent as the stratification variable. This allowed to have
8
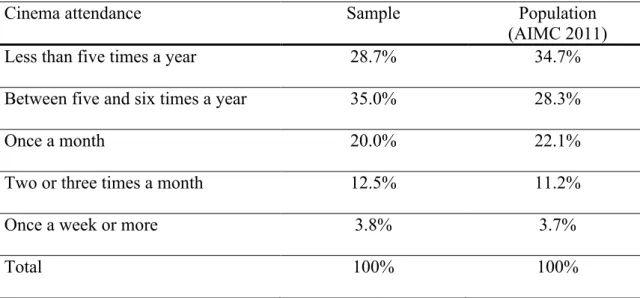
a balanced sample in terms of gender, the same as occurs in the population as a whole (AIMC 2011). Table 1 provides demographic details of the final sample. No biases derived from the target population are expected, taking into account the aim of the study and the fact that superstars have a global dimension. Furthermore, the sample reflects the makeup of the population according to the patrons of cinema attendance (see Table 2). To compare the cinema attendance between the sample and the population a χ2 was
carried out. No statistical differences were found between them (χ2=10.11<𝜒!.!!∗!!,!!!.!"=11.14).
Table 1. Sample profile
Mean Standard Deviation
Age 22.5 2.6
Number % of sample
Male 156 48.8
Female 164 51.2
Table 2. Cinema attendance sample/population
Cinema attendance Sample Population
(AIMC 2011)
Less than five times a year 28.7% 34.7%
Between five and six times a year 35.0% 28.3%
Once a month 20.0% 22.1%
Two or three times a month 12.5% 11.2%
Once a week or more 3.8% 3.7%
9
The questionnaire can be seen in Appendix A. The hypotheses proposed in Section 2 of this paper are related with four variables contained in questions 4, 5, 6 and 7 in the questionnaire. A total of 22 items were used to measure these variables. These items correspond with: knowledge about the stars (question 4-4 items); attitude towards the stars (question 5-9 items); emotional responses associated with the stars (question 6-8 items) and intention of seeing a film (question 7-1 item). All of the variables are the result of the analysis of previous literature to favor their content validity. In the questionnaire in Appendix A the sources of the different variables have been specified. The internal reliability of these variables was measured with Cronbach’s alpha. In the three variables the coefficients were over 0.7, indicating the internal consistency of the variables considered (αknowledge=0.91; αattitude=0.92; αemotional response=0.93).
Two different sources were used to select the stars analyzed: The Ulmer Scale and the STARmeter. Traditionally, the measure of star power was based on certain indicators such as the number of Oscar nominations (i.e. Ravid and Basuroy 2004) or the box office revenue of previous films (i.e. Elberse and Eliashberg 2003). The aim of these indicators is to approach the “bankability” of a star (Redondo and Holbrook 2010). The Ulmer Scale is a global measure of this bankability highly used by the cinema industry. Recent developments in technology communications have allowed the possibility of taking into account the opinion of the spectators to measure the power of the stars. The more the public talk about an actor/actress, the more his/her power. The STARmeter is a superstar ranking based on the users’ searches in IMDB, the most important cinema portal in the world (Karniouchina 2011; Nelson and Glotfelty 2012). Taking into account the 10 most important superstars according to the Hot List of Ulmer’s Scale 2010 and the Top 100 STARmeter Ranking 2010, 17 stars were considered: Brad Pitt, Christian Bale, George Clooney, Gerard Butler, Johnny Depp, Kristen Stewart,
10
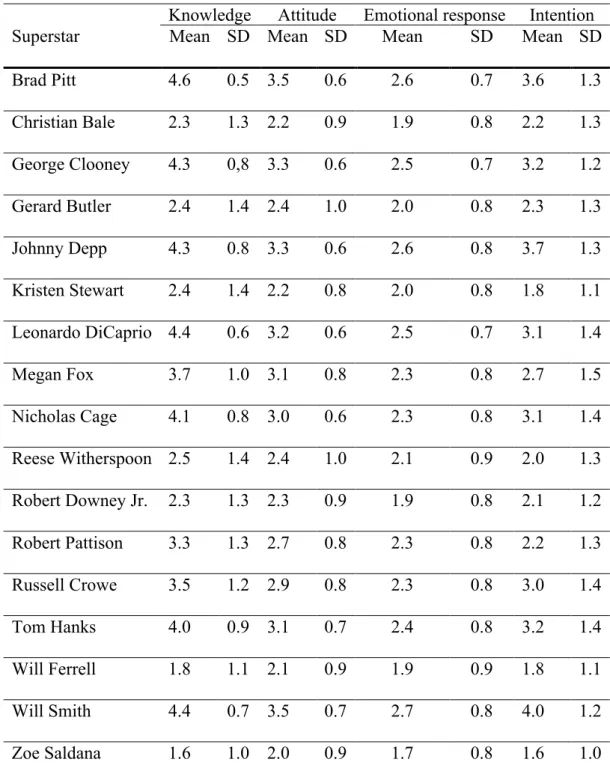
Leonardo DiCaprio, Megan Fox, Nicholas Cage, Reese Witherspoon, Robert Downey Jr, Robert Pattison, Russell Crowe, Tom Hanks, Will Ferrell, Will Smith and Zoe Saldana. Table 3 provides summary statistics on the data.
Table 3: Knowledge, attitude, emotional response and intention (mean, standard deviation)
Knowledge Attitude Emotional response Intention
Superstar Mean SD Mean SD Mean SD Mean SD
Brad Pitt 4.6 0.5 3.5 0.6 2.6 0.7 3.6 1.3 Christian Bale 2.3 1.3 2.2 0.9 1.9 0.8 2.2 1.3 George Clooney 4.3 0,8 3.3 0.6 2.5 0.7 3.2 1.2 Gerard Butler 2.4 1.4 2.4 1.0 2.0 0.8 2.3 1.3 Johnny Depp 4.3 0.8 3.3 0.6 2.6 0.8 3.7 1.3 Kristen Stewart 2.4 1.4 2.2 0.8 2.0 0.8 1.8 1.1 Leonardo DiCaprio 4.4 0.6 3.2 0.6 2.5 0.7 3.1 1.4 Megan Fox 3.7 1.0 3.1 0.8 2.3 0.8 2.7 1.5 Nicholas Cage 4.1 0.8 3.0 0.6 2.3 0.8 3.1 1.4 Reese Witherspoon 2.5 1.4 2.4 1.0 2.1 0.9 2.0 1.3 Robert Downey Jr. 2.3 1.3 2.3 0.9 1.9 0.8 2.1 1.2 Robert Pattison 3.3 1.3 2.7 0.8 2.3 0.8 2.2 1.3 Russell Crowe 3.5 1.2 2.9 0.8 2.3 0.8 3.0 1.4 Tom Hanks 4.0 0.9 3.1 0.7 2.4 0.8 3.2 1.4 Will Ferrell 1.8 1.1 2.1 0.9 1.9 0.9 1.8 1.1 Will Smith 4.4 0.7 3.5 0.7 2.7 0.8 4.0 1.2 Zoe Saldana 1.6 1.0 2.0 0.9 1.7 0.8 1.6 1.0
11
Additionally, the degree of involvement or interest in the cinema market was measured by the frequency of cinema attendance. This variable (question 3 in the questionnaire) was operationalized by means of a five-point scale ranging from 1 (“Less than five times a year”) to 5 (“Once a week or more”). A similar scale is used in official sources about the cinema market (AIMC 2011).
3.2 Empirical model
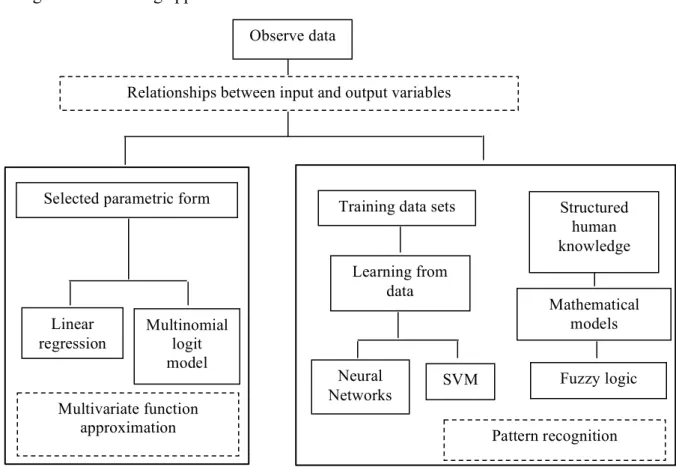
The choice of a causal model from the ever growing kit of statistical tools is not a simple issue. The possibilities range from high parameterized to powerful, but less understandable, tools. It is possible to classify them according with their fundamental approach (see Figure 1).
Figure 1: Modelling approaches
Source: Elaborated departing from Cui and Curri (2005), Viaene et al. (2002) and Kecman (2001) Linear regression Multinomial logit model Learning from data Neural Networks Mathematical models Fuzzy logic Relationships between input and output variables
Observe data
Selected parametric form
Multivariate function approximation
Training data sets
SVM
Structured human knowledge
12
A first distinction can be made between analytical closed-form models, which depart from given structural assumptions, vs. tools that automatize models’ identification processes.
The most popular parameterized models for marketing scientist are the traditional linear regression model and the multinomial logit model, “the gold standard in marketing modeling” (Cui and Curri 2005).
Instead of relying on a particular input-output map, different soft computing techniques offer methods that try to emulate human intelligence. The most important constituents of this problem-solving approach are neural networks, support vector machines and fuzzy logic (Kecman 2001). Neural networks and support vector machines are data-driven models in the sense that determine underlying dependencies between input and output variables departing from experimental data. Neural networks are a very popular alternative and successful applications of this method have been reported in a range of fields. However, support vector machines offer a much powerful alternative both in terms of higher theoretical status (Kecman 2001) and superior predictive capacity (Vianne et al. 2002). Alternatively, there are situations in which inputs are respondents’ feelings or behaviors expressed by linguistic expressions like “not too much”, “rather” or “probably yes”. In those cases, fuzzy logic is able to mimic human thinking departing from that linguistic concepts or fuzzy terms (Zadeh 1988). Fuzzy logic deals with the fuzziness of consumer decision-making. It captures decision makers’ preference structure departing from vague representations of consumers’ preferences or judgments (Benítez et al. 2007).
Taking into account the nature of the problem under study, as well as the characteristics of the input variables, SVMs are used for explaining superstars’ power. The rationality
13
of the use of this technique is thus in the uncertain nature of the relationship between the variables that describe the different routes of superstar persuasion (knowledge, attitude, emotion) and the intention of watching a film. It is expected that between knowledge, attitude or emotion and intention there is not a deterministic relationship, but rather a probabilistic one. The survey-based data provides examples of this relationship. Therefore, the superiority of the SVM over other empirical approaches resides in the fact that it does not require a priori assumptions about how the relationship between the explicative variables related with the different routes of persuasion and the dependent variable is. As explained in the theoretical background section of this paper, previous contributions in the field of persuasion provide evidence about which variables can affect superstars persuasion but there is no theory to guide persuasion model identification. SVM determines the influence of the different explicative variables departing from patterns observed in the dataset itself. The main advantage of applying SVM is precisely its capability of knowledge automation. Departing from the input-output pairs contained in the sample, SVMs choose a function which best describes the relationship between the inputs (knowledge, attitude, emotion) and the output (intention). The “problem of learning” consists in, given the survey-based data, providing a function able to predict the value of intention of watching a film from any value of knowledge, attitude and emotion (Evgeniou et al. 2002). Thus, SVM obtains a function f solving the following optimization problem:
𝑀𝑖𝑛!!
! 𝑦! −𝑓(𝑥!) ! +𝜆 𝑓 ! ! !
!!! (1)
where the xi, i=1,…,l are the inputs; yi are the outputs; f is the model function to be
obtained; 𝑓 !! a smoothness term defined by K, a certain symmetric positive definite
14
between the data and the smoothness terms. The parameter λ is commonly called the regularization parameter, since establishes the trade-off between the complexity of the model and the degree of adjustment, and it is generally optimized to avoid overfitting of the data. The kernel function K is selected in order to establish a relation between the input and the output variables. This function transforms the input variables into features in other space. Then, these features are expected to have a linear relationship with regard to the output. Commonly kernels widely used are the linear kernel, polynomial kernel and Gaussian kernel (of radial basis functions). The former is taken when one expect that the relationship between inputs and output is linear, whereas Gaussian kernel is adopted when a non-linear relationship is expected.
Intuitively, SVM obtains a function f which minimizes the distance between f(xi) and yi,
that is to say, the distance between a function that contains the value of the different explicative variables (x) for each of the 320 individuals analyzed (i) and the value of the dependent variable for each individual (yi).
The form of the resultant f(x) is
𝑓 𝑥 = ! 𝛼!𝐾 𝑥,𝑥! +𝑏
!!! (2)
In this expression, those terms whose 𝛼! ≠0 are called the support vectors. In case of linear kernel, that is 𝐾 𝑥,𝑥! =𝑥∙𝑥! = 𝑥!𝑥
!! !
!!! (m the number of input variables),
the expression of f can be simplified to (exchanging the sum operators)
𝑓 𝑥 = !!!! !!!!𝛼!𝑥!! 𝑥!+𝑏= !!!!𝜔!𝑥! +𝑏 (3)
In case of Gaussian kernel, that is 𝐾 𝑥,𝑥! =𝑒!! !!!! !, it is not possible to extract a
15
Thus, the SVM combines concepts from abstract Hilbert spaces with optimization techniques (Cui and Curry 2005). A technical explanation of this method can be seen in Cristianini and Shawe-Taylor (2000) and Schölkopf and Smola (2002). It is considered a powerful tool in machine learning, since it has two great advantages. First, it handles many variables at low computational cost and, secondly, it successfully deals with noise variables.
According to hypothesis 1 (“Star power is the result of the whole informational content of the presence of a star in the cast of a film”), the explicative variables (x) are the four items used to measure knowledge about a star (central route/systematic mode of persuasion) and the 9 and 8 items used to measure attitude towards stars and emotion elicited by stars, respectively (peripheral route/heuristic mode of persuasion). The empirical model describes how these variables persuade spectators, so the dependent variable is the intention of seeing a film (y). Hypothesis 2 states that “Star power exerted through a central or systematic route of persuasion is more important when spectators’ interest in the cinema market is high”. As a consequence, two optimal approximation functions are estimated to analyze differences in the consumer responses of individuals with different degrees of involvement in the consumption of cinema products (low involvement/high involvement).
In the following section we present an application in which SVMs are used to explain superstars’ power.
16
4 Results
We compare the performance of the SVMs against the naive approaches of using linear regression (LR) and multinomial logit (MNL) models.
We used the following specification of the linear regression model:
𝐼𝑛𝑡𝑒𝑛𝑡𝑖𝑜𝑛 =𝛽!+𝛽!𝐾𝑛𝑜𝑤𝑙𝑒𝑑𝑔𝑒+𝛽!𝐴𝑡𝑡𝑖𝑡𝑢𝑑𝑒+𝛽!𝐸𝑚𝑜𝑡𝑖𝑜𝑛+𝜖 (4)
Where i indexes the individual spectator and j each of the superstars (j=1 Brad Pitt…j=17 Zoe Saldana).
The previous expression reflects the first estimated model. We also estimated six additional models, three of them with each one of the three explicative variables (knowledge, attitude, emotion) and three considering the different combinations of these three variables (knowledge-attitude; knowledge-emotion; attitude-emotion). This allowed us to explore the relevance of the alternative routes to persuasion. Each of these models was estimated for two segments characterized by different interest in the cinema market. While the first segment includes people with low interest in the cinema market, people with high interest in the cinema market integrate the second segment. We estimated 14 additional multinomial logit models (seven for spectators with low interest in the cinema market and seven for spectators with high interest) using the same dependent variable (intention of watching a film) and the same combinations of the explicative variables (knowledge-attitude-emotion; knowledge; attitude; emotion; knowledge-attitude; knowledge-emotion; attitude-emotion).
We finally estimated the SVMs using the same sets of explicative variables described above as inputs or attributes and the intention of seeing a movie as the output or class.
17
As there was not a priori criterion to know whether the input space was linearly or non-linearly separable, two multiclass SVM models were trained on the full data set. In the first multiclass SVM model (SVM linear) a linear kernel was used, while the Gaussian kernel was used in the SVM Gauss. SVM linear assumes the input space is linearly separable while SVM Gauss does not. In SVM linear and SVM Gauss a 5-fold cross-validation was repeated twice. In SVM linear, the regularization parameter was established performing a grid search over the values 𝜆∈ 10!,𝑝∈ −2,2 optimizing the mean absolute error estimated by means of a balanced 2-fold cross validation repeated 3 times. In SVM Gauss, both the regularization parameter and the kernel parameter were set in the same way, but the regularization parameter taking values in
{(10!)/2,𝑝∈[−3,3]}. The package LIBSVM was used as a library for the SVMs (Chang and Lin 2013).
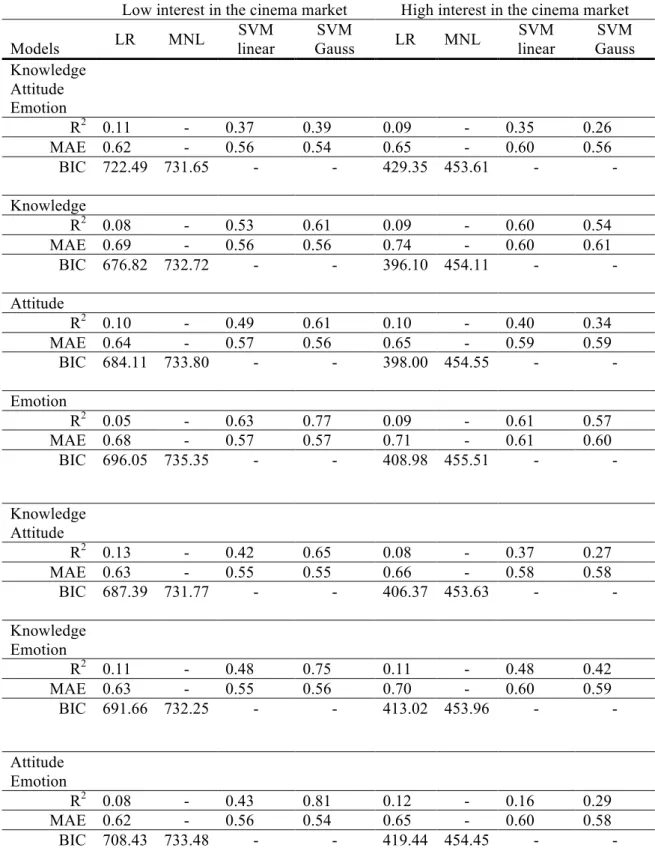
We compared the models in terms of goodness-of-fit using different measures. We initially fitted the linear regression models by least squares estimation what allowed us to compare their R2 and Mean Absolute Errors with those measures in the SVM linear and in the SVM Gauss. Additionally, we used SAS’s GEN MOD procedure to re-fit the linear regression models by maximum likelihood estimation. The resulting values of the likelihood functions were used to compare the regression linear models and the multinomial logit models using the Bayesian Information Criterion (BIC). We estimated the multinomial logit models by LIMDEP’s NLOGIT. Table 4 summarizes these metrics.
18 Table 4. Summary of estimated models fit
Low interest in the cinema market High interest in the cinema market Models LR MNL SVM linear SVM Gauss LR MNL SVM linear SVM Gauss Knowledge Attitude Emotion R2 0.11 - 0.37 0.39 0.09 - 0.35 0.26 MAE 0.62 - 0.56 0.54 0.65 - 0.60 0.56 BIC 722.49 731.65 - - 429.35 453.61 - - Knowledge R2 0.08 - 0.53 0.61 0.09 - 0.60 0.54 MAE 0.69 - 0.56 0.56 0.74 - 0.60 0.61 BIC 676.82 732.72 - - 396.10 454.11 - - Attitude R2 0.10 - 0.49 0.61 0.10 - 0.40 0.34 MAE 0.64 - 0.57 0.56 0.65 - 0.59 0.59 BIC 684.11 733.80 - - 398.00 454.55 - - Emotion R2 0.05 - 0.63 0.77 0.09 - 0.61 0.57 MAE 0.68 - 0.57 0.57 0.71 - 0.61 0.60 BIC 696.05 735.35 - - 408.98 455.51 - - Knowledge Attitude R2 0.13 - 0.42 0.65 0.08 - 0.37 0.27 MAE 0.63 - 0.55 0.55 0.66 - 0.58 0.58 BIC 687.39 731.77 - - 406.37 453.63 - - Knowledge Emotion R2 0.11 - 0.48 0.75 0.11 - 0.48 0.42 MAE 0.63 - 0.55 0.56 0.70 - 0.60 0.59 BIC 691.66 732.25 - - 413.02 453.96 - - Attitude Emotion R2 0.08 - 0.43 0.81 0.12 - 0.16 0.29 MAE 0.62 - 0.56 0.54 0.65 - 0.60 0.58 BIC 708.43 733.48 - - 419.44 454.45 - -
Taking into account that a lowest value of BIC is considered the best fitting model, it can be said that LR outperforms MNL. In turn, SVMs yield much more stable results on
19
the different goodness-of-fit measures than LR. In the seven considered models, and for each of the two segments, the average deviation of the predictions (MAE) is lower in SVM than in LR and the correlation between fitted and actual values (R2) is higher. The superiority of SVM is even clearer if we take into account the diagnostic power of the different models. While in the LR and MNL is not possible to find differences between segments, the SVM is able to detect differences in the explaining capacity of the different routes of persuasion between the segments with high and low interest in the cinema market. Therefore, it would be a serious mistake to apply LR or MNL to analyze star power in the context of this study.
Given the superiority of the SVM Gauss, we proceed to analyze the difference between the models according to this approach. In Appendix B the mean absolute errors can be seen of the seven models estimated for each of the 17 superstars considered. Tables B1 and B2 in the appendix show the mean absolute errors indicating in parentheses the rank of those errors. For each of the 17 superstars the model with minimum error has a rank of 1 while the model with maximum error has a rank of 7. Average ranks are computed in the case of ties. The ranking of the mean absolute errors allows us to perform hypothesis tests for comparison of the various models on the multiple superstars within the nonparametric framework by means of the Iman and Davenport test (1980). This statistic is a nonparametric test equivalent of the repeated measures ANOVA (Demšar 2006).
𝐹! = !!! !!!
!!!! !!!! (5)
Where 𝑋!! is the Friedman statistic (Friedman 1937, 1940), N is the number of
20 𝑋!! = !"! ! !!! 𝑅! ! ! −!!!! ! ! (6)
Rj is the average rankof models.
The FF is distributed according to the F-distribution with (6, 96) degrees of freedom ((k -1) and (k-1)(N-1)).
The result of the Iman and Davenport test is in Table 5 allows us to reject the hypothesis that there are not differences between the mean absolute errors of the different models. The lowest mean absolute error corresponds with the model that contains all the variables that potentially influence the persuasion effect of superstars (Knowledge-Attitude-Emotion). It is worth noting that in any case the knowledge about a star, which represents the central/systematic route of persuasion, is in itself a good predictor of the intention of seeing a film. Its influence is exerted in combination with the variables that define a peripheral route of persuasion (the attitudes and emotions towards the stars). Thereby, this result is coherent with the content of Hypothesis 1. Star power can be explained as the result of the whole informational content associated with the presence of a star in the cast of a film. Besides, there are some differences in the importance of the distinct routes of superstars’ persuasion depending on spectators’ involvement. This allows us to bring direct evidence to our second maintained assumption. As was predicted by Hypothesis 2, the central/systematic route of persuasion is more important for spectators with high interest in the cinema market. In fact, in the segment with low interest in the cinema market, the mean absolute error of the model which includes the variables of the central/systematic route and of the peripheral/heuristic route is the same as the mean absolute error of the model that includes the variables of the peripheral route (0.54). However, in the segment of spectators with high interest in the cinema market the mean absolute error of the model that includes all the persuasion routes
21
(0.56) is lower than the mean absolute error of the model that includes the peripheral route (0.58). The Nemenyi test was performed as a statistical test for the hypothesis that the difference between those mean absolute errors is equal to zero. It is a post-hoc test similar to the Tukey test for ANOVA (Demšar 2006). The performance of the two models is significantly different if the corresponding average ranks of the mean absolute errors differ by at least the critical difference
𝐶𝐷 =𝑞∝ !(!!!!! ) (7)
Critical values qα are based on the Studentized range statistic divided by 2.
The result of this statistical test, summarized in Table 5, confirms the importance of the central or systematic route of superstars persuasion in the case of spectators highly involved in the cinema market.
Tabla 5. Summary of hypothesis testing results
Hypothesis Statistical test
H1 FF 16.69 𝐹∗!,!" ,!!!.!" 2.19
H2 Difference of average rank 0.47 CDNemenyi 0.33
5 Main conclusions
To explain the absence of unanimity in the star power research, previous studies have pointed out that stars are just one of the numerous factors that could affect the results of a film. Many other film characteristics, such as genre, plot or nationality could favor or disfavor market response. The intention of this paper is to isolate the effect of a cast of superstars in the “success package” of a film. It complements other studies based on
22
aggregated analyses of the market. Previous literature concluded that the star system is a cornerstone of the film industry even when this relevance cannot be justified with financial arguments (Ravid 1999). This study contributes in explaining how to improve the results of the apparently blind faith in superstars. De Vany and Walls (1999) argue that the audience decides the fate of a film. This study extends this vision explaining spectators’ decision process. The results are theoretically and practically meaningful: (a) They address the relationship between the presence of superstars and the intention of seeing a film. Conceiving superstars’ power as the influence of stars on spectators behavior, it is possible to use the extensive literature about persuasion as a useful framework for approaching the superstar phenomenon. It enables us to explain how a cast of leading actors can kick-off a film's discovery. This process precedes the information cascade that drives the demand for films.
(b) Many star definitions coexist in a sector avid of rankings. In this study the two most important sources in the cinema industry have been used: the Ulmer Scale and the Starmeter. This allows us to avoid the bias of a sole definition of superstar.
(c) As superstar power is expected to be a complex phenomenon, SVMs have been applied to analyze the variables that condition superstars’ persuasion. This approach implies using the spectators’ responses to know under which pattern the intention of seeing a film is built. The results have shown that this approach is much better than the naive approaches of applying linear regression or multinomial logit models.
From the results of the SVMs, it is possible to conclude that, as was expected by Hypothesis 1, the reaction of spectators to the presence of a superstar in the cast of a film is the result of all the information associated with this stimulus. This information is based on what is known about the star and there are also peripheral cues that determine
23
attitudes and emotions towards the stars. Informational content and peripheral cues act together to influence spectators. As stated in Hypothesis 2 in this research, the importance of this persuasive evidence depends on the degree of involvement of the spectators. The global view of the persuasion exerted by superstars is more consistent in spectators with a high interest in the cinema market. It is superior to any other partial explanation of persuasion. However, in spectators with a low interest in the cinema market, the prediction capacity of the variables associated with a peripheral/heuristic route to persuasion is as good as the prediction capacity of the global persuasion model. From an academic point of view this research has two main differences from previous studies:
(a) Instead of analyzing if the presence of a superstar in the cast of a film increases box office revenue, it is centered on the roots of this possible influence. In doing so, it applies the theory of persuasion to explain the influence that superstars exert over spectators.
(b) Starting from the analysis of individual spectators, this paper uses SVMs for mining the paths to superstars’ persuasion. It is one of the few applications of machine learning from a marketing perspective. The results show that these methods put forth in the study are worthy of being added to modelers’ toolkits.
This novel approach allows extracting relevant implications for the cinema sector. It gives some clues about the relevant keys to create and maintain the superstar halo. The superstars’ persuasion depends on what is known about him or her but also on the attitudes and emotions elicited in the spectators. The influence of the information content about a superstar is the result of some process of reasoning. However, the influence of attitudes and emotions is exerted without a previous reflection process. This latter “motorway of decision” is particularly important for spectators without a
24
high interest in the cinema market. So, if the presence of a superstar is intended to create a potential hit or blockbuster, previous public relation campaigns should be centered on aspects not necessarily related with the experience of the stars but with facts able to elicit positive attitudes and emotions. This is consistent with anecdotal evidence that superstars tend to deliberately communicate aspects of their personal lives just to improve their public image. However, if a film is oriented towards a highly involved audience, this type of information should be accompanied with more informational content about the merits of the stars. Social media is the most important channel for sharing information about attitudes and emotions. The predominance of these tools takes away control in the process of maintaining superstars' power from the industry in benefit of the general public. All in all, this study sheds some light on how the industry should manage stars’ information to affect filmgoers’ discovery of films, that is, superstars’ informational cascade1. This paper demonstrates that claims with high levels of affect-laden content should be more effective than references to the commercial or artistic track record of the superstars. This is coherent with previous literature predictions that the commercial or artistic track record of lead actors and film success do not always go hand in hand. This study shows that they are not enough to trigger the information cascade about the film. When spectators’ interest in the cinema market is low, star-evoked attitudes and emotions may influence the intention to watch a film through heuristic mechanisms such as affect transfer. In the case of spectators highly interested in the cinema market, star-evoked attitudes and emotions influence the intention to watch a film by shaping the knowledge they have about the star.
For further research, we suggest overcoming the limitations of the study related with the sample analyzed. While the young segment is the most important in the cinema demand,
25
it would be very interesting to analyze superstars’ persuasion in different segments. Although this paper is centered on superstars' power, it could be very appealingto study the synergy effect between superstars and other film characteristics. It could also be very useful to attempt to map intention metrics to actions. Lastly, as SVMs seem to perform well in the type of problem analyzed, another direction for future research could consider the potential of transferring the knowledge about spectators’ behavior into mathematical models by means of fuzzy logic.