Procedia Engineering 79 ( 2014 ) 355 – 361
1877-7058
© 2014 Elsevier Ltd.
This is an open access article under the CC BY-NC-ND license (http://creativecommons.org/licenses/by-nc-nd/3.0/).Selection and peer-review under responsibility of the National Tsing Hua University, Department of Power Mechanical Engineering
doi: 10.1016/j.proeng.2014.06.355
ScienceDirect
37th National Conference on Theoretical and Applied Mechanics (37th NCTAM 2013) & The 1st
International Conference on Mechanics (1st ICM)
Automated Fault Classification of Reciprocating Compressors from
Vibration Data: A Case Study on Optimization using Genetic
Algorithm
Yih-Hwang Lina,
*
, Wen-Sheng Leea c, , Chung-Yung Wub ,*a Department of Mechanical and Mechatronic Engineering, National Taiwan Ocean University, Keelung 20224, Taiwan, ROC bAutomation and Instrumentation System Development Section, Iron and Steel R&D Department, China Steel Corporation, Kaohsiung 81233,
Taiwan, ROC
c
Present affiliation: ME Section, DD LOB, Power SBG Development, LITE-ON Technology Corp., Taoyuan County 33754, Taiwan, ROC
Abstract
This article deals with automated fault classification of reciprocating compressors from vibration data. The genetic algorithm was applied to automate the process. A total of 15 fault cases based on practical observation of the machine faults was considered. Vibration data for the various fault cases were collected and processed using the time-frequency analysis, namely the short time Fourier transform (STFT), the smoothed pseudo Wigner-Ville distribution (SPWVD), and the reassigned smoothed pseudo Wigner-Ville distribution (RSPWVD), due to the non-stationary vibration characteristics of the system analyzed. The fault features for the formidable amount of time-frequency data were extracted first and fed into an artificial neural network for fault classification. It is demonstrated in this work that it is feasible to apply the genetic algorithm to automate the fault classification process and thereby minimize the requirement for intervention from the human experts.
© 2013 The Authors. Published by Elsevier Ltd.
Selection and peer-review under responsibility of the National Tsing Hua University, Department of Power Mechanical Engineering.
Keywords: Fault Classification; Reciprocating Compressor; Genetic Algorithm
* Corresponding author. Tel.: +886-2-2-462-2192; fax: +886-2-2-462-0836.
E-mail address: [email protected]
© 2014 Elsevier Ltd. This is an open access article under the CC BY-NC-ND license (http://creativecommons.org/licenses/by-nc-nd/3.0/).
Selection and peer-review under responsibility of the National Tsing Hua University, Department of Power Mechanical Engineering
1.
Introduction
To prevent catastrophic failure, monitoring and classification of machinery conditions are crucial to provide early
warning for deterioration and to ensure timely maintenance. Valve faults are among the most frequently encountered
problems in practice for reciprocating compressors and research efforts on fault detection and classification of
valves have been reported in the literature [1-5]. The authors of the present paper [2, 3] reported that it is feasible to
classify the valve conditions of a reciprocating compressor using the time-frequency analysis and the artificial
neural network. It was demonstrated that 80% classification accuracy can be realized, as opposed to the original
20% accuracy only, if proper modification indices were applied. Classification accuracy can be further enhanced by
removing similar fault cases. Note that it is vital for a classification system to differentiate the minute difference of
the fault cases such that
early warning of the machine’s health conditions
can be given. Removing similar fault cases
defeats this important capability. In this study, we propose an optimization strategy using genetic algorithm to
automate the classification process without removing the similar fault cases. Time-frequency partitions are applied
to reveal more features of the time-frequency data sets.
A total of fifteen seeded fault cases which reflect the typical problems the valve system commonly encountered
in practice is considered. The fault cases are: normal condition (spring plate stiffness K = 5306.35 N/m),
misplacement of the valve and spring plates, over-tightening of the valve seat (24.53 N-m), moderately inadequate
tightening of the valve seat (14.72 N-m) , inadequate tightening of the valve seat (9.81 N-m), moderately inadequate
tightening of the valve cover (14.72 N-m), inadequate tightening of the valve cover (9.81 N-m), softening of the
spring plate (K = 4054.65 N/m), softening of the spring plate (K = 4329.15 N/m), softening of the spring plate (K =
2886.25 N/m), cracked spring plate, cracked valve plate, spring plate with the inner end broken, valve plate with the
inner end broken, valve plate with the outer end broken, respectively.
2.
Experimental procedure and analysis approach
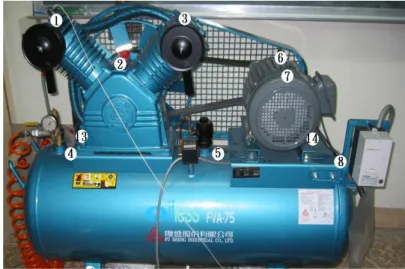
Figure 1 shows the reciprocating compressor under consideration. An accelerometer was mounted on the valve
cover to measure the non-stationary vibration. In preparing the seeded faults, the spring constants of the valve
springs used in various fault cases were tested using the MTS facility, as shown in Fig 1(b).
(b)
Fig.1. Experimental setup (a) the reciprocating compressor with an accelerometer mounted on the valve cover (point 1), and (b) the MTS testing facility for evaluation of the spring constants of the spring plates for seeded fault preparation.
A typical vibration signal measured at the valve cover of the reciprocating compressor is shown in Fig. 2. The
valve operation events are indicated. To identify the valve faults, the conventional FFT analysis, with the time
information being missing, blurs the minute changes due to early deterioration of the valve system and a more
precise approach is essential for successful analysis.
Fig.2. A typical accelerations signal with valve operation events indicated (DC: discharge valve close, DO: discharge valve open, SC: suction valve close, SO: suction valve open. )
The time-frequency analysis techniques are applied in this study to reveal the spectral information with respect to
time, which include the short time Fourier transform (STFT) [6-8], the smoothed pseudo Wigner-Ville distribution
(SPWVD) [6-9], and the reassigned smoothed pseudo Wigner-Ville distribution (RSPWVD) [10-13]. A fault feature
vector, including time, frequency, and spectrum amplitude, is extracted from the formidable amount of
time-frequency data to facilitate later processing using an artificial neural network. Modification of the fault feature
Am plitude (g) Am plitude ( V ) 0 0.02 0.04 0.06 0.08 0.1 0.12 0.14 0.16 0.18 0 0.02 0.04 0.06 0.08 0.1 0.12 0.14 0.16 0.18 Time (sec) Cycle 1 Cycle 2 DC SO SC DO DC SO SC DO 20 10 0 -10 -20 6 4 2 0 -2 0.015 0.015
vector for better performance has been reported [2, 3]. The probabilistic neural network (PNN) [14, 15] is applied in
this study. Figure 3 shows a typical time-frequency analysis results with two partitions both in time and frequency.
The red dots indicate the centroid location of each time/frequency partition.
Fig.3. A typical time-frequency analysis result from the measured vibration signal with two partitions both in time and frequency and red dots indicating the centroid location of the respective time/frequency partition.
Genetic algorithm [16, 17] is utilized in this study to automate the fault classification process. The optimization
search iterates through the processes of reproduction, crossover, and mutation, until the termination condition is
satisfied.
3.
Optimization results
For the genetic algorithm applied in this study, the maximum generation, chromosome length, and termination
precision, are chosen to be 20, 5, and 0.01, respectively. Mean variation method for modification of the original
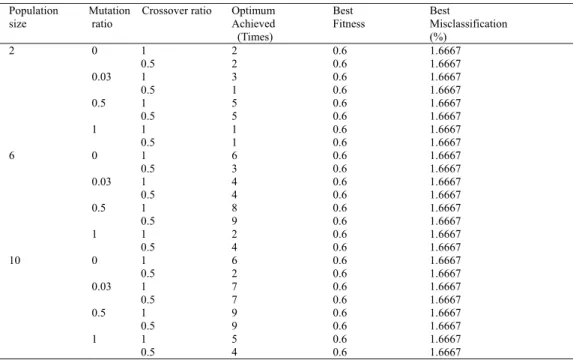
feature vector is considered [2]. Table 1 shows the optimization results with the fitness function
–p(x),
the
misclassification of the PNN, being used. Optimization in frequency partitioning is considered first without
partitioning in time. As can be seen, a favourable result with optimum achieved can be seen with population size,
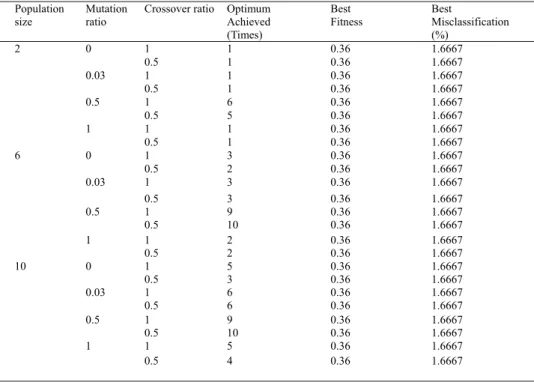
mutation ratio, and crossover ratio being 10, 1, and 0.5, respectively. Tables 2-3, show the optimization results with
fitness function 1/
p(x)
and
21 / ( )
p x
, being used respectively. As can be seen, the optimum achieved can be greatly
affected by the selection of fitness function. Table 4 shows the optimization results for the three time-frequency
analysis approaches. As can been, the SPWVD with one partition in time performs best in consideration of the
optimum achieved and the computation speed. The speed improvement is based on the comparison with the baseline
computation for evaluating all classification work in the design space without optimization. It appears the case of
two partitions in time demands more computation effort without improved performance on the optimum achieved.
4.
Conclusions
The feasibility of using genetic algorithm for automated valve fault classification of reciprocating compressor
possessing non-stationary vibration characteristics has been demonstrated in the work. The parameters affecting the
optimization performance were analyzed. It shows optimization using the genetic algorithm is capable of reaching
the global optimum without removing the similar faults, as was done in the previous reports. The classification
system can then tackle the problem of minute change in the valve health condition for early detection of machine
STFT 0 0.005 0.01 0.015 0.02 0.025 0.03 Time (sec) Frequency (Hz) 2 1.8 1.6 1.4 1.2 1 0.8 0.6 0.4 0.2 0 ൈͳͲସ
Table 1. The GA Optimization with fitness function
p x
( )
being used
Table 2. The GA Optimization with fitness function 1/
p(x)
being used
Population
size ratioMutation Crossover ratio Optimum Achieved (Times)
Best
Fitness MisclassificationBest (%) 2 0 1 0 -2.333 2.333 0.5 0 -2 2 0.03 1 2 -1.6667 1.6667 0.5 1 -1.6667 1.6667 0.5 1 0 -2 2 0.5 2 -1.6667 1.6667 1 1 0 -2 2 0.5 0 -2 2 6 0 1 0 -2 2 0.5 2 -1.6667 1.6667 0.03 1 0 -2 2 0.5 4 -1.6667 1.6667 0.5 1 4 -1.6667 1.6667 0.5 4 -1.6667 1.6667 1 1 2 -1.6667 1.6667 0.5 4 -1.6667 1.6667 10 0 1 5 -1.6667 1.6667 0.5 3 -1.6667 1.6667 0.03 1 3 -1.6667 1.6667 0.5 5 -1.6667 1.6667 0.5 1 7 -1.6667 1.6667 0.5 4 -1.6667 1.6667 1 1 2 -1.6667 1.6667 0.5 7 -1.6667 1.6667 Population
size Mutationratio Crossover ratio Optimum Achieved (Times)
Best
Fitness BestMisclassification (%) 2 0 1 2 0.6 1.6667 0.5 2 0.6 1.6667 0.03 1 3 0.6 1.6667 0.5 1 0.6 1.6667 0.5 1 5 0.6 1.6667 0.5 5 0.6 1.6667 1 1 1 0.6 1.6667 0.5 1 0.6 1.6667 6 0 1 6 0.6 1.6667 0.5 3 0.6 1.6667 0.03 1 4 0.6 1.6667 0.5 4 0.6 1.6667 0.5 1 8 0.6 1.6667 0.5 9 0.6 1.6667 1 1 2 0.6 1.6667 0.5 4 0.6 1.6667 10 0 1 6 0.6 1.6667 0.5 2 0.6 1.6667 0.03 1 7 0.6 1.6667 0.5 7 0.6 1.6667 0.5 1 9 0.6 1.6667 0.5 9 0.6 1.6667 1 1 5 0.6 1.6667 0.5 4 0.6 1.6667
Table 3. The GA optimization with fitness function
21 / ( )
p x
being used
Population
size Mutationratio Crossover ratio Optimum Achieved (Times)
Best
Fitness BestMisclassification (%) 2 0 1 1 0.36 1.6667 0.5 1 0.36 1.6667 0.03 1 1 0.36 1.6667 0.5 1 0.36 1.6667 0.5 1 6 0.36 1.6667 0.5 5 0.36 1.6667 1 1 1 0.36 1.6667 0.5 1 0.36 1.6667 6 0 1 3 0.36 1.6667 0.5 2 0.36 1.6667 0.03 1 3 0.36 1.6667 0.5 3 0.36 1.6667 0.5 1 9 0.36 1.6667 0.5 10 0.36 1.6667 1 1 2 0.36 1.6667 0.5 2 0.36 1.6667 10 0 1 5 0.36 1.6667 0.5 3 0.36 1.6667 0.03 1 6 0.36 1.6667 0.5 6 0.36 1.6667 0.5 1 9 0.36 1.6667 0.5 10 0.36 1.6667 1 1 5 0.36 1.6667 0.5 4 0.36 1.6667
Table 4. Optimization performance of the various time-frequency techniques
Optimum Achieved
(Times) Speed Improvement (%) STFT PT1 6 36.895 PT2 6 -26.4 SPWVD PT1 8 43.059 PT2 4 -22.645 RSPWVD PT1 6 35.088 PT2 6 -4.9637
PT1 (No. of Partitions in Time: 1) PT2 (No. of Partitions in Time: 2)
health deterioration. The efficiency of the algorithm depends on many factors, such as the optimization parameters,
time-frequency analysis method, feature vector index modification method, etc. A proper choice of the analysis
parameters can greatly enhance the computation speed and improve the ultimate convergence problem, as usually
encountered in implementing optimization strategy.
Acknowledgements
The authors are grateful to the China Steel Corporation and the National Science Council (NSC), Taiwan,
Republic of China, for the financial support under contracts 92T1F-RE012 and NSC101-2221-E-019-002,
respectively.
References
[1] W. Bao, R. Zhou, J.-G. Yang, D.-R. Yu, N. Li, Anti-aliasing lifting scheme for mechanical vibration fault feature extraction, Mechanical Systems and Signal Processing 23 (2009) 1458-1473.
[2] Y.-H. Lin, H.-S. Liu, C.-Y. Wu, Automated valve condition classification of a reciprocating compressor with seeded faults: experimentation and validation of classification strategy, Smart Materials and Structures 18 (2009) 095020.
[3] Y.-H. Lin, H.-C. Wu, C.-Y. Wu, Automated condition classification of a reciprocating compressor using time–frequency analysis and an artificial neural network, Smart Materials and Structures 15 (2006) 1576–1584.
[4] C.-D. Wang, Y.-Y. Zhang, Z.-Y. Zhong, Fault diagnosis for diesel valve trains based on time-frequency images, Mechanical Systems and Signal Processing 22 (2008) 1981-1993.
[5] Q.-H. Wang, Y.-Y. Zhang, L. Cai, Y.-S. Zhu, Fault diagnosis for diesel valve trains based on non-negative matrix factorization and neural network ensemble, Mechanical Systems and Signal Processing 23 (2009) 1683-1695.
[6] L. Cohen, Time-Frequency Analysis, Englewood Cliffs, Prentice-Hall, New Jersey (1994). [7] L. Cohen, Time–frequency distributions—a review, Proceedings of the IEEE 77 (1989) 941–981.
[8] F. Hlawatsch, F. G. Boudreaux-Bartels, Linear and quadratic time–frequency signal representations, IEEE Signal Processing Magazine 9 (1992) 21–67.
[9] P. Flandrin, O. Rioul, Affine smoothing of the Wigner–Ville distribution, Proceeding IEEE ICASSP-90 (Albuquerque) 5 (1990) 2455–2458. [10] F. Auger, P. Flandrin, Generalization of the reassignment method to all bilinear time-frequency and timescale representations, Proceedings
of the IEEE ICASSP 4 (1994) 317–320.
[11] F. Auger, P. Flandrin, Improving the readability of time-frequency and timescale representations by the reassignment method, IEEE Transactions Signal Processing 43 (1995) 1068–1089.
[12] E. Chassande-Mottin, F. Auger, P. Flandrin, Supervised time-frequency reassignment, IEEE International Symposium On Time-Frequency and Time-Scale Analysis (June) (1996) 517–520.
[13] I. Djurovic, L. Stankovic, A reassignment based method for time-frequency representation, The 6th IEEE International Conference (September) 3 (1999) 5–8.
[14] L. Guo, J. Chen, X.-L. Li, Rolling bearing fault classification based on envelope spectrum and support vector machine, Journal of Vibration and Control 15 (2009) 1349-1363.
[15] D. F. Specht, Probabilistic neural networks and polynomial adaline as complementary techniques for classification, IEEE Transactions Neural Networks 1 (1990) 111–121.
[16] J. H. Holland, Adaptation in Natural and Artificial Systems, The University of Michigan Press (1975). [17] M. Mitchell, An Introduction to Genetic Algorithms, The MIT Press (1999).