537
Journal homepage: http://www.journalijar.com INTERNATIONAL JOURNAL Journal DOI:10.21474/IJAR01 OF ADVANCED RESEARCHRESEARCH ARTICLE
MODELING OF SHEAR STRENGTH-WATER CONTENT RELATIONSHIP OF ULTRA-SOFT CLAYEY SOIL.
*Aram M. Raheem 1, and Mohammad S. Joshaghani2. 1. Ph.D., Civil Engineering Department, University of Kirkuk, Kirkuk, Iraq.
2. Ph.D. Student, Civil and Environmental Engineering Department, University of Houston, TX, USA.
Manuscript Info
Abstract
Manuscript History:
Received: 18 February 2016 Final Accepted: 22 March 2016 Published Online: April 2016
Key words:
Ultra-soft soil, shear strength, water content, new mathematical models. *Corresponding Author
Aram M. Raheem.
In this study, a detailed review on the reported correlations of shear strength and physical properties of soft soil has been investigated. An ultra-soft soil has been prepared from 2% to 10% bentonite clay soil with high water content. The shear strength of the prepared ultra-soft soil has been tested using modified vane shear device. Based on collected data and experimental results, two new mathematical models for shear strength-water content relationship has been proposed for shear strength and water content ranged from 6 kPa to 0.1 kPa and 50% to 1100% respectively. The second proposed model was compared with several reported models from literature to demonstrate shear strength-water content relationship for ultra-soft soil with low shear strength and high water content. The second proposed model has shown a very good agreement with the experimental results with coefficient of determination (R2) up to 0.91.
Copy Right, IJAR, 2016, All rights reserved.
Introduction:-
In 1911, Atterberg suggested the boundaries of consistency for agricultural basics to obtain an obvious view for the range of water contents of a soil in the plastic state (Casagrande, 1932). The bounds of soil consistency specifically liquid limit (wL) and plastic limit (wP), well known as Atterberg limits (Casagrande, 1932, 1958), were systematized by Casagrande (1932, 1958) and expanded for classification of fine-grained soils.
These limits are regulated using simple tests, which are mainly strength based. Attempts have been done from 1911 onwards to understand Atterberg limits and create improved methods of determining the equivalent limits. Due to different restrictions of the rolling thread method of quantifying plastic limit, especially human beings errors, efforts have been made to get the same from cone method (Hansbo, 1957; Towner, 1973; Campbell, 1976, 1983; Wood and Wroth, 1978; Belviso et al., 1985; Sampson and Netterberg, 1985; Wasti and Bezirci, 1986; Rao, 1987; Harison, 1988; Feng, 2004; Al-Dahlaki and Al-Sharify, 2008; Rashid et al., 2008; Lee and Freeman, 2009; and Sivakumar et al., 2009).
Sridharan et al. (1999) have come up with a method to quantify plastic limit through the correlation developed between plasticity index and flow index. In most of the tries to develop the testing techniques to quantify liquid limit and plastic limit, researchers have attempted to express liquid limit and plastic limit as strength based water content, and hence, the testing methods to quantify them. Lambe and Whitman (1979) correlated Atterberg limits for a soil to the amount of water attracted to the surface of the soil particles. It is well carried out by Sridharan and Venkatappa Rao (1979), Sridharan et al. (1986, 1988), Sridharan and Prakash (1999) that the mechanisms governing undrained shear strength and liquid limit for kaolinitic soils is unlike montmorillonitic soils. In fact, it cannot be presumed that the strength at the liquid limit content to be the same for all soils. This characteristic has been approved by the results stated by Kenney (1963). Undrained shear strength of remolded clays have a robust correlation with the liquid limit and the plastic limit provided the shear strength at these limits can be correlated with each other. Based
538
on the fact that soil adopts a unique state at the liquid limit, the soil has unique shear strength and that this shear strength stands a definite relationship with that at the plastic limit (Sharma and Bora, 2003).As early as 1939, Casagrande proposed an average shear strength of soil at the liquid limit as 2.65 kN/m2 taking in consider a large spread of values depending on the apparatus used for determining the liquid limit. Norman (1958) stated that the shear strength at the liquid limit controlled by using an apparatus compliant to the British standard ranged from 0.8 to 1.6 kN/m2 whereas using an apparatus of ASTM standards, the strength varied from 1.1 to 2.3 kN/m2. Skempton and Northey (1952) described the value of shear strength at the liquid limit of four soils with very different values of plasticity index as 0.7 kN/m2to1.75 kN/m2. Youssef et al. (1965) found that the values of shear strength of clay at the liquid limit of a large number of soils (liquid limit varying from 32 to 190%) ranged from 2.4 to 1.3 kN/m2 with a mean value of 1.7 kN/m2.
Based on Federico‟s results (1983), the shear strength at the liquid limit of soils, falls within limits of 1.7 and 2.8 kN/m2. Other studies (Russell and Mickel, 1970; Wroth and Wood, 1978; Whyte, 1982; Nagaraj et al., 2012; Vipulanandan et al., 2013; and Joshaghani et al., 2014) have indicated that shearing strength of all fined grained soils at the liquid limit falls within a limited range of about 1.7–2.0 kPa. According to Wroth and Wood (1978), a considerable part of the strength variation at the liquid limit obtained by using the Casagrande apparatus can be appointed to the fact that soil deformation is self-weight-induced. In the cone test, the soil deformation is affected by the cone weight and is essentially independent of the soil weight and hence of its water content. Wroth and Wood (1978) have attempted to redefine plastic limit in terms of strength as that water content that provides a 100-fold increase in shear strength over that at the liquid limit. Based on this principal, efforts have been made to develop an instrumented cone penetrometer to quantify the plastic limit with a mean value of 1.7 kN/m2 as the best estimate of undrained shear strength of a remolded soil at its liquid limit (Stone and Phan, 1995). Atterberg limits are very crucial method for examining the behavior of fine-grained soils, but correlations of the same with the undrained shear strength are in need to be inspected.
Objective:-
The overall objective of this study was to model the shear strength and water content relationship of ultra-soft soil. The specific objectives were as follows:
1.Perform an extensive review on the correlations of shear strength with physical properties for different reported soils.
2.Correlate the shear strength and water content for ultra-soft soil using new proposed mathematical model.
Literature review:-
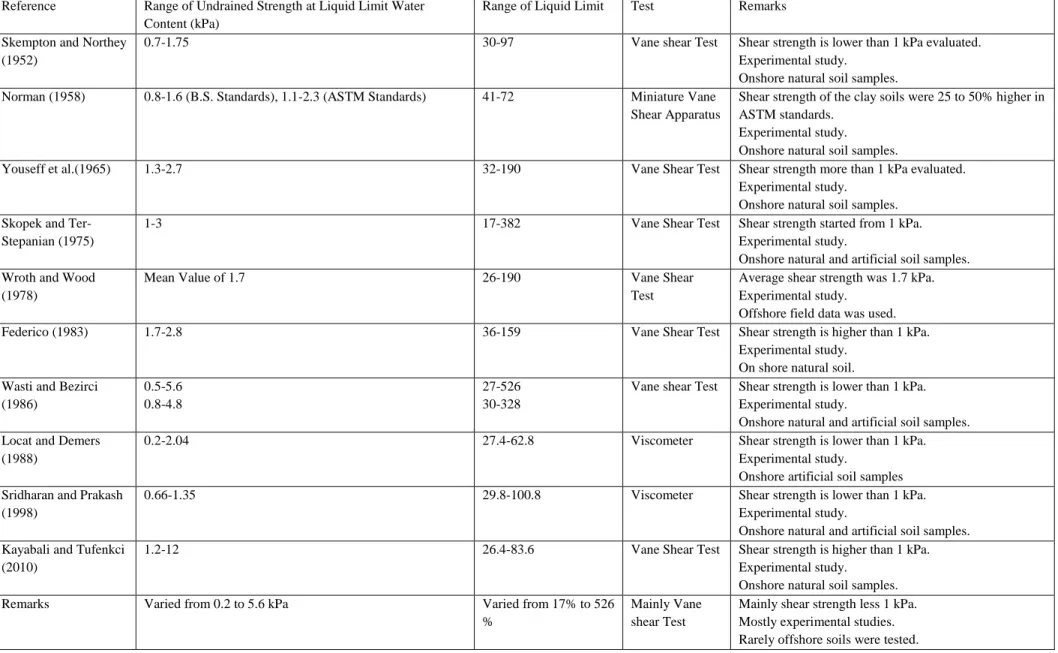
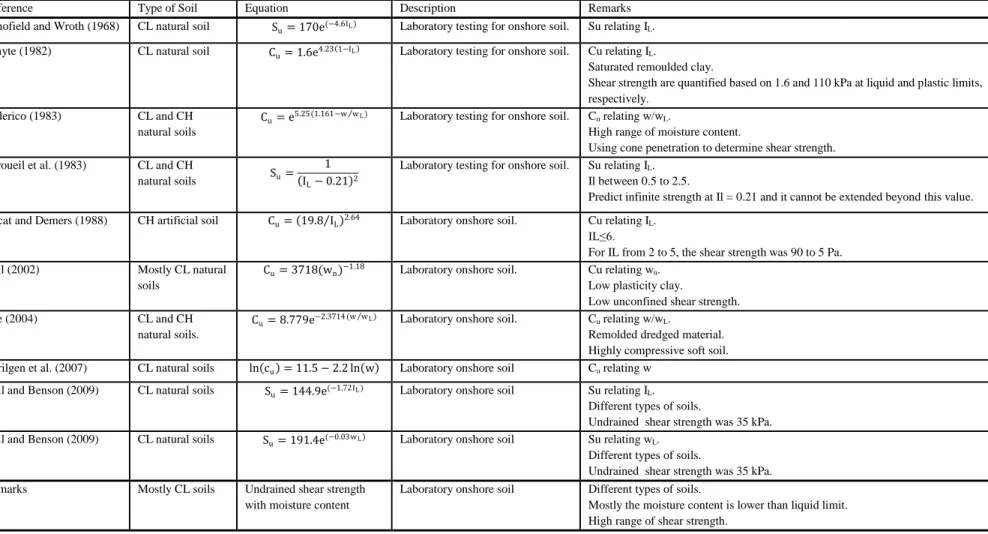
Extensive study of the variation of undrained shear strength of soft soil through previous literature has been collected as shown in Table 1 where different correlations to predict the undrained shear strength (Su) of soft soil have been reported. Most of the studies used vane shear device to measure shear strength at high moisture content. Most of tested soils were onshore soil with the 0.2 kPa as lowest measure undrained shear strength. Similarly, different proposed correlations of shear strength versus moisture content of soft soil have been collected as denoted in Table 2. The shear strength has been correlated to soil properties such as plastic limit (WP), liquid limit (WL), and moisture content. Most of tested soils were different types of onshore soils with moisture content lower than liquid limit having different ranges of shear strength. From Tables 1 and 2, it is required to study the relationship between the undrained shear strength and water content for soft soil with high water content preciously.
Material and Methods:-
Bentonite:-In this study, an ordinary (unaltered), light gray-colored commercial sodium bentonite was used to prepare the 2% and 10% bentonite (w/w) soft soil. The bentonite that used in these tests had a liquid limit of 500 and plastic limit of 100 with a density between 2.65 kN/m3to 2.75 kN/m3.
539
In the Table 1, the variation of undrained shear strength at liquid limit water content as reported in the literature have been shown.Table 1: Variation of undrained strength at liquid water content as reported in the literature
Reference Range of Undrained Strength at Liquid Limit Water Content (kPa)
Range of Liquid Limit Test Remarks
Skempton and Northey (1952)
0.7-1.75 30-97 Vane shear Test Shear strength is lower than 1 kPa evaluated.
Experimental study.
Onshore natural soil samples.
Norman (1958) 0.8-1.6 (B.S. Standards), 1.1-2.3 (ASTM Standards) 41-72 Miniature Vane
Shear Apparatus
Shear strength of the clay soils were 25 to 50% higher in ASTM standards.
Experimental study.
Onshore natural soil samples.
Youseff et al.(1965) 1.3-2.7 32-190 Vane Shear Test Shear strength more than 1 kPa evaluated.
Experimental study.
Onshore natural soil samples. Skopek and
Ter-Stepanian (1975)
1-3 17-382 Vane Shear Test Shear strength started from 1 kPa.
Experimental study.
Onshore natural and artificial soil samples. Wroth and Wood
(1978)
Mean Value of 1.7 26-190 Vane Shear
Test
Average shear strength was 1.7 kPa. Experimental study.
Offshore field data was used.
Federico (1983) 1.7-2.8 36-159 Vane Shear Test Shear strength is higher than 1 kPa.
Experimental study. On shore natural soil. Wasti and Bezirci
(1986)
0.5-5.6 0.8-4.8
27-526 30-328
Vane shear Test Shear strength is lower than 1 kPa. Experimental study.
Onshore natural and artificial soil samples. Locat and Demers
(1988)
0.2-2.04 27.4-62.8 Viscometer Shear strength is lower than 1 kPa.
Experimental study.
Onshore artificial soil samples Sridharan and Prakash
(1998)
0.66-1.35 29.8-100.8 Viscometer Shear strength is lower than 1 kPa.
Experimental study.
Onshore natural and artificial soil samples. Kayabali and Tufenkci
(2010)
1.2-12 26.4-83.6 Vane Shear Test Shear strength is higher than 1 kPa.
Experimental study.
Onshore natural soil samples.
Remarks Varied from 0.2 to 5.6 kPa Varied from 17% to 526
%
Mainly Vane shear Test
Mainly shear strength less 1 kPa. Mostly experimental studies. Rarely offshore soils were tested.
540
In the Table 2, different shear strength correlation has been summarized.Table 2:Correlation between undrained strength with physical properties of soil
Reference Type of Soil Equation Description Remarks
Schofield and Wroth (1968) CL natural soil Su= 170e(−4.6IL) Laboratory testing for onshore soil. Su relating IL.
Whyte (1982) CL natural soil Cu= 1.6e4.23 1−IL Laboratory testing for onshore soil. Cu relating IL.
Saturated remoulded clay.
Shear strength are quantified based on 1.6 and 110 kPa at liquid and plastic limits, respectively.
Federico (1983) CL and CH natural soils
Cu= e5.25(1.161−w wL) Laboratory testing for onshore soil. Cu relating w/wL.
High range of moisture content.
Using cone penetration to determine shear strength. Leroueil et al. (1983) CL and CH
natural soils Su= 1 IL− 0.21 2
Laboratory testing for onshore soil. Su relating IL.
Il between 0.5 to 2.5.
Predict infinite strength at Il = 0.21 and it cannot be extended beyond this value. Locat and Demers (1988) CH artificial soil Cu= 19.8 I L 2.64 Laboratory onshore soil. Cu relating IL.
IL≤6.
For IL from 2 to 5, the shear strength was 90 to 5 Pa. Bell (2002) Mostly CL natural
soils
Cu= 3718(wn)−1.18 Laboratory onshore soil. Cu relating wn.
Low plasticity clay.
Low unconfined shear strength.
Lee (2004) CL and CH
natural soils.
Cu= 8.779e−2.3714 (w wL) Laboratory onshore soil. Cu relating w/wL.
Remolded dredged material. Highly compressive soft soil. Berilgen et al. (2007) CL natural soils ln cu = 11.5 − 2.2 ln w Laboratory onshore soil Cu relating w
Edil and Benson (2009) CL natural soils Su= 144.9e(−1.72IL) Laboratory onshore soil Su relating IL.
Different types of soils.
Undrained shear strength was 35 kPa. Edil and Benson (2009) CL natural soils Su= 191.4e(−0.03wL) Laboratory onshore soil Su relating wL.
Different types of soils.
Undrained shear strength was 35 kPa. Remarks Mostly CL soils Undrained shear strength
with moisture content
Laboratory onshore soil Different types of soils.
Mostly the moisture content is lower than liquid limit. High range of shear strength.
541
Modified vane shear:-
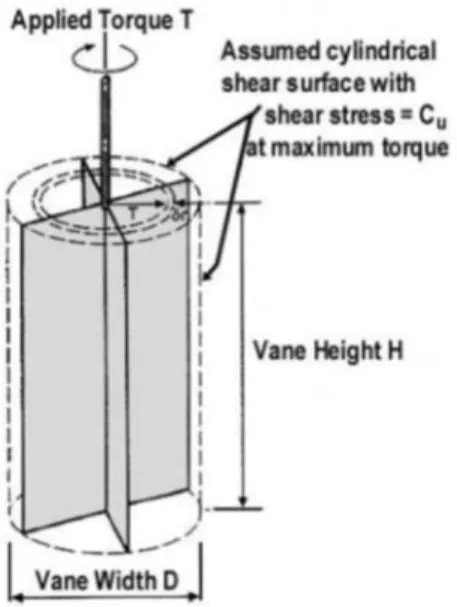
Undrained shear strength of cohesive or soft soil (Su) is obtained using vane shear test by measuring torque (Tmax) and rotation (ASTM D 2573). The vane consists of four thin rectangular blades or wings wielded to an extendable circular rod. Generally, the height of the vane is about twice of its width. The vane is pushed into the soil for at least twice its height and then rotated at a constant rate of 0.1 to 0.2 degrees per second until the soil is failed. The maximum torque required to shear soil is then converted to the undrained shear resistance of the cylindrical surface. To measure the strength of ultra-soft soil, the height and diameter of the vane shear device have been modified to 4” and 2” respectively. Schematic details for the vane shear device are idealized in Fig. 1.
Figure 1.SchematicIdealization for the Vane shear device. Comparison of model predictions:-
In order to determine the accuracy of any model predictions in the study, the coefficient of determination (R2) in curve fitting as defined in Eq. (1) was quantified using:
R2= xi i−x yi−y
xi i−x 2 yi i−y 2
2
(1)
Whereyi is the actual value; xi is the calculated value from the model;
y
is the mean of actual values; andx
is the mean of calculated values.Results and discussions:-
Different correlations to predict the undrained shear strength (Su) of soft soil have been reported in the literature. The undrained shear strength of soil varied from (0.3 to 25) kPa. The shear strength has been correlated to soil properties such as plastic limit (PL), liquid limit (LL), and water content (W/C) (ratio of weight of water to weight of solid). Based on literature review, over 100 data were collected from different sources for the analyses. New strength relationships were attempted for the very soft soil in terms of moisture content and liquid limit. Therefore, it was very important to re-evaluate some of the correlation equations in the literature and check their effectiveness for predicting the shear strength of soft soil. In addition, new correlations for shear strength in soft soil were introduced combining test results of laboratory miniature vane shear test with high moisture contents and data from the literature. Two relationships are proposed based on the water content and liquid limit of the soft soil:
Model 1: Total of 92 data collected from the literature was used to develop this strength relationship. The strength of the soil varies from (1 to 10) kPa.
Su = −6.0 ∗ ln W C % + 15, when " W C < 300% &LL < 500%" (2)
Model 2: Soft soil with varying percentage of bentonite content was used in this study. The clay content varied from (2 to 10) %. Su = 14.369 ∗ e −0.004 ∗ W C % + 1/(e W C%−LL % ), when "W/C > 300% &LL > 500% (3)
542
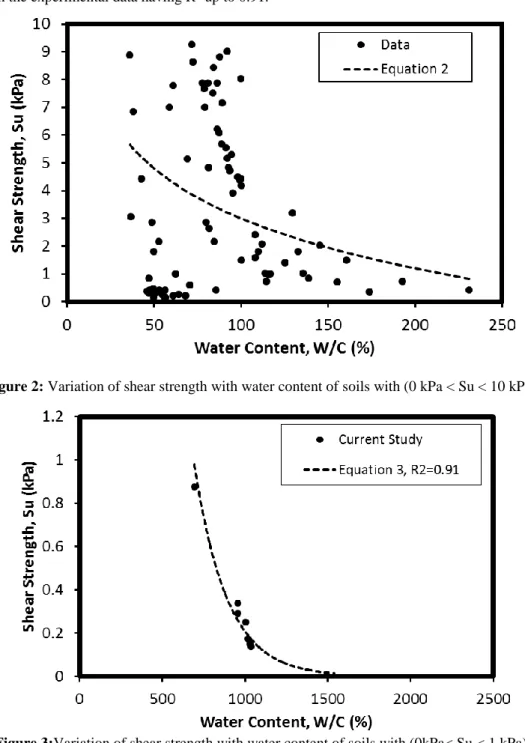
Where Su is the undrained shear strength of the ultra-soft soil, W/C is the moisture content, and LL is the liquid limit. The variation of the soft soil undrained shear strength with the water content for both 0kPa< Su < 10 kPa and 0kPa< Su < 1 kPa are shown in Figs. 2 and 3 respectively. The second proposed model (Eq. 3) was in a very good agreement with the experimental data having R2 up to 0.91.Figure 2: Variation of shear strength with water content of soils with (0 kPa < Su < 10 kPa).
Figure 3:Variation of shear strength with water content of soils with (0kPa< Su < 1 kPa).
The proposed model 2 (Eq. 3) with several other relationships from literature as summarized in Table 2 were used to predict the relationship between shear strength and water content for laboratory and reported data for ultra-soft soil with high moisture content as shown in Fig. 4. It is clearly shown that the previously reported relationships failed to predict the correlation between the shear strength and water content for ultra-soft soil while the provided relationship (Eq. 3) predicted the correlation very well supported by laboratory and previous reported data from literature and the coefficient of correlation (R2) was 0.91.
543
Figure 4:Comparison between the proposed relationship (Eq. 2) and previous methods to estimate the shearstrength-moisture content of ultra-soft soil.
Conclusions:-
Based on the results of this study, the following conclusions might be drawn:-
1. Different soil shear strength-water content relationships have been reviewed. None of the reported relationships has the capability to model shear strength-water content relationship for soft soil with high water content. 2. Two new models were proposed to model shear strength-water content relationship for ultra-soft soil with low
shear strength and high water content. Both proposed and available models were compared with experimental data. The proposed models have shown a very good agreement with experimental data compared to reported models.
Acknowledgement:-
This study was supported by the Center for Innovative Grouting Materials and Technology (CIGMAT) at the University of Houston, Texas. The help and support of professor Vipulanandanis is greatly appreciated.
References:-
1. Al-dahlaki, H., and Al-Sharify, G.A. (2008).“A Proposed Approach for Plastic Limit Determination Using the Drop-Cone Penetrometer Device,” J Eng Dev, 12(1), pp. 107–117.
2. ASTM, (2008).“Standard Test Method for Field Vane Shear Test in Saturated Fine-Grained Soils,” ASTM-D 2573, West Conshohocken, PA.
3. Bell, F.G. (2002). “The Geotechnical Properties of Some Till Deposits Occurring Along the Coastal Areas of Eastern England,” EngGeol, 63, pp. 49–68.
4. Belviso, R., Ciampoli, S., Cotecchia, V., and Federico, A. (1985).“Use of the Cone Penetrometer to Determine Consistency Limits,” Ground Eng, 18(5), pp. 21–22.
544
5. Berilgen, S.A., Kilic, H.O., and Zaydin K. (2007).“Determination of Undrained Shear Strength for Dredged Golden Horn Marine Clay with Laboratory Tests,” Proceedings of the Sri Lankan geotechnical society‟s first international conference on soil & rock engineering, August 5–11, Colombo, Sri Lanka.6. Campbell, D.J. (1976). “Plastic Limit Determination Using A Drop Cone Penetrometer,” Soil Sci, 27(3), pp. 295–300.
7. Campbell, D.J. (1983). “Discussion,” Geotechnique, 33(1), pp. 78–79.
8. Casagrande, A. (1932). “Research on the Atterberg Limits of Soils,” Public Roads 13(3), pp.121–130. 9. Casagrande, A. (1958). “Notes on the Design of the Liquid Limit Device,” Geotechnique, 8(2), pp. 84–91. 10. De Meyer, C.P., and Mahlerbe, B. (1987).“Optimisation of Maintenance Dredging Operations in Maritime
and Estuarine Areas,” Terra et Aqua, International Journal on Public Works, Ports, and Waterways Developments, Intl Assoc of Dredging Companies, (35), pp. 25-39.
11. Edil, T.B., and Benson C.H. (2009).“Comparison of Basic Laboratory Test Results with More Sophisticated Laboratory and In Situ Tests Methods on Soils in Southeastern Wisconsin,” Final report of Wisconsin highway research program #0092-06-05, pp.11–12.
12. Federico, A. (1983). “Relationships (Cu–W) and (Cu–S) for Remolded Clayey Soils at High Water Content,” Riv Ital Geotech, 17(1), pp. 38–41.
13. Feng, T.W. (2004). “Using A Small Ring and A Fall-Cone to Determine the Plastic Limit,” J GeotechGeoenviEng, 130(6), pp. 630–635.
14. Hansbo, S. (1957).“A New Approach to the Determination of the Shear Strength of Clay by Fall-Cone Test,” Proceedings of Royal Swedish Geotechnical Institute, vol 14, pp. 7–47.
15. Harison, J.A. (1988). “Using the BS Cone Penetrometer for the Determination of the Plastic Limit of Soils,” Geotechnique, 38(3), pp. 433–438.
16. Joshaghani, M. S., Raheem, A.M., and Vipulanandan, C. (2014).“Full-Scale Testing and Numerical Modeling of Axial and Lateral Soil Pipe Interaction in Deepwater,” AGU Fall Meeting, San Francisco, December, H41F-0900.
17. Kayabali, K., and Tufenkci, O.O. (2010).“Shear Strength of Remolded Soils at Consistency Limits,” Can Geotech J, 47(3), pp. 259–266.
18. Kenney, T.C. (1963). “Atterberg Limits, Correspondence,” Geotechnique, 13(2), pp. 159–162.
19. Lambe, T.W., and Whitman, R.V. (1979).“Soil Mechanics,” John Wiley and Sons, New York, pp. 31. 20. Lee, L.T. (2004). “Predicting Geotechnical Parameters for Dredged Materials Using the Slump Test Method
and Index Property Correlations,” DOER Technical Notes collection (ERDC TN- DOER-D-1), U.S. Army Engineer Research and Development Center, Vicksburg, Mississippi.
21. Lee, L.T., and Freeman, R.B. (2009).“Dual-Weight Fall Cone Method for Simultaneous Liquid Limit Determination,” J GeotechGeoenviEng, 135(1), pp. 158–161.
22. Leroueil, S., Tavenas, F., and Le Bihan, J.P. (1983).“Characteristic Properties of Eastern Canada Clays,” Can Geotech J, 20(4), pp. 681–705.
23. Locat, J., and Demers, D. (1988).“Viscosity, Yield Stress, Remolded Strength, and Liquidity Index Relationships for Sensitive Clays,” Can Geotech J, 25(4), pp. 799–806.
24. Nagaraj, H.B., Sridharan, A., and Mallikarjuna, H.M. (2012).”Re-Examination of Undrained Strength at Atterberg Limits Water Contents,” Geotechnical and Geological Engineering,30, No. 2, pp.727-736.
25. Norman, L.E.J. (1958). ”A Comparison of Values of Liquid Limit Determined with Apparatus Having Bases of Different Hardness,” Geotechnique, 8, No. 2, pp. 79-83.
26. Rao, H.Y. (1987). “Determination of Atterberg Limits by Cone Penetrometer,” In: Proceedings of 8th Asian regional conference on soil mechanics and foundation engineering, vol 1, Kyoto, pp. 81–84.
27. Rashid, A.S.A., Kassim, K.A., Katimon, A., and Noor, N.M. (2008). “Determination of Plastic Limit of Soil Using Modified Methods,” Malays J CivEng, 20(2), pp. 295–305.
28. Russel, E. R., and Mickle, J. L. (1970).„„Liquid Limit Values by Soil Moisture Tension,‟‟ J. Soil Mech. Found. Div., Am. Soc. Civ. Eng., 96(3), pp. 967–989.
29. Sampson, L.R., and Netterberg, F. (1985).“The Cone Penetration Index: A Simple New Soil Index Test to Replace the Plasticity Index,” In: Proceedings of 11th international conference on soil mechanics and foundation engineering, vo1 2. San Fransisco, pp. 1041–1048.
30. Schofield, A.N., and Wroth, C.P. (1968).“Critical State Soil Mechanics,” McGraw Hill, London, pp. 310. 31. Sharma, B., and Bora, K.P. (2003).“Plastic Limit, Liquid Limit and Undrained Shear Strength of
545
32. Sivakumar, V., Glynn, D., Cairns, P., and Black, J.A. (2009).“A New Method of Measuring Plastic Limit ofFine Materials,” Geotechnique, 59(10), pp. 813–823.
33. Skempton, A. W., and Northey, R. D. (1952).„„The Sensitivity of Clays,‟‟ Geotechnique, 3, pp. 30–53. 34. Skopek, J., and Ter-stepanian, G. (1975).“Comparison of Liquid Limit Value Determined According to
Casagrande and Vasilev,” Geotechnique, 25(1), pp. 135–136.
35. Sridharan, A., and Prakash, K. (1999). “Mechanisms Controlling the Undrained Shear Strength Behaviour of Clays,” Can Geotech J, 36(6), pp. 1030–1038.
36. Sridharan, A., and Venkatappa Rao, G. (1979).“Shear Strength Behaviour of Saturated Clays and the Role of Effective Stress Concept,” Geotechnique, 29(2), pp. 177–193.
37. Sridharan, A., Nagaraj, H.B., and Prakash, K. (1999).“Determination of the Plasticity Index from Flow Index,” Geotech Test J, 22(2), pp. 175–181.
38. Sridharan, A., Rao, S.M., and Murthy, N.S. (1986).“Liquid Limit of Montmorillonite Soils,” Geotech Test J, 9(3), pp. 156–159.
39. Sridharan, A., Rao, S.M., and Murthy, N.S. (1988).“Liquid Limit of Kaolinitic Soils,” Geotechnique, 38(2), pp. 191–198.
40. Stone, K.J.L., and Phan, K.D. (1995). “Cone Penetration Tests Near the Plastic Limit,” Geotechnique, 45(1), pp. 155–158.
41. Towner, G.D. (1973).“An Examination of the Fall Cone Method for the Determination of Some Strength Properties of Remoulded Agricultural Soils,” J Soil Sci, 24(4), pp. 470–479.
42. Vipulanandan C., Yanhouide J. A., and Joshaghani S. M. ( 2013). “Deepwater Axial and Lateral Sliding Pipe-Soil Interaction Model Study,” Proceedings, ASCE pipelines.
43. Wasti, Y., and Bezirci, M.H. (1986).”Determination of the Consistency Limits of Soils by the Fall Cone Test,” Can Geotech J, 23(2), pp. 241–246.
44. Whyte, I.L. (1982). “Soil Plasticity and Strength: A New Approach Using Extrusion,” Ground Eng, 15(1), pp. 16–24.
45. Wood, D.M., and Wroth, C.P. (1978).“The Use of the Cone Penetrometer to Determine the Plastic Limit of Soils,” Ground Eng, 11(3), pp. 37.
46. Wroth, C.P., and Wood, D.M. (1978).“The Correlation of Index Properties with Some Basic Engineering Properties of Soils,” Can Geotech J, 15(2), pp. 137–145.
47. Youseff, M.S., El Ramli, A.H., and El Demery, M. (1965).“Relationships between Shear Strength, Consolidation, Liquid Limit, and Plastic Limit for Remoulded Clays,” Proceedings 6th international conference on soil mechanics and foundation engineering, vol 1, Montreal, pp. 126–129.