ASSESSMENT WITH A COMPACT FLOW CYTOMETER OF LIVE,
INJURED AND DEAD PROBIOTIC LACTOBACILLI AND
BIFIDOBACTERIA AFTER SUBJECTING TO OSMOTIC, FREEZE AND
HEAT STRESS
Thien Trung Le1,4, Tony Ruyssen2, Mieke Uyttendaele1, Paul Van Assche3
and Koen Dewettinck1
1Ghent University, Department of Food Safety and Food Quality, Belgium 2University College Ghent, Department Food Science and Technology, Belgium 3Institute for Agricultural and Fisheries Research, Technology and Food Unit, Belgium 4Ho Chi Minh City Nong Lam University, Faculty of Food Science and Technology, Vietnam
Abstract
A single light-source flow cytometer with the aid of two fluorescent probes SYTO 81 and PI was used to examine the viability of three commercial probiotic strains Lactobacillus acidophilus, Lactobacillus paracasei ssp. tolerans and Bifidobacterium animalis ssp. lactis after they were subjected to elevated temperatures, high salt concentrations and freezing. The flow cytometry was validated to be a rapid viability assay by comparing its results with those of the conventional plate counting method.
Key words: flow cytometry, SYTO 81 – PI, viability, probiotics,
INTRODUCTION
A quick evaluation of the viability of bacteria is of great importance not only for scientific research but also in many industrial applications such as food & drinks, cosmetics, biotechnology, water industry, and pharmaceutics. In this research, cell suspensions of three commercial probiotic strains Lactobacillus acidophilus (L10), Lactobacillus paracasei ssp. tolerans (LBC82) and Bifidobacterium animalis ssp. lactis (B420) were subjected to stress conditions namely elevated temperatures, high salt concentrations and freezing. The capacity of a compact, single light-source flow cytometer was used to examine the viability of the stressed cells, based on membrane integrity with the aid of a combination of two fluorescent stains, namely cell membrane impermeant propidium iodine (PI) and cell-permeant SYTO 81. The staining mechanism of the combination of these two dyes is explained elsewhere (Haugland, 2006). Results of flow cytometry (FCM) counting were compared with those of plate counting to validate the use of flow cytometers coupled with the two fluorescent probes as a rapid viability assay that provides a generally valid indicator for reproduction.
MATERIAL AND METHODS
Bacterial strains and culture conditions
L10 (Food Specialties, Australia), LBC82 (Rhodia Food, Dangé St. Romain, France) and B420 (Danisco Cultor/Wisby, Niebüll, Germany) were stored as frozen stocks at -80°C on cryobeads. Media for the activation and plate counting of the first two strains were MRS broth and MRS agar. For B420, the media supplemented with 0.05%w/v L-cystein hydrochloride monohydrate were used. The incubation was always carried under anaerobic condition at 37oC. Prior to the assays, the strains were activated and serially transferred at least twice. One percent of each culture was then inoculated in the fresh medium and incubated for
Experimental treatments
Suspensions of 1% inoculum (106-107 cells/ml) of activated cultures were made in autoclaved MRD (maximum recovery diluent), MRD supplemented with NaCl at different concentrations and MRD supplemented with the cryoprotectants (see section results and dicussion) for the experiments of the exposure to heat, osmotic shock and freezing, respectively. Untreated samples were also measured and served as control samples. Each experiment was carried out in at least three replicates with each performed on a different day from a new inoculum.
FCM measurement
Bacterial samples were stained with 5 μM for SYTO 81 (Molecular Probes) and 0.01 mg/ml (or 14.97 μM) for PI (P4170, Sigma) in the dark at 37oC for 15 minutes. The FCM analyses were performed with a compact flow cytometer, "BACTIFLOW GL100" (Partec-Chemunex), equipped with a 100 mW green Nd:YAG solid state laser, operating at 532 nm. FSC (forward scatter), SSC (side scatter), orange FL1 (fluorescence 1) and red FL2 of each single cell were recorded. FSC was selected as the trigger parameter. Orange fluorescence emitted from SYTO 81 stained cells was collected with FL1 bandpass filter 560-590 nm, whereas red fluorescence emitted from PI stained cells was collected with FL2 bandpass filter 620-630 nm. The detection gain and thresholds were set to have maximum collection of signals from the bacteria.
Dilution of bacterial suspensions for FCM measuring was done in phosphate-buffered saline which had been filtered through 0.2μm Supor Acrodisc syringe filter (Pall Gelman). All measurements were carried out in duplicate at dilution factor of -2 after the experimental treatments. Speed of the flow was adjusted to obtain flow rate of 150-500 cells/second. Blank samples (for fluorescence background counting) with the same constituents but without bacteria were also counted on the flow cytometer. Counts of bacterial samples were subtracted to those of blank ones before doing further calculation.
Data analysis
Data acquisition and analysis were performed with the Partec Flomax software. Two parameter dot plots SSC and FL1-FL2 were primarily used to resolve the data. First, bacterium gate on FSC-SSC plots was defined and applied to discriminate bacteria from noise (background). Second, compensate crosstalk was applied on FL1-FL2 plots to disperse the overlap between the two fluorescent parameters. Finally, counts of the separated subpopulations on FL1-FL2 plots (Figure 1) were obtained by setting quadrants (sometimes polygon gates) on these plots.
RESULTS AND DISCUSSION Effect of temperatures
In untreated samples, almost all cells were only stained with SYTO 81 and gated in Q4 (live cell) (fig. 1). Under a certain intensity of the treatment depending on the strains, part of the population was not only stained with SYTO 81 but also with PI and was acquired in gate Q2 (sublethal or injured cell). The membranes of all cells were ruptured at above 67.5oC for L10, above 65oC for LBC82 and above 80oC for B420, hence the cells were solely stained by PI throughout the population and were therefore gated in Q1 (dead cell) (Fig.1 & 2a).
The number of LBC82 injured cells (Q2) was highest at around 62.5oC (Fig. 2a) and they were probably not resurrected on MRS agar plates since the line of only Q4 fraction was already located above that of the plate counts (Fig. 2b). Use of SYTO 81-PI combination to assess the viability of B420 (can be genera, species of this strain) under thermal stress is not suitable (Fig. 2b). Total (Q1+Q2+Q4) detected cell numbers of L10 and B420 decreased when treatment temperatures exceeded certain values. The decrease in total cells of L10 could be due to the disintegration (lyse) of cells or intense loss of the components caused by their leakage through the damaged membrane.
not being stained with PI or SYTO 81 since the number of bacterial cells recorded on bacteria FSC-SSC gates did not decrease (figure not shown).
0.1 1 10 100 1000 0.1 1 10 100 1000 FL1 FL 2 Gate: R1 0.1 1 10 100 1000 0.1 1 10 100 1000 FL1 FL 2 Q1: 0.53% 565 / ml Q2: 0.56% 600 / ml Q3: 5.50% 5875 / ml Q4: 93.41% 99740 / ml 0.1 1 10 100 1000 0.1 1 10 100 1000 FL1 FL 2 Gate: R1 0.1 1 10 100 1000 0.1 1 10 100 1000 FL1 FL 2 Q1: 1.26% 920 / ml Q2: 1.70% 1245 / ml Q3: 8.94% 6550 / ml Q4: 88.10% 64525 / ml SSC 0.1 1 10 100 1000 0.1 1 10 100 1000 FL1 FL 2 SSC Gate: R1 0.1 1 10 100 1000 0.1 1 10 100 1000 FL1 FL 2 Q1: 7.04% 4840 / ml Q2: 11.17% 7680 / ml Q3: 9.20% 6320 / ml Q4: 72.59% 49885 / ml Ctrl 60 oC 62.5 oC SSC 0.1 1 10 100 1000 0.1 1 10 100 1000 FL1 FL 2 SSC Gate: R1 0.1 1 10 100 1000 0.1 1 10 100 1000 FL1 FL 2 Q1: 86.60% 47030 / ml Q2: 1.81% 985 / ml Q3: 11.11% 6035 / ml Q4: 0.47% 255 / ml 0.1 1 10 100 1000 0.1 1 10 100 1000 FL1 FL 2 Gate: R1 0.1 1 10 100 1000 0.1 1 10 100 1000 FL1 FL 2 Q1: 87.52% 42875 / ml Q2: 0.20% 100 / ml Q3: 12.21% 5980 / ml Q4: 0.07% 35 / ml 0.1 1 10 100 1000 0.1 1 10 100 1000 FL1 FL 2 Gate: R1 0.1 1 10 100 1000 0.1 1 10 100 1000 FL1 FL 2 Q1: 1.09% 60 / ml Q2: 1.09% 60 / ml Q3: 96.64% 5325 / ml Q4: 1.18% 65 / ml 65 oC 67.5 oC Blank sample
Figure 1. Fluorescence properties of Lactobacillus acidophilus (L10) under the treatment with different temperatures for 5 mins. Cells were stained with SYTO81 and PI. Q1-cells stained with PI (dead cell), Q2–cells stained with both SYTO81 and PI (sublethal cell), Q3-background and Q4-cell stained with SYTO81 (live cell).
LBC82
PI stained (Q1) SYTO81 and PI stained (Q2)
SYTO81 stained (Q4) plate counts
total cells detected (Q1+Q2+Q4)
(a) (b) Percentage of cells L10 0 20 40 60 80 100 Ctrl 60 62.5 65 67.5 L10 0 20 40 60 80 100 Ctrl 60 62.5 65 67.5 LBC82 0 20 40 60 80 100 Ctrl 57.5 60 62.5 65 LBC82 0 20 40 60 80 100 Ctrl 57.5 60 62.5 65
B420 0 20 40 60 80 100 Ct rl 57 .5 60 62 .5 65 70 75 80 B420 0 20 40 60 80 100 Ct rl 57 .5 60 62 .5 65 70 75 80 Temperature (oC)
Figure 2. Comparison of FCM using SYTO81-PI staining with plate counts under thermal treatments on Lactobacillus acidophilus (L10), Lactobacillus paracasei ssp.
paracasei (LBC82) and Bifidobacterium animalis ssp. lactis (B420). Graphs show
the relative changes of PI ( ), SYTO81 & PI ( ), SYTO81 ( ) stained
fractions, total cells detected ( ) on FL1-FL2 dot plots and plate counts ( L)
Effect of osmotic shock
Total recorded cells of L10 decreased from 100% to 87.62 ± 16.54 % and 73.06 ± 2.59 % with 15% and 25% salt treatments respectively at 37oC (Figure 3a). These high salt concentrations caused cells to shrink and some were not included in the bacterial clusters which were gated on the FSC-SSC plot. Increase of total detected cells of LBC82 and B420 after the treatment could be due to the disintegration of cell aggregates (Figure 3a). In relation to cell aggregation, plate counts and FCM lead to an underestimation of bacterial numbers.
Plate counts of L10 coincided more with SYTO 81 stained fraction rather than total SYTO 81 stained fraction (Q2+Q4). While for LBC82 and B420, plate counts was in better correlation with Q2+Q4 rather than Q4 only (Figure 3b). Therefore, the former rather than the latter could be an indicator for culturability of these strains under the treatment. This may point out that (part of) injured cells LBC82 and B420 gated in Q2 could multiply in the plates. Application of sorting technique will determine the percentage of cell recovery on plates of the subpopulation.
(a) (b)
PI stained SYTO81 and PI stained SYTO81 stained plate counts total SYTO81 stained
Percentage of cells L10 0 20 40 60 80 100 Ctrl 25%-4C 15% 25% L10 0 10 20 30 40 50 60 70 80 90 100 Ctrl 25%-4C 15% 25% LBC82 0 20 40 60 80 100 120 Ctrl 25%-4C 15% 25% LBC82 0 20 40 60 80 100 120 Ctrl 25%-4C 15% 25% B420 0 20 40 60 80 100 120 Ctrl 25%-4C 15% 25% B420 0 20 40 60 80 100 120 Ctrl 25%-4C 15% 25% NaCl concentration (%w/v)
Figure 3. Comparison of FCM using SYTO81-PI staining with plate counts under high osmotic pressure treatmenton Lactobacillus acidophilus (L10), Lactobacillus paracasei ssp. paracasei (LBC82) and Bifidobacterium animalis ssp. lactis (B420). The treatment was performed for 2h
at 37oC, except 25%-4C at 4oC. Graphs show the relative changes of PI ( ), SYTO81 & PI
( ), SYTO81 ( ), total SYTO81 ( ) (Q4+Q2) stained fractions, and plate counts ( )
Effect of freezing
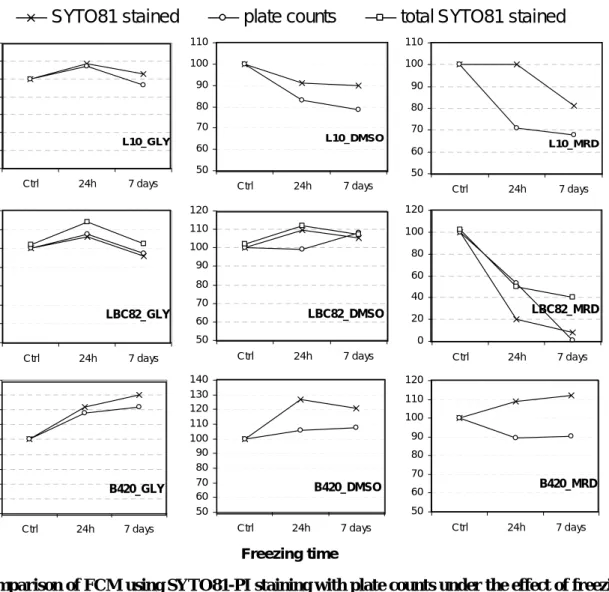
DMSO was less efficient than glycerin in the cryoprotective effect for L10 (Figure 4). When L10 is frozen in 10% dimethylsulfoxide and L10 and B420 in MRD without any cryoprotectants, the loss of culturability was seen primarily in the first 24h and the speed of loss decreased after that.
Without the cryoprotectants, response to freezing of the three strains was not the same (fig. 4). For L10, the percentage of SYTO 81 stained cells was significantly higher than that of plate counts (p<=0.05) after 24h of freezing. The difference is insignificant after 7 days of freezing. For LBC82, the total SYTO 81 stained fraction (Q2+Q4) could be used to estimate plate counts after 24h of freezing. After 7 days- freezing, only Q4 can be used for the estimation. This proves that injured cells of this strain after 24h freezing could form colonies on plates but those after 7 days could not. It could be concluded that if the freezing time is long enough (e.g. 1 week in this experiment) SYTO 81 stained fraction from FCM measurement can be used to estimate plate counts of L10 and LBC82. B420 seemed to be the most resistant to freezing-induced injury. Percentages of cells stained with SYTO 81 did not decrease (fig. 4). The difference between SYTO 81 fraction and plate counts was here statistically insignificant due to few replicates. The freezing of this strain should be
experimented in longer time to know whether SYTO81 stained fraction goes in agreement with the plate counts.
SYTO81 stained plate counts total SYTO81 stained
Percen tage of cells L10_GLY 50 60 70 80 90 100 110 120 Ctrl 24h 7 days L10_DMSO 50 60 70 80 90 100 110 Ctrl 24h 7 days L10_MRD 50 60 70 80 90 100 110 Ctrl 24h 7 days LBC82_GLY 50 60 70 80 90 100 110 120 Ctrl 24h 7 days LBC82_DMSO 50 60 70 80 90 100 110 120 Ctrl 24h 7 days LBC82_MRD 0 20 40 60 80 100 120 Ctrl 24h 7 days B420_GLY 50 60 70 80 90 100 110 120 130 140 Ctrl 24h 7 days B420_DMSO 50 60 70 80 90 100 110 120 130 140 Ctrl 24h 7 days B420_MRD 50 60 70 80 90 100 110 120 Ctrl 24h 7 days Freezing time
Figure 4. Comparison of FCM using SYTO81-PI staining with plate counts under the effect of freezing on Lactobacillus acidophilus (L10), Lactobacillus paracasei ssp. paracasei (LBC82) and
Bifidobacterium animalis ssp. lactis (B420). Graphs show the relative changes of SYTO81
( ), total SYTO81 ( ) (Q4+Q2) stained fractions and plate counts ( L). Freezing was
done in MRD with 30% glycerin (GLY), 10% dimethylsulfoxide (DMSO) and without the cryoprotectors (MRD)
CONCLUSION
Advantages of using FCM are the accuracy and speed of analysis. Single cell analysis using FCM gives the information on the heterogeneity of the bacterial populations, which can not be obtained with plate counts. Using a combination of SYTO 81 and PI, three subpopulations namely live, sublethal (injured) and dead cells could be distinguished. From the obtained graphs, FCM lines are generally located above plate counting lines. In the conditions provided for the plate counting method, probably some live cells did not multiply (Joux and Lebaron, 2000).
Under heat treatment, B420 cells gated in quadrant Q4 can not be called viable. In some cases, there were rather high percentages of sublethal cells (e.g. for LBC82). Determining this subpopulation either or not grows on the plates is important to have accurate results in comparison with the culture
In summary, a combination of these two dyes provides a rapid and reliable method for discriminating and counting live, injured and dead (and total) bacteria. The ability to obtain results fast supports FCM to be applied for real-time monitoring of cell viability that is needed in versatile applications such as in the production of starter cultures and in other process practices.
REFERENCES
Haugland, P. 2006. The Handbook: a Guide to Fluorescent Probes and Labeling Technologies, 10th ed. Molecular Probes, Inc., Eugene, Oreg. www.probes.com.
Joux, F., P. Lebaron, 2000. Use of fluorescent probes to assess physiological functions of bacteria at single-cell level. Microbes and Infection 2, 1523-1535.
Mason, C.A., G. Hamer, and J.D. Brycrs, 1986. The death and lysis of microorganisms in environmental processes. FEMS Microbiology Reviews 39, 373-401.