R E S E A R C H A R T I C L E
Open Access
Comparative performance and external
validation of the multivariable PREDICT
Prostate
tool for non-metastatic prostate
cancer: a study in 69,206 men from
Prostate Cancer data Base Sweden
(PCBaSe)
David Thurtle
1*, Ola Bratt
2, Pär Stattin
3, Paul Pharoah
4†and Vincent Gnanapragasam
5†Abstract
Background:PREDICTProstateis an endorsed prognostic model that provides individualised long-term prostate cancer-specific and overall survival estimates. The model, derived from UK data, estimates potential treatment benefit on overall survival. In this study, we externally validated the model in a large independent dataset and compared performance to existing models and within treatment groups.
Methods:Men with non-metastatic prostate cancer and prostate-specific antigen (PSA) < 100 ng/ml diagnosed between 2000 and 2010 in the nationwide population-based Prostate Cancer data Base Sweden (PCBaSe) were included. Data on age, PSA, clinical stage, grade group, biopsy involvement, primary treatment and comorbidity were retrieved. Sixty-nine thousand two hundred six men were included with 13.9 years of median follow-up. Fifteen-year survival estimates were calculated using PREDICTProstatefor prostate cancer-specific mortality (PCSM) and all-cause mortality (ACM). Discrimination was assessed using Harrell’s concordance (c)-index in R. Calibration was evaluated using cumulative available follow-up in Stata (TX, USA).
Results:Overall discrimination of PREDICTProstatewas good with c-indices of 0.85 (95% CI 0.85–0.86) for PCSM and 0.79 (95% CI 0.79–0.80) for ACM. Overall calibration of the model was excellent with 25,925 deaths predicted and 25,849 deaths observed. Within the conservative management and radical treatment groups, c-indices for 15-year PCSM were 0.81 and 0.78, respectively. Calibration also remained good within treatment groups. The discrimination of PREDICT Prostate significantly outperformed the EAU, NCCN and CAPRA scores for both PCSM and ACM within this cohort overall.
A key limitation is the use of retrospective cohort data. (Continued on next page)
© The Author(s). 2020Open AccessThis article is licensed under a Creative Commons Attribution 4.0 International License, which permits use, sharing, adaptation, distribution and reproduction in any medium or format, as long as you give appropriate credit to the original author(s) and the source, provide a link to the Creative Commons licence, and indicate if changes were made. The images or other third party material in this article are included in the article's Creative Commons licence, unless indicated otherwise in a credit line to the material. If material is not included in the article's Creative Commons licence and your intended use is not permitted by statutory regulation or exceeds the permitted use, you will need to obtain permission directly from the copyright holder. To view a copy of this licence, visithttp://creativecommons.org/licenses/by/4.0/. The Creative Commons Public Domain Dedication waiver (http://creativecommons.org/publicdomain/zero/1.0/) applies to the data made available in this article, unless otherwise stated in a credit line to the data.
* Correspondence:[email protected]
†Paul Pharoah and Vincent Gnanapragasam contributed equally to this work.
1Academic Urology Group, University of Cambridge, Norman Bleehan Offices, Addenbrookes Hospital, Hills Road, Cambridge CB2 0QQ, UK
(Continued from previous page)
Conclusions:This large external validation demonstrates that PREDICTProstateis a robust and generalisable model to aid clinical decision-making.
Keywords:Prostate cancer, Prognosis, Prostate cancer-specific mortality, PCSM, Survival, Overall mortality, Competing risks, Decision aid
Background
Prostate cancer represents a growing burden on health care globally, with increasing numbers and proportions of men presenting with non-metastatic prostate cancer (PCa) [1]. Alongside this, there has been increased confidence in the use of conservative management (active surveillance and watchful waiting) [2]. Understanding disease progno-sis to guide treatment decision-making is therefore of great importance. However, until recently, no high-quality individualised model for survival existed.
Using data from over 10,000 UK men, we have previ-ously published an individualised prognostic model for cancer-specific and overall survival called ‘PREDICT Prostate’ [3]. PREDICT Prostate (available online [4]) provides cancer-specific and overall percentage survival estimates for up to 15 years and has been endorsed by the National Institute for Health and Care Excellence (NICE) [5]. To maximise usability, it uses routinely avail-able clinico-pathological data (age, PSA, grade, stage, bi-opsy involvement, treatment type and comorbidity). It represents real-world data from a non-screened, primary diagnostic cohort, including a significant number of men treated conservatively. Crucially, the model also allows adjustment for competing mortalities by incorporating both cancer-specific and non-cancer survival outcomes to contextualise the diagnosis as part of a decision aid. Internal validation and accuracy within a small external population were promising during model development [3]. However, external validation in independent cohorts, ideally in a different location, is vital to demonstrate generalisability and accuracy of a multivariable prognos-tic model [6].
The Prostate Cancer data Base Sweden (PCBaSe) is one of the largest and most comprehensive prostate can-cer cohorts world-wide and is well suited for external validation of PREDICT Prostate [7]. The aim of this study was to validate PREDICT Prostate and compare performance to existing models.
Methods Source of data
Data from PCBaSE 3.0 were used, according to a pre-specified project outline (Additional file 2) [8–10]. PCBaSe was created by the combination of the National Prostate Cancer Register of Sweden with other national healthcare and demographic databases [11]. The capture
rate of this register is 98% of all incident prostate cancer cases compared to the Swedish Cancer Registry—to which registration is mandated by law [12]. The cause of death information is updated from the Cause of Death Registry which captures all deaths in Sweden. The agreement be-tween the recorded cause of death and reviewed medical records has been reported at 86% (95% CI 85–87%) [13].
Participants and predictors
We included men within PCBaSe diagnosed with PCa between 1 January 2000 and 31 December 2010, with no evidence of metastatic disease and prostate-specific anti-gen (PSA) < 100 ng/ml. Cases were censored at death, migration or 31 December 2016, whichever event occurred first. Data were available for 82,936 men. Out-come events were ‘PCa death’or ‘any-cause death’from which‘non-PCa death’was derived. Intact data were re-quired for variables mandatory within the model: age, PSA, T stage, histological grade group, primary treat-ment type and comorbidity. This led to the exclusion of 13,730 (16.6%) cases, leaving a final analysable dataset of 69,206 (Table 1). Missing data were most abundant for the histological grade group (n= 8117), as primary and secondary Gleason grades were not always registered. Data were also missing on PSA (n= 2124), T stage (n= 1364), age (n= 4) and primary treatment (n= 3960). Some men had missing data for more than one variable. All variables were determined at the time of diagnosis. Biopsy characteristics are an optional variable in the PREDICT Prostate model; therefore, missing data on proportion of positive cores ([PPC] = number of cores with any cancer/number of cores taken) were tolerated. We also re-tested the value of PPC to predict PCa death in a sub-group with intact biopsy information (n= 44, 163) using the same method as previously [3]. Primary treatment was defined as the radical treatment received up to 12 months after the date of diagnosis, or conserva-tive management. The same definition of comorbidity was used as in the model development: the combination of both Charlson Comorbidity Index of 1 or greater (ex-cluding PCa) and a hospital admission in the 2 years pre-ceding PCa diagnosis [3]. Up to 2008, the treatment strategies of active surveillance and watchful waiting were reported as conservative management. After 2008, these strategies were registered as separate entities. We used conservative management as a treatment strategy
also for men diagnosed after 2008, although a small, well-defined active surveillance group was separately analysed.
Outcome
The model estimates prostate cancer-specific mortality (PCSM), non-PCa mortality (NPCM) and overall or all-cause mortality (ACM), counted from the time of
diagnosis. It provides estimates following conservative management and radical treatment (by either radical prostatectomy or radiotherapy).
Statistical analysis methods
Beta coefficients for each prognostic factor in the model were applied to derive prognostic indices for PCSM and NPCM for each patient. These were used in Table 1Baseline cohort characteristics in the original UK model development cohort and Prostate Cancer data Base Sweden (PCBaSe) cohort
UK model development cohort Sweden PCBase cohort
Total subjects 7063 69,206
Time at risk (years) 58,138 589,733
Range Range
Median follow-up (years) 9.8 0–16 13.9 0–17
Age(mean, SD) 69.9 8.34 68.8 8.83 PSA(mean, SD) 18.5 17.5 15.7 17.0 Grade groups % % 1 2317 32.8 36,992 53.5 2 2125 30.1 14,015 20.3 3 1057 15.0 7774 11.2 4 710 10.1 6345 9.2 5 854 12.1 4080 5.9 T stage 1 3761 53.2 35,700 51.6 2 2270 32.1 22,478 32.5 3 977 13.8 10,295 14.9 4 55 0.8 733 1.1 Primary treatment Radical prostatectomy 995 14.1 20,936 30.3 Radical radiotherapy 2457 34.8 11,906 17.2
Androgen deprivation monotherapy 2226 31.5 15,980 23.1
Conservative management 1385 19.6 20,384 29.5
Comorbidity
No recorded comorbidity 6363 90.1 62,173 89.8
Comorbidity (Charlson Score≥1) 700 9.9 7033 10.2
10-year outcomes PCa death 712 6993 Non-PCa death 1555 15,122 Any-cause death 2267 22,115 Overall outcomes PCa death 846 8151 Non-PCa death 1829 18,003 Any-cause death 2675 26,154
Crude PCS mortality rate (per patient year) 1.46 1.38
Annual overall mortality rate (per patient year) 4.60 4.43
combination with the model’s baseline hazard functions and time at risk to create individual estimates of un-adjusted PCSM and NPCM over 15 years. These esti-mates were adjusted for the competing risks between the two causes of death to generate ACM estimates. To as-sess discrimination, 15-year estimates were generated. Harrell’s concordance index (c-index) was then applied using the ‘Hmisc’ package in R [14]. Discrimination using PREDICTProstatewas compared to the EAU and NCCN stratification systems and the UCSF CAPRA score [15–17]. Sub-classification of stage T2 was not available; therefore, T2 was assumed to be T2a for the sake of these classifications. When PPC was unknown, it was assumed to be < 34% in the CAPRA model. Ad-justed predictions of cumulative PCSM, NPCM and ACM were generated using the available follow-up for the assessment of model calibration. Calibration was assessed using a chi-square goodness of fit (GOF) across quintiles of risk using the method of May and Hosmer [18]. Calibration was also assessed within treatment sub-groups. All data analyses were performed in Stata™ 14, unless otherwise stated above.
Results Participants
Sixty-nine thousand two hundred six men were in-cluded with 13.9 years of median follow-up. The Swedish population attributes at baseline are com-pared to the UK model development cohort in Table 1. Patient characteristics were similar in both cohorts, with a larger proportion of grade group 1 disease in the Swedish cohort. A larger proportion of men underwent surgery as opposed to radiotherapy in the Swedish cohort, and smaller proportion were treated with primary androgen deprivation therapy in this time period. Breakdown of the patients by risk groups is reported in Additional file 1: Table S1.
Model performance
Overall discrimination of PREDICT Prostate was very good with c-indices 0.85 (95% CI 0.85–0.86) for PCSM and 0.79 (95% CI 0.79–0.79) for ACM (Table2). Overall calibration of the model was excellent with 25,925 deaths predicted and 25,849 deaths observed in PCBaSe. This equates to an overall observed to expected (O:E) ra-tio of 1:1.003. Calibrara-tion across quintiles of risk is shown in Fig.1and Additional file1: Table S2. Although the O:E ratio for any-cause death was very close to 1, ex-pected numbers of PCa deaths were slightly higher than observed (O:E 0.897) and expected numbers of non-PCa deaths were lower than observed (O:E 1.060), particu-larly in the highest risk quintiles.
Treatment sub-groups
Overall, 20,384 men underwent conservative manage-ment and 32,842 received radical treatmanage-ment. Within these groups, c-indices remained good, with c-index for 15-year PCSM 0.81 (95% CI 0.80–0.82) for conservative management and 0.78 (95% CI 0.77–0.80) for radical treatment (Table2).
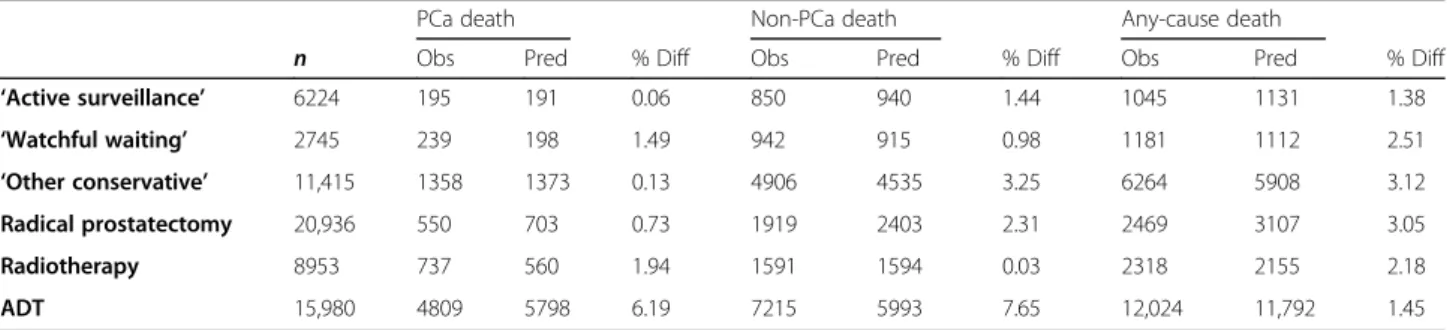
Among men on well-defined active surveillance, c-indices were further improved at 0.88 for PCSM and 0.75 for ACM (Additional file 1: Table S3). Calibration also remained good within treatment groups with differ-ences between observed and predicted numbers of over-all deaths 1.4%, 2.2% and 3.1% among men who received active surveillance, radiotherapy and prostatectomy, re-spectively (Table 3). The model overestimated PCSM and underestimated NPCM within the sub-group which received androgen deprivation monotherapy by as much as 8%—but remained within 2% for overall death (Table3).
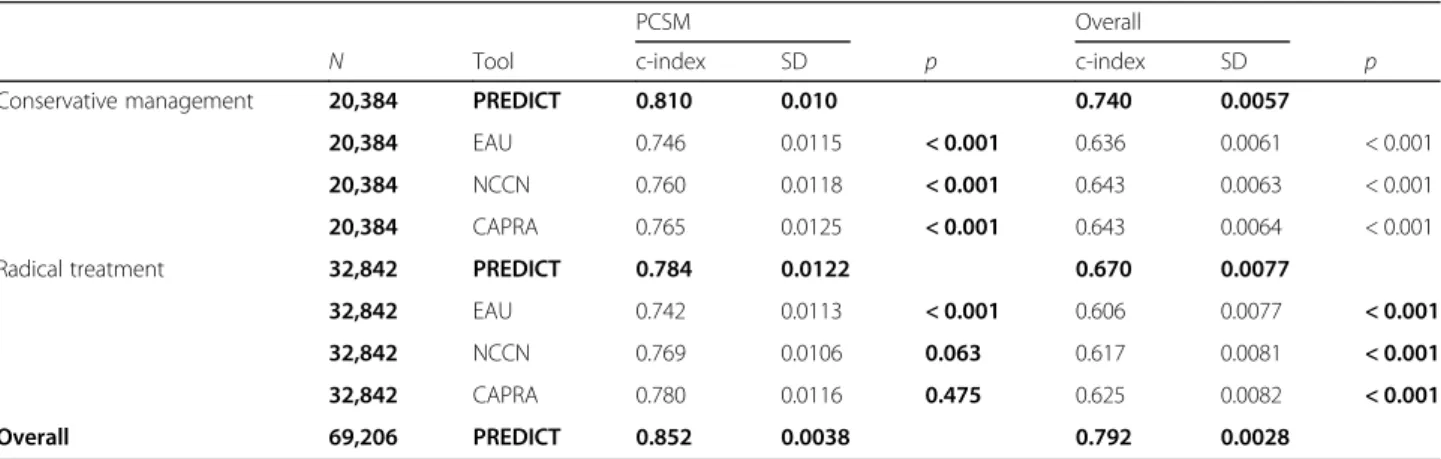
Comparison to existing models
PREDICT Prostate significantly outperformed the com-parator models when predicting ACM, both overall and Table 2Discrimination of PREDICT Prostate (PREDICT) within treatment sub-groups and comparison to other existing tools
PCSM Overall
N Tool c-index SD p c-index SD p
Conservative management 20,384 PREDICT 0.810 0.010 0.740 0.0057
20,384 EAU 0.746 0.0115 < 0.001 0.636 0.0061 < 0.001
20,384 NCCN 0.760 0.0118 < 0.001 0.643 0.0063 < 0.001
20,384 CAPRA 0.765 0.0125 < 0.001 0.643 0.0064 < 0.001
Radical treatment 32,842 PREDICT 0.784 0.0122 0.670 0.0077
32,842 EAU 0.742 0.0113 < 0.001 0.606 0.0077 < 0.001
32,842 NCCN 0.769 0.0106 0.063 0.617 0.0081 < 0.001
32,842 CAPRA 0.780 0.0116 0.475 0.625 0.0082 < 0.001
Overall 69,206 PREDICT 0.852 0.0038 0.792 0.0028
EAUEuropean Association of Urology criteria,NCCNNational Cancer Care Network criteria,CAPRAUCSF Cancer of the prostate risk assessment criteria,SD
within every major treatment sub-group (Table 2 and Additional file1: Table S3). Discriminatory performance was significantly better for PCSM overall (Additional file
1: Table S4). Across all treatment sub-groups, the model outperformed the 3-stratum EAU risk categories. Im-provements in discrimination failed to reach significance for PCSM in some comparisons with the NCCN and CAPRA scores, but in only one incidence was the c-index better for one of these comparator models (CAPRA score for PCSM among RP patients, Additional file1: Table S3).
Biopsy parameter sub-analysis
Biopsy parameterisation using percentage of positive cores (PPC) was re-explored within a group of 44,163 men who had this information registered (Additional file
1). Inclusion of biopsy characteristics did not signifi-cantly alter the discriminatory performance of the model (Additional file 1: Tables S4 & Table S5): either using a dichotomous 50% percentage of cores cut-off or PPC as a continuous variable. Inclusion of biopsy information did improve calibration across lower-risk quintiles of risk for PCSM. Calibration for any-cause death however was unchanged regardless of inclusion of biopsy infor-mation (Additional file1: Table S6 & Figure S1).
Discussion
In this large external validation cohort, we demonstrated that PREDICT Prostate is a robust and generalisable long-term prognostic model. In the analysis of an inde-pendent cohort, ten times larger than the original co-hort, discriminatory accuracy and calibration was good. This also remained true within treatment groups, par-ticularly in men managed conservatively or by radical therapy.
Conveying information to an individual about their disease prognosis within their own context of competing mortality has historically been an imprecise exercise with little objective data available. The most current prognos-tication is based on stratification groups of the cancer it-self and discussions with clinicians who may be conflicted towards a particular treatment [19–21]. PRE-DICTProstatewas conceived to address this gap in clin-ical need and standardise the decision-making process [3] and has shown promise to positively influence clin-ical decision-making [22]. It is built around long-term actual survival data and has been designed to address all AJCC criteria [6].
In the model development study, c-indices were 0.84 for PCSM and 0.77 for ACM within the UK validation cohort [3]. In the original study, external validity was Fig. 1Calibration curves demonstrating observed and expected 15-year probability of death across quintiles or risk for prostate cancer (PCa) death (left), non-PCa death (centre) and any-cause death (right)
Table 3Calibration of PREDICTProstatemortality estimates with observed numbers of deaths within treatment groups
PCa death Non-PCa death Any-cause death
n Obs Pred % Diff Obs Pred % Diff Obs Pred % Diff
‘Active surveillance’ 6224 195 191 0.06 850 940 1.44 1045 1131 1.38 ‘Watchful waiting’ 2745 239 198 1.49 942 915 0.98 1181 1112 2.51 ‘Other conservative’ 11,415 1358 1373 0.13 4906 4535 3.25 6264 5908 3.12 Radical prostatectomy 20,936 550 703 0.73 1919 2403 2.31 2469 3107 3.05 Radiotherapy 8953 737 560 1.94 1591 1594 0.03 2318 2155 2.18 ADT 15,980 4809 5798 6.19 7215 5993 7.65 12,024 11,792 1.45
also assessed within a Singaporean cohort. However, this cohort was small (n= 2546) and follow-up was quite short (5.1 years). Here we show in a cohort of > 69,000 men with longer median follow-up that our c-indices were actually improved to 0.85 for PCSM and 0.79 for ACM with excellent calibration. We did note a marginal overestimation of PCSM, which was contrary to the slight underestimation we had observed in the Singapore external validation in the original paper [3]. Given that the model is very well calibrated for ACM, this apparent overestimation of PCSM (and corresponding underesti-mation of NPCM) is likely to be a result of differences in cause of death classification, reporting or recording practices. ACM is the key outcome of interest, and a more unequivocal endpoint, against which this model performs very well.
When compared to existing models, PREDICT Pros-tate consistently outperformed the three-stratum risk classification system used in the EAU, D’Amico and NICE stratification criteria [16, 20, 23]. We recognise that comparisons against these risk stratification criteria are limited and that they are not designed to be prog-nostic nomograms; however, they are widely used in clinical practice to inform treatment decisions. Benefits of PREDICT were also seen against the NCCN and CAPRA scores, which add more granularity but ultim-ately retain a grouping system rather than individual es-timates [16,17]. For the outcome of PCSM, the CAPRA score did perform similarly well for some treatment groups, particularly in men treated with prostatectomy. This is unsurprising, as the model was originally built around prostatectomy patients [24]. It should be noted that PREDICT Prostate is not a treatment-specific tool; therefore, by assessing discrimination within treatment sub-groups, its discriminatory performance will inevit-ably be reduced. Nonetheless, PREDICT Prostate per-formed significantly better in predicting ACM and PCSM in most treatment groups. We also confirmed that adding in biopsy data to the model improved the performance though this effect was marginal in addition to the other variables already included. Using PPC as a continuous variable maximises the use of prognostic in-formation, and this parameterisation did lead to margin-ally superior discrimination for ACM.
The primary utility of PREDICT Prostate will be in men for whom conservative management and radical treatment might both be appropriate options, for whom the decision is most difficult. Abundant literature dem-onstrates that decision aids contribute to more knowledgeable and informed patients and that they can improve clinician-patient communication [25, 26]. Therefore, the model may have wide potential applica-tions in informing patient, clinician and multi-disciplinary team decision-making to reduce both
over-and under-treatment. Formal clinical impact assessments are also crucial to show face and functional validity, and these are underway with PREDICTProstate [27]. Future research endeavours could assess what impact the use of the model might have on actual treatment practices and compare this model with prognostic biomarkers, or radiological prognosticators. Over time, additional pa-rameters can be incorporated into this base model, or the model itself be updated, should new variables be shown to have independent prognostic effects [28].
More recent efforts in prognostic tools have sought to utilise novel genomic or biological markers to generate prognostic estimates. However, most established gen-omic tools such as Prolaris CCP and Oncotype DX GPS have predominantly been tested against shorter-term outcomes or in treatment-specific cohorts [29, 30]. Where they have been assessed against PCSM, concord-ance has been very similar to our model—for example, the Decipher genomic classifier alongside CAPRA showed an AUC of 0.78 (95% CI 0.68–0.87) for 10-year PCSM following prostatectomy [31]. Direct comparison with PREDICT Prostate is not possible without a head-to-head or combined study, but the value of such expen-sive tests do need to be re-assessed in the context of optimised clinical multivariable models [32]. In this con-text, we would welcome collaborations or independent studies on the value of adding genomic classifiers to fu-ture iterations of PREDICTProstate.
This study has numerous strengths, given the large sample size, long follow-up and high completeness of data in PCBaSe [33]. However, we recognise limitations inherent to using registry data. Seventeen per cent of men were excluded due to missing data, and we cannot exclude this, introducing some bias. A large proportion of men within this validation dataset had low-grade dis-ease, such that PCa mortality rates were relatively low which may affect discriminatory performance. Men diag-nosed within the inclusion period may also not be repre-sentative of contemporary practice with changes in PCa diagnosis and treatment. For instance, we recognise that primary hormone therapy is now rarely used in the con-text of non-metastatic PCa; hence, we included sub-group analyses within other treatment sub-groups. We also appreciate that multi-modal therapies are increasingly used in higher risk cases, which we were not able to as-sess in this study due to the inclusion dates and data availability limitations of our datasets. Another particular concern is the lack of information from magnetic reson-ance imaging (MRI). However, the current focus for MRI is on tumour detection rather than prognostication and it is unknown if MRI lesion characteristics (Likert or PIRAD scoring) have any bearing on survival. Our model also cannot account for subsequent transitions to different treatments. However, in our UK dataset,
conversions to active treatment were less than 6% across total follow-up [3]. We also recognise the lack of T-stage sub-classification, which is a key parameter in 2 of the existing models we made comparisons to. However, it is accepted that T stage is often inaccurately assigned in localised disease [34]. We also recognise that other end-points of interest exist, particularly the development of metastases and commencement of hormone therapy. The model is untested against these endpoints, but cali-brated against the more robust endpoint of death.
A key issue going forward is the validation of this model in non-Caucasian and screened populations. Al-though the original paper re-tested the model in Singa-porean men, PREDICT Prostate remains untested in men of African descent or other ethnicities. Independent validations within screened populations, and within other prospectively collected or randomised datasets, would also be helpful and should be encouraged. Finally, we recognise that other nomograms are available, against which direct comparisons would be very insightful. These were not possible within the design of this study, or the limitations of this data, particularly with regard to comorbidity.
Conclusions
This large external validation demonstrates the robust-ness of PREDICT Prostate.PREDICTProstate, available as a free-to-use web tool [4], has the potential to signifi-cantly improve shared decision-making for PCa manage-ment, particularly the choice between conservative management and radical treatment. Further, independ-ent external validations are encouraged, especially in populations of different ethnicities.
Supplementary information
Supplementary informationaccompanies this paper athttps://doi.org/10. 1186/s12916-020-01606-w.
Additional file 1.Supplementary files.
Additional file 2.Data request and study outline form to PCBaSe.
Abbreviations
ACM:All-cause mortality; AJCC: American Joint Committee on Cancer; AUC: Area under the curve; CAPRA: University of California San Francisco cancer of the prostate risk assessment score; c-index: Concordance index; EAU: European Association of Urology; NCCN: National Comprehensive Cancer Network; NICE: National Institute for Health and Care Excellence (UK); NPCM: Non-prostate cancer mortality; O:E ratio: Observed to expected ratio; PCa: Prostate cancer; PCBaSe: Prostate Cancer data Base Sweden;
PCSM: Prostate cancer-specific mortality; PIRADS: Prostate imaging reporting and data system; PPC: Proportion of positive cores; PSA: Prostate-specific antigen; T stage: Tumour stage; UK: United Kingdom; 95% CI: 95% confidence interval
Acknowledgements
Collection of data in the National Prostate Cancer Register of Sweden was made possible by the continuous work of the NPCR steering group: Pär Stattin (chairman), Ingela Franck Lissbrant (deputy chair,) Camilla Thellenberg,
Magnus Törnblom, Stefan Carlsson, Marie Hjälm-Eriksson, David Robinson, Mats Andén, Jonas Hugosson,, Maria Nyberg, Ola Bratt, Olof Akre, Per Fransson, Eva Johansson, Johan Stranne, Fredrik Sandin and Karin Hellström. Authors’contributions
DT, PP and VJG conceived, designed and analysed the study collaboratively. OB and PS reviewed the project design and oversaw the collection, curation and release of data. All authors were involved in the critical review of the results and have contributed to, read and approved the final manuscript. Funding
This work was supported by a Research Scholarship from The Urology Foundation and Infrastructure support from Cancer Research UK Cambridge Institute and the Cambridge Biomedical Campus. The work within the PCBaSe was funded by the Swedish Research Council and the Swedish Cancer Society.
Availability of data and materials
The datasets used in the current study can be made available at a remote server with export of aggregated data only. The application will be considered by the Prostate Cancer data Base Sweden reference group and The Research Ethics Board in Uppsala. Please contact author PS.
Ethics approval and consent to participate
The release of these data was approved by the Prostate Cancer data Base Sweden committee after peer review.
Consent for publication N/A.
Competing interests
The authors have read theBMC Medicineeditorial policy on competing interests and declare they have no relevant conflicts of interest to declare. Author details
1Academic Urology Group, University of Cambridge, Norman Bleehan Offices, Addenbrookes Hospital, Hills Road, Cambridge CB2 0QQ, UK.2Department of Urology, Institute of Clinical Science, Sahlgrenska Academy, University of Gothenburg, and Sahlgrenska University Hospital, Region Västra Götaland, Gothenburg, Sweden.3Department of Surgical Sciences, Uppsala University, Uppsala, Sweden.4Department of Cancer Epidemiology, University of Cambridge, Cambridge, UK.5Vincent Gnanapragasam, Academic Urology Group, University of Cambridge, Cambridge, UK.
Received: 17 January 2020 Accepted: 27 April 2020
References
1. NPCA. National Prostate Cancer audit - annual report 2017. 2017. 2. Greenberg DC, Lophatananon A, Wright KA, Muir KR, Gnanapragasam VJ.
Trends and outcome from radical therapy for primary non-metastatic prostate cancer in a UK population. PLoS One. 2015;10(3):e0119494. 3. Thurtle DR, Greenberg DC, Lee LS, Huang HH, Pharoah PD, Gnanapragasam
VJ. Individual prognosis at diagnosis in nonmetastatic prostate cancer: development and external validation of the PREDICT Prostate multivariable model. PLoS Med. 2019;16(3):e1002758.
4. Predict Prostate Homepage. Available from:https://prostate.predict.nhs.uk/. Accessed 29 Mar 2020.
5. NICE. Endorsed resource - Predict Prostate. Prostate cancer: diagnosis and management. 2019.
6. Kattan MW, Hess KR, Amin MB, Lu Y, Moons KG, Gershenwald JE, et al. American Joint Committee on Cancer acceptance criteria for inclusion of risk models for individualized prognosis in the practice of precision medicine. CA Cancer J Clin. 2016;66(5):370–4.
7. Moons KG, Altman DG, Vergouwe Y, Royston P. Prognosis and prognostic research: application and impact of prognostic models in clinical practice. BMJ. 2009;338:b606.
8. Justice AC, Covinsky KE, Berlin JA. Assessing the generalizability of prognostic information. Ann Intern Med. 1999;130(6):515–24.
9. Altman DG, Vergouwe Y, Royston P, Moons KG. Prognosis and prognostic research: validating a prognostic model. BMJ. 2009;338:b605.
10. DeLong ER, DeLong DM, Clarke-Pearson DL. Comparing the areas under two or more correlated receiver operating characteristic curves: a nonparametric approach. Biometrics. 1988;44(3):837–45.
11. Van Hemelrijck M, Wigertz A, Sandin F, Garmo H, Hellström K, Fransson P, et al. Cohort profile: the National Prostate Cancer Register of Sweden and Prostate Cancer data Base Sweden 2.0. Int J Epidemiol. 2013;42(4):956–67. 12. Tomic K, Berglund A, Robinson D, Hjälm-Eriksson M, Carlsson S, Lambe M,
et al. Capture rate and representativity of the National Prostate Cancer Register of Sweden. Acta Oncol. 2015;54(2):158–63.
13. Fall K, Strömberg F, Rosell J, Andrèn O, Varenhorst E, Group S-ERPC. Reliability of death certificates in prostate cancer patients. Scand J Urol Nephrol. 2008;42(4):352–7.
14. Harrell F. Package‘Hmisc’. In: Dupont C, editor. CRAN2018. p. 235–6. 15. Heidenreich A, Bastian PJ, Bellmunt J, Bolla M, Joniau S, van der Kwast T, et al.
EAU guidelines on prostate cancer. Part 1: screening, diagnosis, and local treatment with curative intent-update 2013. Eur Urol. 2014;65(1):124–37. 16. NCCN. National Comprehensive Cancer Network Clinical Practice Guidelines
in Oncology: Prostate cancer. Version 2. 2018. Available from:https://www. nccn.org/professionals/physician_gls/pdf/prostate.pdf. Accessed 13 Mar 2020.
17. Cooperberg MR, Pasta DJ, Elkin EP, Litwin MS, Latini DM, Du Chane J, et al. The University of California, San Francisco Cancer of the Prostate Risk Assessment score: a straightforward and reliable preoperative predictor of disease recurrence after radical prostatectomy. J Urol. 2005;173(6):1938–42. 18. May S, Hosmer DW. A simplified method of calculating an overall
goodness-of-fit test for the Cox proportional hazards model. Lifetime Data Anal. 1998;4(2):109–20.
19. AUA/ASTRO/SUO. Clinically localized prostate cancer: AUA/ASTRO/SUO guideline 2017.
20. NICE. National Institute for Health and Care Excellence NICE Guidelines [CG175] Prostate cancer: diagnosis and treatment. 2014.
21. Kim SP, Gross CP, Nguyen PL, Nguyen PY, Smaldone MC, Thompson RH, et al. Specialty bias in treatment recommendations and quality of life among radiation oncologists and urologists for localized prostate cancer. Prostate Cancer Prostatic Dis. 2014;17(2):163–9.
22. Thurtle DR, Jenkins V, Pharoah PD, Gnanapragasam VJ. Understanding of prognosis in non-metastatic prostate cancer: a randomised comparative study of clinician estimates measured against the PREDICT prostate prognostic model. Br J Cancer. 2019;121(8):715–8.
23. D'Amico AV, Whittington R, Malkowicz SB, Schultz D, Blank K, Broderick GA, et al. Biochemical outcome after radical prostatectomy, external beam radiation therapy, or interstitial radiation therapy for clinically localized prostate cancer. JAMA. 1998;280(11):969–74.
24. Cooperberg MR, Broering JM, Carroll PR. The UCSF cancer of the prostate risk assessment (CAPRA) score accurately predicts metastasis, prostate cancer mortality, and all-cause mortality regardless of treatment type. J Urol. 2008;179(4):114–5.
25. O'Connor AM, Rostom A, Fiset V, Tetroe J, Entwistle V, Llewellyn-Thomas H, et al. Decision aids for patients facing health treatment or screening decisions: systematic review. BMJ. 1999;319(7212):731–4.
26. Lin GA, Aaronson DS, Knight SJ, Carroll PR, Dudley RA. Patient decision aids for prostate cancer treatment: a systematic review of the literature. CA Cancer J Clin. 2009;59(6):379–90.
27. Registry I. ISRCTN 28468474 PREDICT Prostate Patient Study Evaluation of a new tool, PREDICT Prostate, to aid treatment decision-making for men with newly diagnosed non-metastatic prostate cancer; 2018.
28. Wishart GC, Bajdik CD, Dicks E, Provenzano E, Schmidt MK, Sherman M, et al. PREDICT Plus: development and validation of a prognostic model for early breast cancer that includes HER2. Br J Cancer. 2012;107(5):800–7. 29. Ontario HQ. Prolaris cell cycle progression test for localized prostate cancer: a
health technology assessment. Ont Health Technol Assess Ser. 2017;17(6):1–75. 30. Cucchiara V, Cooperberg MR, Dall'Era M, Lin DW, Montorsi F, Schalken JA,
et al. Genomic markers in prostate cancer decision making. Eur Urol. 2018; 73(4):572–82.
31. Cooperberg MR, Davicioni E, Crisan A, Jenkins RB, Ghadessi M, Karnes RJ. Combined value of validated clinical and genomic risk stratification tools for predicting prostate cancer mortality in a high-risk prostatectomy cohort. Eur Urol. 2015;67(2):326–33.
32. Herlemann A, Washington SL, Eapen RS, Cooperberg MR. Whom to treat: postdiagnostic risk assessment with Gleason score, risk models, and genomic classifier. Urol Clin North Am. 2017;44(4):547–55.
33. Tomic K, Westerberg M, Robinson D, Garmo H, Stattin P. Proportion and characteristics of men with unknown risk category in the National Prostate Cancer Register of Sweden. Acta Oncol. 2016;55(12):1461–6.
34. Reese AC, Sadetsky N, Carroll PR, Cooperberg MR. Inaccuracies in assignment of clinical stage for localized prostate cancer. Cancer. 2011; 117(2):283–9.
Publisher’s Note
Springer Nature remains neutral with regard to jurisdictional claims in published maps and institutional affiliations.