Working Paper/Document de travail
2011-3
Discounting in Mortgage Markets
Bank of Canada Working Paper 2011-3
February 2011
Discounting in Mortgage Markets
by
Jason Allen,1 Robert Clark2 and Jean-François Houde3
1Financial Stability Department
Bank of Canada
Ottawa, Ontario, Canada K1A 0G9 [email protected]
2HEC Montréal
CIRANO and CIRPÉE Montréal, Quebec [email protected] 3University of Wisconsin-Madison Madison, Wisconsin and CIRANO [email protected]
Bank of Canada working papers are theoretical or empirical works-in-progress on subjects in economics and finance. The views expressed in this paper are those of the authors.
Acknowledgements
Jason Allen thanks UW-Madison and HEC-Montreal for their hospitality while writing this paper. Robert Clark thanks HEC Montréal for funding. This research has benefited from the financial support of the NSF (SES-1024840). We thank the Canadian Mortgage and Housing Corporation and Genworth Financial for providing us with the data. We are especially indebted to Nick Ricketts and Benoit Sanscartier for their help with the CMHC data set. We are indebted to Stuart Levings, Winsor MacDonnell and Joanna Sunderland for their help with the Genworth data set. We also thank Allan Crawford, Pierre Duguay, Walter Engert, Ron Morrow, and Pierre St-Amant for their consistent effort on this project. We thank seminar participants at the Bank of Canada, FTC, DePaul University, University of Alberta, Lakehead University, Boston University, New York University, and the Invitational Choice Symposium (Miami) for their comments. We greatly benefited from discussions with Jim Day, Kim Huynh, Jonathan Levin, Hector Perez-Saiz, Greg Tkacz, and Virginie Traclet. All errors are our own.
Abstract
This paper studies discounting in mortgage markets. Using transaction-level data on Canadian mortgages, we document that over time there’s been an increase in the average discount, along with substantial dispersion. The standard explanation for dispersion in credit markets is that lenders engage in risk-based pricing. Our setting is unique since contracts are guaranteed by government-backed insurance, meaning risk cannot be the main driver of dispersion. We find that mortgage rates depend on individual, contractual, and shopping market characteristics. There is also an important amount of unobserved heterogeneity in rates, which could be attributed to search costs.
JEL classification: D4, G21, L0
Bank classification: Financial institutions; Financial services
Résumé
Les auteurs étudient les rabais consentis sur les taux hypothécaires affichés. Au terme d’un examen détaillé des transactions hypothécaires conclues au Canada, ils constatent une hausse du rabais moyen au fil du temps ainsi qu’une forte dispersion des rabais accordés. Cette dispersion sur les marchés du crédit est généralement attribuée à la différenciation des prix que les prêteurs pratiqueraient en fonction du risque. L’approche adoptée ici est novatrice en ce que les contrats hypothécaires bénéficient d’une assurance garantie par l’État, de sorte que le risque ne peut être le principal déterminant de la dispersion. Les auteurs concluent que les taux hypothécaires dépendent des caractéristiques des ménages et des prêts ainsi que des particularités du marché local. Une bonne partie de l’hétérogénéité des taux s’explique également par des caractéristiques non observées, peut-être liées aux coûts de recherche.
Classification JEL : D4, G21, L0
1
Introduction
In many markets prices are determined through a negotiation process between buyers and sellers. Sellers post a price, but consumers may be able to negotiate a discount. The extent to which sellers are willing to discount may depend on consumer, contractual, and market-structure characteristics. This type of pricing behavior can be found, for example, in the markets for automobiles, houses, consumer loans, health insurance, and personal finance.
In this paper we study discounting in the market for mortgages. Our focus is on the Canadian mortgage market. In Canada the primary originators of mortgages operate na-tional branch networks and set nana-tional posted rates even though the underlying economic conditions across regions can differ substantially. Local branch managers are then given the authority to bargain with potential customers for individual rates. This process results in a substantial amount of dispersion in the discounts received by different borrowers. The coefficient of variation for discounts in 2004, for example, was 82 per cent. Moreover, this dispersion leads to economically important differences in the costs of financing the purchase of a home. Given an average loan of 147,781 dollars in 2004, the extra term interest cost of paying the rate associated with the 75th percentile discount rather than the 25th percentile discount is 9,235 dollars. The full amortization interest cost (over 25 years) on this mortgage is 32,831 dollars.
Extensive rate dispersion has also been documented in other credit markets (see for instance Edelberg (2006) and Livshits, MacGee, and Tertilt (2009)). These papers attribute most of the observed dispersion to the ability of lenders to sort borrowers according to their level of risk. The development of ‘risk-based pricing’ has been facilitated by technological advances that make credit scoring much less costly than it was twenty years ago and has been encouraged by the fact that it can be significantly more profitable than uniform pricing (Einav, Jenkins, and Levin (2009) study pricing and contract design in the subprime
auto-sales market and find that using credit scoring to determine down-payment sizes can increase profits by 22 per cent relative to uniform pricing).
Our analysis makes use of detailed transaction-level data on mortgages administered by what were during our sample the only government-guaranteed mortgage insurance providers in Canada. Our setting is therefore unique since the loans we study are all fully insured, meaning that risk-based pricing does not explain all of the observed dispersion in rates. The objective of this paper is to provide a set of stylized facts regarding dispersion in the mortgage market in an effort to highlight the factors other than risk that might be explaining rate dispersion. Our analysis provides evidence that the remaining variation reflects either (i) heterogeneity in consumer preferences (in search costs, in bargaining ability, and in willingness to pay for bank characteristics), or (ii) heterogeneity in the profitability of each contract for the lender (in terms of prepayment and complementary services, and of future renegotiation value). It is certain that these factors are present in other credit markets also, but their effect on rate dispersion is being confounded with that of risk.
Our data set contains information on mortgage, household, and market structure char-acteristics which allows us to quantify these different dimensions. We find that rates are higher in more concentrated markets, and that banks discriminate between consumers based on loyalty, age, and financial constraints. The ways in which these household characteristics influence rates are all consistent with the idea that lenders evaluate the current and future profitability of borrowers when deciding on rates.
We also find that without conditioning on loan characteristics higher income households pay less for their mortgage than do lower income households. However, once we condition on loan size and house price we find that richer households actually pay the highest rates. We also find that borrowers that use mortgage brokers pay lower rates. These results are consistent with a model of search where borrowers with low search costs gather multiple quotes and negotiate large discounts. We provide further evidence of this using quantile
regressions which show that the marginal effects of the observable characteristics vary across rates. Consumers who search a lot get a rate close to marginal cost (the 5 year bond rate) regardless of their characteristics. Since the marginal effects are all close to zero for those consumers that engage in search, it is clear that they have extracted all of the rents. Irrespectively of their characteristics or the characteristics of the local market, informed consumers will always receive a good rate from the lender.
The paper is organized as follows. Section 2 discusses the Canadian banking indus-try, focusing on the residential mortgage market. Section 3 presents a description of the household-level data, including trends in the Canadian mortgage market. Section 4 describe the determinants of discounts. Section 5 concludes. Tables and figures are collected in the Appendix.
2
The Canadian Mortgage Market
2.1
Market Structure
The Canadian mortgage market is dominated by the “Big 6” Canadian banks (Bank of Montreal, Bank of Nova Scotia, Banque Nationale, Canadian Imperial Bank of Commerce, Royal Bank Financial Group, and TD Bank Financial Group), a regional cooperative network – Desjardins – and a provincially owned deposit-taking institution – Alberta’s ATB Financial. Collectively, they control 90 per cent of assets in the banking industry and are called the “Big 8.” Their dominance stems from the period of consolidation that occurred in the early 1990s when the large banks acquired nearly all of the trust companies who until that point had played an important role in the mortgage market. Poor loans in the 1980s left the trust companies or their holding companies in financial distress. As a response to these troubles, and to the fact that trust companies had an unfair legislative advantage when it came to making loans (having to do with reserve requirements), legislative changes took place in 1992
to allow banks to enter the trust business.
2.2
Mortgage contracts
The majority of Canadians sign 5-year fixed rate mortgages that are rolled over with new 5-year fixed rate contracts for 25 years (typically). Every 5 years the rate is renegotiated, which in effect acts like an adjustable rate mortgage with a fixed time-frame to renegotiate. The longer term mortgages that are the norm in the United States were phased out in the late 1960s in Canada after lenders experienced difficulties with volatile interest rates and maturity mismatching. Unlike in the United States, mortgage interest payments are not tax deductible in Canada and Canadian lenders do not use a “points” system.
The long-term mortgage contracts available in the United States largely spurred the innovation of securitization. Securitization is a process where mortgages (or any loans) are packaged and sold as a security, or tranches of securities, to investors. These mortgage-backed securities are a source of long-term funding for lenders, better matching the maturity of the mortgage. The maturity mismatch between 30 year mortgage contracts and short-term deposits was especially expensive for lenders in the 1970s when interest rates were both volatile and increasing rapidly.1 In Canada, mortgage contracts were already short-term, so there was less of a need for securitization. The level of securitization in both countries, therefore, is dramatically different. In 2004, 11 per cent of mortgages in Canada were securitized whereas in the United States it was over 50 per cent (Engert and Freedman 2003). Securitization has important implications for the loan process, such as bundling the loan application decision, the provision of funds, and the credit exposures (Engert and Freedman 2003). Keys, Mukherjee, Seru, and Vig (2010b), for example, found that in the U.S. securitization decreased lending standards. As articulated in Keys, Mukherjee, 1The Community Reinvestment Act in the United States also constrained balance-sheet funding of mort-gages by forcing banks to use local deposits to make local loans. Securitization was one way for banks to access outside funding.
Seru, and Vig (2010a), however, this only happened, at least up until 2006, for subprime mortgages sold to private investors in the non-agency (non-GSE) market. In Canada the insurer (CMHC or Genworth) has the final decision on whether a mortgage application is accepted and mortgages that are securitized are almost always insured.2 In Canada minimum
lending standards set by the government remained constant during our sample period and were relaxed only slightly post-2006. Given both the lack of data on securitization and its level of importance to the Canadian banking industry any potential effect of the increase in securitization on discounting is subsumed by time trends rather than captured explicitly in our econometric specifications.
2.3
Mortgage Insurance
Mortgage products offered by Canadian lenders fall into two broad categories: conventional mortgages (low loan-to-value), that are typically uninsured but can be privately insured, and high loan-to-value mortgages, that require insurance. In Canada the federal government guarantees about 73 per cent of residential mortgages (2009) and over 80 per cent of new home-owners purchase mortgage insurance.3 This is because mortgage insurance is required
for households borrowing more than 75 per cent (in 2007 this was changed to 80 per cent) of the cost of the home from a regulated financial institution. Mortgages are insured by either the government insurer, Canada Mortgage and Housing Corporation (CMHC), or the private insurer, Genworth Financial Canada. In both cases mortgages are explicitly insured by the government of Canada. Genworth Financial entered the Canadian market in late 1995 and grew to about one-third of the market.
2Lenders can purchase insurance, called portfolio insurance, on conventional mortgages in addition to high-LTV loans if they wish to securitize these as well.
3The percentage of government guaranteed mortgages is calculated as total insurance in force over total residential mortgage credit. As of 2009 CMHC had 473 billion CAD, Genworth 224 billion CAD and Canada Guaranty about 5 billion CAD of insurance in force in a market of 965 billion CAD.
The insurance companies charge a premium based on the household’s mortgage contract.4
The insurance premium is typically rolled into the mortgage and financed over the full amortization. In addition to the 75 per cent LTV rule mentioned above, there are also a number of other eligibility guidelines that should be met for mortgage loan insurance. A household should have a debt service to gross income ratio of less than 32 and a total debt service ratio of less than 40.5
If a borrower defaults the lenders’ actions depends on whether the contract was insured or not. In the case of default on insured mortgages, the insurer pays 100 per cent of all eligible claims and costs. Therefore for insured mortgages lenders are protected against the high costs associated with default, such as repossessing the home and finding a new buyer. In the case where a borrower defaults on an uninsured mortgage the lender takes possession of the home and would presumably try to sell it on the open market.
2.4
Pricing and Negotiation
Since most Canadian banks operate nationally, posted prices are common across the country. Lenders typically post the mortgage rate for their different products on a weekly basis in both national and local newspapers, as well as online. This is different than in the United States, where even national lenders such as Bank of America post different mortgage rates on their web-site depending on a consumer’s zip code.6
There is little dispersion in posted prices, especially among the Big six financial institu-tions. In fact, the coefficient of variation on posted rates for the Big six during the early part of our sample period is always around zero. Allen and McVanel (2009) provide a detailed analysis of movements in Canadian banks’ posted rates. Most of the time (between 63 and
4The premium ranges from 1.75 to 3.25 per cent for the most common mortgage types.
5Gross debt service is defined as principal and interest payments on the home, property taxes, heating costs, annual site lease in case of leasehold, and 50 per cent of condominium fees. Total debt service is defined as all payments for housing and other debt.
66 per cent depending on the term), posted prices do not change from week to week. When prices do change, only 6 per cent of the time do we observe only one bank adjusting its rates. Therefore, in shopping for a mortgage contract one option for consumers is to pay the posted price of their home bank or of some rival bank. However, in Canada this is not their only option. Local branch managers have the authority to offer borrowers discounts below the posted price under general guidelines from headquarters. Rather than settle for the posted price consumers can instead try to obtain mortgage contracts with lower rates. There are two ways for them to do this.
One approach is to hire a broker to search for the best rates on their behalf. Unlike in the United States, brokers in Canada have fiduciary duties. Brokers are compensated by lenders, but “hired” by borrowers to gather the best quotes from multiple lenders. Typically, brokers are compensated between 1-1.3 per cent of the volume of mortgages that they bring to a lender. Borrowers could potentially hire several brokers, something we cannot observe.7 Rather than hire a broker, a borrower can instead search independently to obtain a list of quotes. There are two main forces influencing the rate quote(s) received by borrowers: (1) their preferences – namely search costs, bargaining ability, and valuation of bank services, and (2) their current and future profitability. The burden of gathering multiple quotes lies on consumers and there is heterogeneity is the cost of search across consumers. Consumers also differ in their bargaining ability and their valuation of various services related to the financial institutions themselves. For instance, there may be heterogeneity in their valuation of the branch/ATM network (since some may value being able to easily access a branch while others may do all of their banking online), their valuation of the other loan services provided by lenders or wealth management services. Finally, some consumers may have a 7In contrast, in the U.S. brokers receive both a cash-fee from the borrower and a yield-spread premium from the lender. The yield-spread premium is an increasing function of both the loan size and the interest rate, therefore brokers in the U.S. do not have an incentive to find borrowers the lowest rate (e.g. Hall and Woodward (2010)).
higher willingness to pay to have a mortgage contract with their current financial institution. Branch managers try to screen consumers based on their search costs, their valuation for their services, and their observable characteristics, and then evaluate the profitability of signing particular borrowers to mortgage contracts. Branch managers have an incentive to offer larger discounts to consumers who have gathered, or have the potential to gather, multiple rate quotes, and to those that are, or will be more profitable to the bank. On the other hand, negotiating larger discounts is costly for the bank and can reduce the commissions earned by branch employees (see KPMG (2008)).
The profitability of a mortgage contract signed between a particular borrower and a particular lender can be broken down into three components: (i) profits stemming directly from the contract, (ii) profits stemming from the purchase of complementary services, and (iii) profits stemming from future mortgage contracts signed between the two parties. Profits stemming directly from the contract depend on the revenues and costs it generates. Since the vast majority of mortgages in Canada are five-year fixed rate terms, in most cases direct revenue depends only on the size of the loan and the interest rate charged. Lenders must also consider the risk of default on the contract. However, since the contracts in our sample are all fully insured, default is less of a concern for lenders. There is though some risk of prepayment by the borrower which would reduce the revenue earned directly from the mortgage contract. More specifically, in some cases borrowers will contribute over and above their monthly payment to pay down the mortgage more quickly than the lender expected.8
8It is standard for borrowers to be granted a 15 per cent (and sometimes as high as 20 per cent) prepayment option per year. This means that a lump sum of 15 per cent of the original principal value can be paid down in any year of the contracted-term. Any unused prepayment room expires at the end of each year. Note that this prepayment risk is different than the risk most often discussed in the U.S. banking industry. In the U.S. the concern is that when interest rates decrease, consumes will attempt to pay down their entire mortgage and refinance. This is of little concern in Canada. The penalty for prepayment in excess of the stipulated limit can be fairly severe. According to Lascelles (2010) the prepayment penalty amounts to the greater of three months of interest or the interest rate differential (IRD) between the locked-in rate and the market rate times the number of remaining years. This effectively neutralizes any financial incentive to renegotiate in quest of a lower borrowing rate as the cost precisely offsets the advantage. However, up until 1999 CMHC policy stipulated that for the remaining two years of a five-year term, the penalty should be just
This risk is greater when borrowers face higher interest rates and for those that are (for given levels of debt) less leveraged and/or wealthier. The direct costs are related to the maturity-matched bond rate and the risk associated with default. Since we are looking only at insured mortgages the cost to banks in the case of default are mostly just transaction costs. Nonetheless, this risk is clearly greater for borrowers that are more leveraged and with poorer credit history, and so we would expect lenders to view these borrower-types as being less profitable.
Contract profitability also depends on the potential for borrowers to make complemen-tary purchases at the same financial institution where they hold their mortgage, such as saving/deposit accounts, other loans, credit cards, and investment products. The size of a borrower’s down-payments, for example, may influence how likely (s)he is to want, or be able to, borrow from the same institution in the near term for other durables.
Finally, profitability is affected by the potential for borrowers to renew their mortgage with the same financial institution at the end of the contract term. Financial institutions may have an incentive to lock-in borrowers since few negotiate the renewal of their mortgage.9 This tendency provides lenders with an incentive to attract consumers with larger loans who have large outstanding balances at the time of renewal. Similarly, younger consumers and first-time home buyers are likely to be more profitable in the long-term for lenders.
2.4.1 Negotiation on elements other than discounts
We assume throughout that borrowers can negotiate only on rates. It is possible that in some cases borrowers and lenders negotiate on elements of the mortgage contract other than the three months of interest. This rule has since been eliminated, but some lenders may still abide by it. It remains the case that for any mortgage term of greater than five years, the penalty for prepayment after the first five years cannot exceed three months of interest. Consistent with this, it appears that Canadians take advantage of their prepayment option much less than in the U.S. For instance, whereas Canadian borrowers can prepay up to 15-20 per cent of their mortgage each year without penalty, the average prepayment is less than 1 per cent (Lascelles 2010).
9CAAMP conducts annual surveys on the Canadian mortgage market and systematically finds that borrowers overwhelmingly (over 85 per cent) renew their mortgage with their existing financial institution.
rates. In Canada there are a number of closing fees, some of which might be negotiable, and others which are clearly not negotiable (at least with the lender). For example, a lender may require a property assessment before lending funds to buy the home. Typically the assessor is recommended by the real estate agent, and the cost ranges from 250 to 350 dollars. The appraisal could be waived by the lender, and is typically done so unless the purchasing price of the home is substantially greater than the market value. Anecdotal evidence suggests this fee is only rarely negotiable. CMHC and Genworth also used to charge an underwriting fee for mortgage insurance, and this could potentially be waved by the lender. The fee was between 75 and 165 dollars (these fees were dropped in 2006). Fees that are typically not negotiated between the lender and borrower include the home inspection fee (which the lender does not require), land registration fees (which are paid to the municipality) property taxes and insurance, and legal fees (paid to a notary or lawyer). Note that for property insurance the lender could offer a preferable rate (which we do not see in the data) rather than a discount on the mortgage price. This is rather unlikely as Canadian banks are not permitted to sell insurance inside their branch. There is also some evidence that lenders will in rare instances negotiate on the fraction of the contract that can be prepaid without penalty.
3
Data
3.1
Sources and sample selection
Our data come primarily from two sources. The first is the CMHC administrative mortgage database known as Emili. The CMHC is a crown corporation whose main purpose is to help Canadians afford housing by selling mortgage insurance. The CMHC has provided us with
a subset of its proprietary data on the insured covering the period 1992 to 2004.10 In total
we have access to 20 household/mortgage characteristics, listed in the Appendix (Table 2). Mortgage contracts were randomly sampled by Census Metropolitan Area (CMA). A CMA is comprised of a large urban center and surrounding urban and rural fringes. However, as our geographic identifier, we use the forward sortation area which is a finer measure than the CMA.11 While the average forward sortation area has a radius of 7.6 kilometers, the median is much lower at 2.6 kilometers.
The second major data source is provided by Genworth Financial Canada. Genworth is similar to the CMHC in that it offers mortgage insurance to Canadians and collects data on borrowers to manage its portfolio. Together there are over 660,000 individual mortgage contracts. However, there are a number of differences between the CMHC and Genworth data that are worth mentioning. First, the CMHC sample starts in 1992 and Genworth starts in 1996. Second, Genworth provided us with nearly their entire insurance portfolio and therefore geographic sampling (in this case) was not an issue. Third, the CMHC data include a number of categories not collected by Genworth. This includes a duration variable, where the lender notes the length of time the borrower has been in a relationship with the lender. Fourth, CMHC collects information on the residential status of the borrower. Borrowers are either home-owners, live with parents, or are renters. CMHC also collects information on lender-borrower relationships. That is, at the time of the mortgage application we know whether the borrower is a new client or has a prior history (for other products) with the 10Breslaw, Irvine, and Rahman (1996) have previously used this data to study mortgage term and amor-tization choice between 1980-1988.
11The forward sortation area is the first half of a postal code. The first letter gives the major geographic region (18 major regions in Canada). The second character is a number between 0 and 9, where 0 means a rural postal code and a number between 1 and 9 is an urban postal code. The last character gives the exact area of a city or town in an urban area. For rural areas the third character does not give this information. Some of the rural areas are very large, and we therefore drop them from our analysis. There are over 1,300 forward sortation areas in Canada. The postal code adds three characters to the forward sortation area. The postal code can define a specific address or range of addresses in a town or neighborhood. There are over 850,000 postal codes in Canada.
lender.
Both CMHC and Genworth only began collecting household-level information such as residential status and use of broker starting in 1998. This is also the case for the lender-borrower relationship variable. In much of our empirical analysis we therefore focus on the 1999-2004 period.
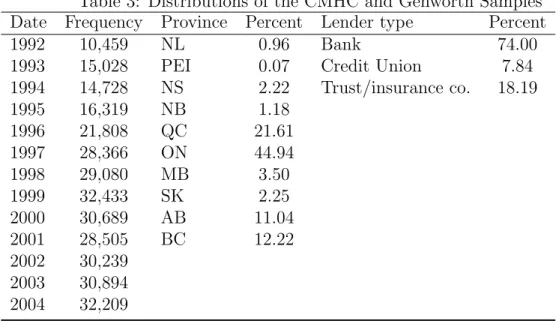
Table 3 provides the yearly sample size, a provincial break-down, and a break-down of mortgages by originator type. Since CMHC and Genworth Financial provided us with different sample sizes, we randomly select Genworth Financial contracts to match their market share. From Table 3 we see that the majority of mortgage contracts are signed in the provinces of Ontario and Qu´ebec and largely match population patterns. For confidentiality reasons we do not present summary statistics by institution.
We also have information on the posted mortgage rates for most of the banks. These data were collected every Wednesday from the Globe & Mail newspaper archives. Unfortunately these archives do not list information on posted rates for some of the smaller institutions. For this reason, despite the fact that we are interested in studying discounts, most of our analysis will actually focus on margins. More specifically we focus on the transaction rate minus a swap-adjusted bond rate. We can construct this measure regardless of which financial institution holds the mortgage contract.
Finally, we also have information on the number of branches of each financial institution in each market for 1998-2004 which we use to construct concentration measures in local markets. For more details on branch locations see Allen, Clark, and Houde (2008).
3.2
Market trends: The rise of discounting
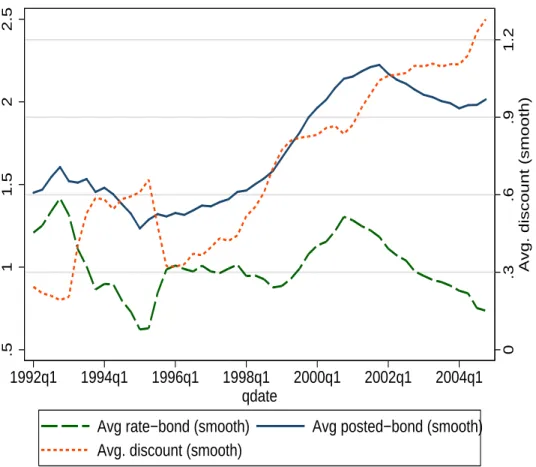
Discounting has not always been the norm in Canada. Until the mid 1990s very few Cana-dians received any discount on their mortgage.12 Figure 1 characterizes the evolution of
discounting for the most popular Canadian mortgage product – the 5-year fixed rate mort-gage. The figure illustrates how discounting has increased by about 100 basis points over the 12 years from 1992 to 2004. However, the mark-up in the posted price has also increased over time by about the same amount and so, as can be seen in the figure, the average margin – the difference between the average transaction rate and the bond rate (which proxies the cost of funding) – remained fairly constant over the period.
In other words, the average borrower is as well off in 2004 as in the early 1990’s. However, these trends hide the fact that not all borrower-types experience gains. This can be seen in Figure 2 which presents two histograms: one of discounts from 1992-1995 and the other of discounts from 2000- July 2002.13 In the earlier period there is little dispersion and the vast
majority of households received either no discount or a small discount.14 Towards the latter
part of our sample only a small fraction of borrowers do not receiving any discount, many receive large discounts, and there is considerable variance in the discounts received.
Figure 3 confirms the increase in dispersion over time. It presents a whisker plot illus-trating the dispersion in transaction rates for 5 year fixed rate mortgages. Since there is a substantial amount of price dispersion coming from week-to-week changes in posted rates, we subtract from the transaction rate the within-week median rate. The figure reveals that rate dispersion is increasing over time.
These trends coincide with a number of important changes to the market structure of 13TD-Canada Trust adopted a no-haggle policy in November 2002 which has a large effect on discounts, therefore we cut off the sample a few months before that.
14In Figure 2 some of the discounts are negative, which should never be the case. Lenders can offer borrowers a discount on the posted price, but are not allowed to offer a loan to a high-risk borrower for a premium. In the U.S., for example these premiums are called “overage” and there is evidence that they are more likely to be charged to minorities, e.g. Courchane and Nicerkson (1997) The negative discounts that we observe in the data come about because of how the data are administered and how rates are negotiated. Typically, a borrower will negotiate a rate several weeks prior to the purchase of the home, and this rate can be adjusted (downwards) until the purchase date. We observe posted rates weekly, and match the transaction rate with the posted rate for the week closest to the day the home is purchased, and not the posted rate on the day that the transaction rate is negotiated. Therefore if the posted rate falls and the borrower does not renegotiate, the discount could be counted as negative.
the Canadian banking industry. Following the regulatory changes of the early 1990’s, the Canadian banking industry underwent a major merger and acquisition wave, with the major banks acquiring almost all of the trust companies over the following decade. The result was a concentrated mortgage market in which a small number of large national financial institutions dominated the market.
Historically, the trusts offered lower rates and captured a large fraction of those bor-rowers that shopped for the best rate. Having swallowed up the trust companies, the large financial institutions began competing heavily amongst themselves for these borrowers. At the same time the Canadian market opened its doors to virtual and brick-and-mortar foreign competition in the mid 1990’s. As part of their entry strategy some foreign competitors used different pricing schemes than the primary lenders. Unlike the primary Canadian lenders, ING Canada, for example, entered with low no-haggle rates. The result was that the large financial institutions moved to a strategy in which they established higher posted rates and then negotiated individual-specific discounts rather than lowering posted prices for everyone. Therefore, while the average borrower is as well off under this new strategy, some types of borrowers experience gains, while others are worse off. Using this strategy the large financial institutions were able to maintain (or even grow) their market share.15
The fact that when faced with the threat of entry by foreign and virtual banks the incumbent banks moved from something closer to a single-price strategy where everyone pays the posted prices, to a strategy where they post a higher price but selectively offer discounts is consistent with existing models of strategic entry deterrence and price discrimination. Armstrong and Vickers (1993) show theoretically that when firms can set different prices for more and less captive customer segments they are more likely to deter entry of new 15There exists an extensive literature, starting with Riley and Zeckhauser (1983), that compares the profitability of posted-price and haggling pricing strategies. In a laboratory setting Cason, Friedman, and Milam (2003) find that markups (and profits) are significantly higher in haggle environments than posted price environments.
competitors into the less captive customer segments.16
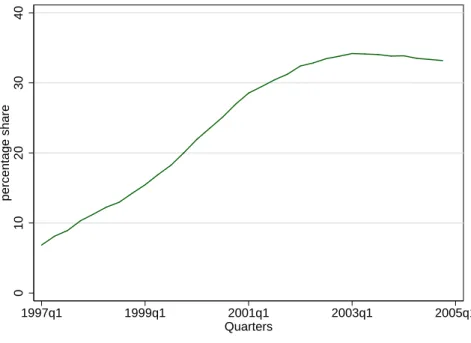
Also in the mid 1990’s, the role of mortgage brokers as financial intermediaries began to grow in Canada. Figure 4 presents the share of transactions that were broker-assisted in our sample. The share increased from less than 10 per cent to over 30 per cent in 7 years.17 A
large number of consumers, therefore, choose to elicit the help of a broker when shopping for a mortgage. Of course, the direction of causality is not at all clear. The use of brokers may have increased due to the fact that banks began offering discounts, but they may have also contributed to this increase in discounting. In Section 4 we show that, on average, borrowers that use a broker pay less on their mortgage than borrowers who do not.
As far as we are aware, during our sample period all lenders except the largest in the country, RBC, process broker-business.18 Rather than use mortgage brokers RBC relies
more heavily on in-house mortgage specialists (most financial institutions have mortgage specialists in addition to using brokers). These are broker-like individuals that only work for one lender. They will visit a potential borrower at their home or place of business, like a broker, but unlike a broker, they only sell their lender’s product.
Finally, there were important technological changes occurring during this time in the Canadian mortgage market.19 The 1990’s saw the advent of LAN and the internet making
it easier for staff at financial institutions to handle larger volumes of applications. More importantly the underwriting processes of financial institutions became automated during this time period making it much easier to work through the loan approval process. Since we are dealing only with insured mortgages, it should also be noted that in 1996 the CMHC introduced an automated approval system which dramatically increased the speed of its
16For more detailed discussions see Stole (2007) and Armstrong (2008).
17This is still substantially less than in the United States where pre-crisis brokers originate 68 per cent of mortgages. In 2009 the share of mortgages originated by brokers in the U.S. was less than 15 per cent.
18In 2006 BMO stopped using independent brokers, following RBC’s example.
19Similar changes occurred around the same time in the US. Underwriting systems were developed and data storage costs decreased, and so risk-based pricing grew in importance. See for instance Edelberg (2006).
mortgage approval process. Prior to this the banks faxed the information to the CMHC for approval. The new automated system standardized the national credit approval system and reduced the number of errors in client profiles at the CMHC. All of these changes may have made it easier for lenders to offer different rates to different borrowers as a function of their measurable characteristics.
3.3
Descriptive Statistics
In the following sections we focus on the period 1999-2004 since, as explained above, a number of variables that are key in determining discounting are missing or less accurate prior to 1999.
3.3.1 Household characteristics and mortgage contracts
We first present summary descriptions of discrete variables in Table 4. We focus on new home purchases so we exclude home-owners that are either refinancing or renewing their mortgage contract. Over 25 per cent of the borrowers in our sample owned a home at the time of the contract. These previous owners are obtaining a mortgage for a new property, but still do not have enough equity in the home to avoid paying insurance (they are upgrading). The remainingnew home owners are exiting from renting or living with their parents. Consistent with Figure 4 we find that by the late 1990’s the market share of brokers had reaching nearly 30 per cent. We also find that the majority of Canadians are buying detached homes. Lastly, the majority of mortgage contracts are for fixed periods; only a small number of households sign variable-rate mortgages.
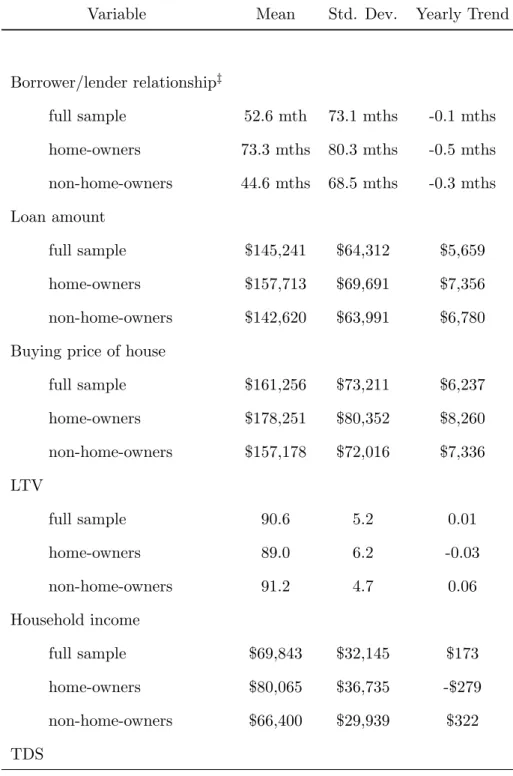
Summary descriptions of continuous variables are presented in Table 5. We present the mean, standard deviation, and yearly trend for (i) the full sample, (ii) a sub-sample of previous home-owners, and (iii) a sub-sample of new home-owners. The purpose of splitting the sample in this way is to explore the possibility that more experienced home-buyers have
a different mortgage shopping experience than first-time home-buyers.
For the full sample the mean borrower has been with his/her financial institution 53 months before the contract is signed, about 8 months more than the mean for new home-owners and 20 months less than the mean for previous home-home-owners. The trend has been towards shorter relationships over time, with more people are signing mortgage contracts with an institution that is not their primary financial institution at the time the mortgage is signed.
Table 5 also presents information on loan size and house prices, and also on loan-to-value ratios (LTVs). The mean loan is about 145,000 dollars to purchase a 161,000 dollars home (all in 2002 dollars). Previous owners buy more expensive homes than do new home-owners, and they also borrow more. The mean loan-to-value ratio (LTV) is around 90 for all samples.
The LTV is worth examining is more detail. The LTV constraint is set by the federal government and affects a borrower’s loan size choice. This ratio is used by governments to either spur or slow-down housing investment.20 It is therefore an important policy variable that affects a consumer’s budget constraint. Figure 5 plots LTV ratios. LTV ratios are highly localized around 90 and 95, and to a lesser extent 75, 80, and 85. The clustering comes about because the pricing schedule is discrete and there are only a small number of price-quantity pairs. Consumers therefore choose the LTV bucket that maximizes the loan but where they can still afford the monthly mortgage payments, including the insurance premium.
The mean household income is almost 70,000 dollars and the total debt service ratio (TDS) is 32. A TDS of 31.9 is relative low compared to the guideline maximum of 40. 20Most recently (2010) the Canadian government changed the maximum LTV for refinancing from 95 to 90. Changes to the LTV for new purchases have previously been made in 1982 and 1992, both recessions. In 1982 the maximum LTV was reduced from 95 to 90 and in 1992 the maximum LTV was increased from 90 to 95.)
Figure 5 presents a histogram of borrowers’ total debt service ratios. The graph is right-censored at 50, with all ratios greater than 50 accumulated at 50. There do not appear to be differences in the distribution of TDS ratios across samples. The 40 per cent TDS guideline is largely followed, with very few households borrowing with a TDS greater than the guideline maximum. Given the heavy right-skewness of the distribution, however, the constraint does appear to be binding for a large number of households. Previous home-owners and first-time home-owners have similar TDS ratios.
The typical mortgage term is 60 months; mortgages of this type represent over 70 per cent of the sample. The second most common term is 36 months, with 13 per cent of the sample. The standard amortization period on these term-mortgages is 300 months, with nearly all Canadians choosing this amortization period. We also present the mean transaction price and posted price, normalized by the swap-adjusted bond rates that match the term.21 We
discuss rates in more detail in the following subsections.
Discounting is prevalent in the Canadian mortgage market. Table 5 presents the sample means and standard deviations for both the transaction price less the adjusted bond rate and the posted price less the adjusted bond rate for 3 and 5 year fixed mortgages from 1999-2004. For each term, the difference between the two is the mean discount. Over the full sample, the mean discount for the 3 year mortgage is 48 basis points and the mean discount for the 5 year mortgage is 97 basis points. These represent average discounts of 9.2 and 19.2 per cent for the 3-year and 5-year mortgages, respectively.
21Banks use swaps to hedge the fact that they hold short-term liabilities (deposits) and long-term assets (mortgages). As the swap market developed, bond rates (including mortgage rates), became more closely linked to banks’ funding costs at long maturities (Allen and McVanel (2009)).
4
Empirical analysis
We have shown above that rates are dispersed. This is despite the fact that the loans we study are all fully insured and so the role of risk is much less important than standard credit markets. The purpose of this section is to determine what factors explain the remaining variation. We decompose discounts, focusing on factors related to (i) the profitability of each contract to the lender (in terms of prepayment and complementary services, and future renegotiation value) and to (ii) heterogeneity in consumer preferences – in search costs, in bargaining ability, and in willingness to pay for bank characteristics.
4.1
Explaining discounts
The focus of our analysis is on margins (transaction rates - adjusted bond rate) rather than discounts because we do not have the posted rate for some of the smaller financial institutions. We further restrict attention to 5 year fixed-rate mortgages amortized over 25 years, and to the 1999-2004 period.
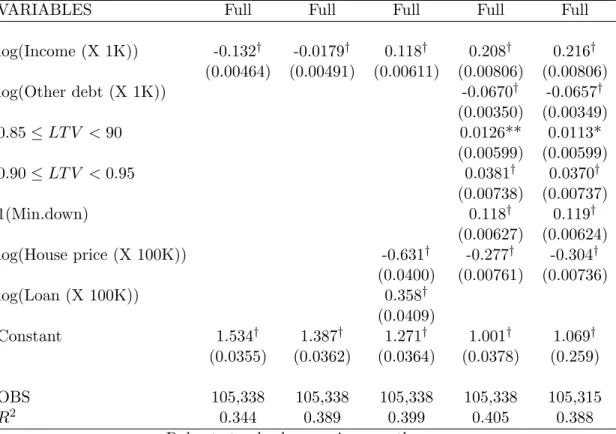
We decompose margins into loan, bank, and consumer effects. The first set of estimation results are presented in Table 6. All specifications include bank and week fixed effects. Columns (2)-(4) also include FSA (neighborhood) fixed effects. In Column (5) we replace the FSA fixed effects with about 25 FSA-level 2001 census variables such as rental and housing costs, income, age, etc. Focusing first on household income we see from columns (1) and (2) that richer households appear to pay lower mortgage rates. However, looking at column (2) we can see that some of this is due to unobserved neighborhood effects correlated with income. Furthermore, when conditioning on loan size the story is different; richer households in fact pay higher rates than poorer households (column (3)). The more expensive the home, however, the larger is the discount.
of 95, i.e. 1(Min. down)) pay higher rates than other borrowers – about 12 basis points more than the base-ratio of LTVs less than 0.85. 1(Min. down)) isolates the effect of down payment on rates since we control for house prices. Our results suggest that lenders charge a premium for such a high leverage ratio. The more borrowers put down (relative to the baseline), the smaller the premium they are charged. Borrowers in the 0.9-0.95 range pay a premium of about 4 basis points, while borrowers in the 0.85-0.9 range pay a premium of about 1.2 basis points.
Related to our discussion in Section 2.4, these results point to the possibility that different shopping/search incentives arise depending on the financial characteristics of the household, size of the loan, and, by extension, house price. Richer households may have larger search costs and so may spend less time shopping for and negotiating their mortgage. Likewise the incentive to search for and negotiate better rates is likely decreasing in the size of the down-payment. The fact that borrowers with different LTV’s pay different rates is also consistent with the fact that financial institutions are concerned with the future profitability of borrowers.
Finally, comparing columns (4) and (5) we see that the FSA fixed effects explain more of the variance in the rates than the FSA-level control variables, but not by a large amount. We use specification (5) throughout the rest paper because (i) in our analysis of the mortgage broker decision in Section 4.1.1 the data are at the FSA level and we cannot use FSA fixed effects and (ii) the specification with FSA fixed effects is difficult to solve when estimating the the different quantiles in Section 4.2.
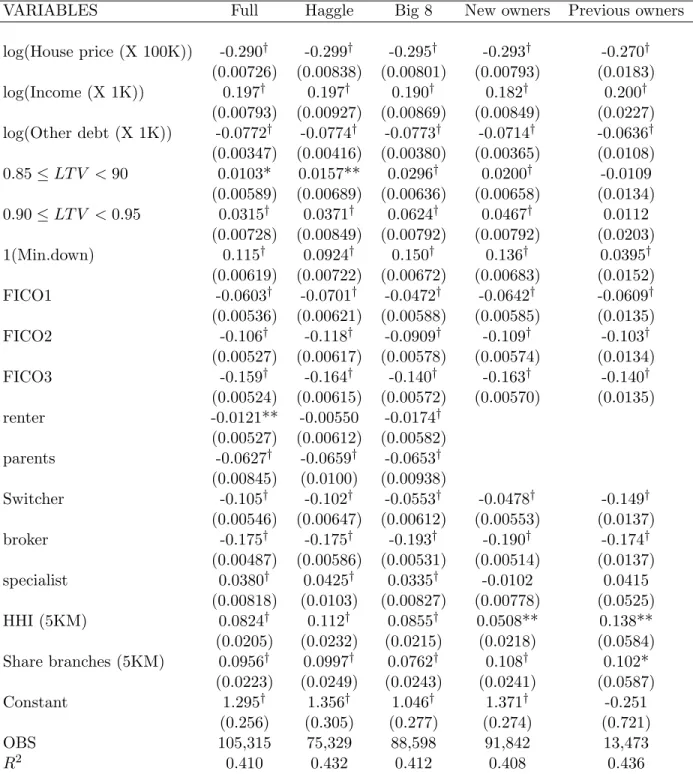
In Table 7 we display estimates for market and household characteristics, as well as the loan characteristics from Table 6. All specifications include week and bank fixed effects, along with the FSA-level census variables. Column (1) uses all of the contracts from 1999 to 2004 while columns (2)-(5) restrict to various subsamples. In column (2) we drop the period from November 2002 to August 2004. TD-Canada Trust was experimenting with a
no haggle policy during this period, which could have an effect on our estimates. In column (3) we restrict attention to contracts signed with the Big 8 financial institutions, while in columns (4) and (5) we compare new owners to previous owners.
We consider first the effect of market structure on margins. We find that more branch-concentrated neighborhoods (HHI) on average experience higher rates. Share branches is a borrower-specific variable and is calculated as the fraction of branches in a neighborhood owned by the borrower’s lender. We conclude that the larger a bank’s market share, the higher are the rates that it can charge to borrowers.
Turning to household characteristics we study the effect of borrower credit scores on rates. The literature on ‘risk-based pricing’ suggests that interest rate dispersion in many credit markets can largely be explained by heterogeneity in borrower risk levels and the ability of financial institutions to discriminate between borrowers according to these differences. We also find that borrower risk influences rates. In our data,F ICOis a categorical variable with four risk categories. The highest risk category represents the most creditworthy borrowers according to the Fair Isaac Corporation. The omitted category, risk0 represents borrowers that are the least credit worthy. Our results suggest that borrowers with better credit scores receive larger discounts. In normal credit markets this result would be intuitive: riskier consumers pay higher rates (for example see Demyanyk and Hemert (2009) for mortgage rate spreads between prime and subprime borrowers in the U.S.). However, our sample of mortgages are all insured, and so in case of borrower default the lender can transfer title of the home to the insurer and request payment from it (the insurer must then sell the home). Therefore, at first glance the positive relationship between FICO scores and discounts might seem surprising. We believe that the main explanation for the positive effect of a good credit score on rates is rooted in the long-term value of borrowers to financial institutions. As discussed in Appendix A, Canadians do most of their banking at a single institution. Lenders should therefore be interested in the quality of borrowers since they may represent
different profit opportunities for cross-product selling. Good credit scores are correlated with unobserved characteristics of borrowers that are valued by lenders. Lenders appear to take good credit scores as a signal that a consumer is profitable, that is, high credit score consumers are more likely to buy multiple products from a bank than low credit score consumers. Financial institutions therefore offer better rates to high credit score consumers in order to lock them in and then sell other products, such as credit cards and savings instruments.
As discussed above, it is also the case that despite the fact that the insurance company covers the expenses of the lender in case of default, there is still a cost to the lenders in dealing with defaulting borrowers and low credit score borrowers are more likely to default. Furthermore, the insurers pressure the financial institutions to use the same standards in evaluating mortgage contracts that will ultimately be insured and those that will not. In other words, the financial institutions cannot appear to be applying lower standards on mortgage contracts that they expect will be insured.
In the full specification Renters, P arents, and Switchers all receive lower rates. The base category for Renters and P arents is previous home-owner. Borrowers in the base category are likely older than in the other two categories. Our results suggest, therefore, that first-time buyers receive discounts relative to previous owners. This is consistent with Goldberg (1996) who, in the context of the car market, finds that households under the age of 30 who have not previously purchased a car receive discounts relative to experienced buyers. As in Goldberg (1996) we suspect that first-time buyers are more price elastic and lenders are more willing to offer discounts to younger borrowers in return for future expected profits.
TheSwitchervariable is an indicator variable equal to 1 if the borrower signs a mortgage with a financial institution that is not their main financial institution at the time of the mortgage origination. The lender is therefore attracting a new client. Our estimates suggest
that new clients receive larger discounts than existing clients, on the order of 10 basis points over the full sample. This is consistent with the extensive literature on consumer switching costs giving firms market power over loyal consumers (e.g. see Klemperer (1995)).
Over the full sample the average impact of a mortgage broker is to reduce rates by 17.5 basis points. Brokers are a significant factor, therefore, in driving discounts. This result is in sharp contrast to the mutual fund industry, for example, where Bergstresser, Chalmers, and Tufano (2009) find that on a risk-adjusted basis brokers actually delivered lower returns to consumers than direct channels between 1996-2004 in the U.S. It also appears to be in sharp contrast to the U.S. mortgage-broker experience where due to the lack of fiduciary duties mortgage brokers led borrowers to sign unfavorable contracts (Hall and Woodward (2010) or Berndt, Hollifield, and Sand˚as (2010)). It should be pointed out that in our estimation there might be unobserved borrower characteristics that affect both the decision to shop with a broker and outcomes. We examine this in more detail in the next section. Related to the broker result is the mortgage specialist result. Mortgage specialists offer convenience to consumers, although they do not reduce search costs. This is because they work for one lender only. What specialists do, however, is offer flexible hours that branch managers do not offer, and will go to a borrowers home, for example, to sign a contract. Borrowers who use a specialist pay on average 3-4 basis points for this convenience.
Columns (2)-(5) provide more disaggregated information. The results in column (2) are almost identical to those in (3) suggesting that the no-haggle policy of TD Canada Trust had little overall impact on the factors influencing discounting. Column (3) focuses on borrowers who sign mortgages at one of the 8 largest mortgage providers (Big 8) in Canada. The key difference between columns (3) and (1) is with the Switcher variable. The result suggests that borrowers who are new clients at one of the Big 8 banks receive less of a discount than borrowers who are new clients elsewhere. This result is consistent with the earlier result that banks with larger local branch networks offer smaller discounts. This second result,
however, suggests that in addition to competitive price factors (Share branch), lenders with larger branch networks also have a competitive quality factor. That is, consumers appear willing to sign a mortgage contract with a large Big 8 bank at a worse rate than they could receive elsewhere. One reason could be that borrowers value the other services provided by the lender and the lender takes this into account when pricing the mortgage.22 Evidence
in Appendix A suggests that the majority of Canadians do their banking at one financial institution, therefore it seems likely that consumers take into account the quality of the lender as a whole, not only as a mortgage-provider. The other difference is with respect to the LTV. The premium received by borrowers for larger downpayments is larger at Big 8 banks.
Columns (4) and (5) separate out contracts for new and previous home-owners. In some cases there are only small differences between the two groups of home-buyers, but in others it is substantial. For example, only the most financially constrained previous home-owners pay a premium, and it is one-third the size of the premium of the most financially constrained new home-owners. Another interesting difference shows up with Switcher. We find that previous home-owners that switch financial institutions receive a larger discount than new home-buyers. This should not be surprising. Previous home owners are also more experienced in mortgage contracting. Switcher is a proxy for consumers who reject the initial offer from their home bank. Conditional on searching, more experienced negotiators receive better rates.
22In a different market Verboven (2002) finds that the same firm selling the same car but with two engine options – diesel or gasoline – charges a 70-90 per cent mark-up on the diesel engine above the cost difference because of consumer’s willingness to pay for quality. In a case study of S&P index funds Horta¸csu and Syverson (2004) show that some firms can charge more for what appear to be nearly identical goods because, in addition to search costs, investor’s perceive quality differences based on such things as whether the fund is exchange-traded and the number of funds under management, for example.
4.1.1 Mortgage Brokers
In Table 7 we show that the impact of a broker ranges from a discount of 17.4 basis points to 19.3 basis points, depending on the sample. However broker choice is not exogenous. There might be unobserved borrower characteristics that affect both the decision to shop with a broker and outcomes. For instance, financially literate borrowers are likely to get better rate quotes regardless of whether they use a broker or not. If these borrowers are also more prone to shop with a broker, this may inflate the coefficient on the broker variable. In Table 8 we present estimates from same specifications as in Table 7 but using a two-stage treatments effects model. The first-stage is a probit regression using all of the regressors from Table 7 and an additional regressor which gives us an exclusion restriction. The exclusion restriction we use is the share of mortgage brokers in a market (5KM around the centroid of the FSA) in 2009. Broker presence should be strongly correlated with broker choice and only indirectly affect interest rates. Ideally we would want to use the share of mortgage brokers in the years for which the contracts were signed. Unfortunately we do not have broker location data prior to 2009. There is some indirect evidence, however, that the market has been relatively stable since about 2001. (See Figure 4 for the share of transactions that were broker assisted between 1997 to 2004. In addition market share data from the mortgage industry for 2005-present suggest that the share of broker-assisted transactions has remained constant since 2004.)
We present results for three specifications, the full sample and two subsamples – new home-owners and previous home-owners. In all instances we find that the more concentrated the broker market (Broker share) the less likely a borrower is to use a broker. In other words, borrowers are more likely to use brokers in markets where there is more broker competition. This is also the case with lender competition (HHI). Borrowers are more likely to use a broker when there are many lenders. When there are many lenders the returns to hiring a broker are potentially higher since they have access to more options. In addition we find
that poorer households and those more financially constrained are more likely to use a broker than rich and financially unconstrained households. Poorer or more financially constrained borrowers may recognize that they will be at a disadvantage when bargaining over rates with financial institutions. This finding can be related to the effect Scott Morton, Zettelmeyer, and Silva-Risso (2003) find of being a minority on prices for cars purchased via the internet. In their context, minorities buying cars on the internet do not face the same level of price discrimination as minorities buying cars at dealers. In our context, poorer borrowers may face greater levels of price discrimination when bargaining in person at the branch than they do when transacting through a broker, resulting in an increased propensity on the part of poorer borrowers to select brokers.
Turning to the second stage regression we can see that controlling for the endogeneity of broker usage has little effect on the other control variables. The only other coefficients that are affected when we control for the endogeneity of broker choice are those on the share of branches in 5KM and on switchers. In both the cases their effects are dampened once we control for endogeneity of broker choice.
The main effect is on the broker coefficient. Controlling for endogeneity the coefficient on broker nearly doubles, so that borrowers using a broker get a discount of approximately 32 basis points in the full sample. This follows from the first stage regression, which show that the borrowers using a broker are the poorest and most financially constrained.
4.2
Quantile Regressions
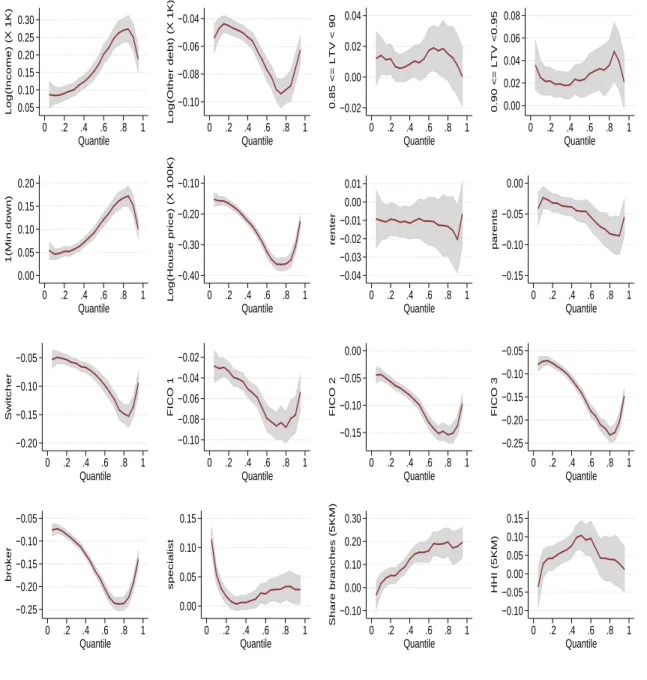
We next examine results from quantile regressions of margins on loan, market, and house-hold characteristics, controlling for week, bank, and province fixed effects as well as census variables. The sample period is 1999-2004. We are interested in determining the effects of the covariates on margins for different quantiles of the conditional margin distribution. Estimates are presented graphically in Figure 6.
In each picture, the X-axis indicates the quantile of the distribution of margins conditional on the particular covariate. The quantiles of the margin distribution capture the distribution the outcome if the negotiation. Low quantiles represent borrowers who received a relatively big discount given their value of the covariate, while high quantiles are borrowers paying high rates relative to their value (that is, they are receiving almost no discount).
We are conditioning on a very rich set of financial characteristics that affect the prof-itability of the transaction. Therefore, what is left reflects mostly borrower heterogeneity, and so it makes sense to think of this distribution as stemming from consumers’ unobserved search/negotiation ability: low quantiles are consumers with low search costs who are able to gather quotes from multiple lenders or with good negotiation skills, while higher quantiles are consumers with larger search costs.
For the majority of covariates the marginal effects are heterogeneous across the distri-bution of rates. The exceptions are two-thirds of the LT V variables, Renter and to some extentP arents. The latter two are our two proxies for age and there appears to be a constant marginal effect of both characteristics along the distribution of rates.
For the other household characteristics that we examine (broker, FICO score and switcher), a consistent U-shaped pattern emerges.23 The profiles of the marginal effects of the market
characteristics as well as the marginal effects for house prices and other debt are the opposite of the household characteristics but have the same interpretation because the signs of the coefficients are the opposite. In each case the marginal effects are zero or close to zero in the tails of the conditional distribution. The marginal effect of the household characteristics on margins is decreasing (increasing for the market, house price and other debt variables) until we reach the highest quantiles, at which point it begins to increase (decrease for the market, house price and other debt variables). In other words the marginal effect of using 23Unlike in the linear model, however, we do not control for the endogeniety of broker choice in the quantile regressions.
a broker, or of having a better FICO score, or of being a new consumer (Switcher) on dis-counts is increasing in transaction rate up until about the 80th percentile, at which point the marginal effect on discounts begins to decrease. At the lowest rates, therefore, the marginal effect of using a broker or having a good FICO score or being a new client does not lead to a noticeable discount.
How do we explain this pattern? If the quantiles map into search propensity, then the results suggest that consumers who search a lot get a rate close to marginal cost regardless of their characteristic. Since the marginal effects are all close to zero for those consumers that engage in search, it is clear that they have extracted all of the rents. Irrespectively of their characteristics or the characteristics of the local market, informed consumers will always receive a good rate from the lender.
At the other end of the distribution the marginal effect is also zero. Here the reason is more mechanical. At this point in the distribution, the dispersion in rates should be zero since there is a ceiling imposed on branch managers by the posted rate. Since the posted price is independent of consumer characteristics, the marginal effects should be zero conditional on paying the posted price. (If the distribution were not truncated, there would be no increase at this end of the distribution.)
For borrowers in between, those who do not search too much or have imperfect informa-tion about lenders’ costs, the transacinforma-tion rate is highly correlated with the characteristic. In other words, the marginal effect of the covariate on this part of the distribution is much more important.
5
Conclusion
This paper studies prices in the Canadian mortgage market, in particular the prevalence of discounting by the majority of lenders. We find that discounting has increased over time
and that there is considerable dispersion in discounts. Since the contracts we study are all insured, we look for factors other than risk to explain this dispersion. The extent to which consumers receive discounts depends on a variety of household, contractual, and market-structure characteristics.
The main results of the paper are the following. First, without conditioning on loan characteristics we find that higher income households pay less for their mortgage than lower income households. However, once we condition on loan size and house price we find that richer households actually pay the highest rates. Second, financially constrained households pay higher rates (i.e. 1(Min.down) and low FICO score). Third, banks discriminate between consumers based on loyalty, age, and valuation of network size. Fourth, borrowers that use mortgage brokers pay lower rates, and rates negotiated through brokers are less responsive to household characteristics. Fifth, rates are higher in more concentrated markets.
These results suggest that a number of factors are important in determining the prof-itability of borrowers to lenders. These factors include (a) Complementary services: Sav-ing/deposit, other loans, etc., (b) Lock-in incentive: Few consumers negotiate after 5 years. Large incentive to attract consumers buying expensive homes, and (c) Prepayment: Despite penalties, richer households are more likely to repay their mortgage early. The results also suggest that borrowers have important shopping and search incentives. The incentive to search depends on (a) the value of time (richer households have larger search costs), and (b) differentiation (loyal consumers pay more).
References
Allen, J., R. Clark, and J. F. Houde (2008). Market structure and the diffusion of e-commerce: Evidence from the retail banking industry. Bank of Canada Working Paper No. 2008-32.
Allen, J. and D. McVanel (2009). Price movements in the Canadian residential mortgage market. Bank of Canada Working Paper 2009-13.
Armstrong, M. (2008). Chapter 12: Price discrimination. Handbook of Antitrust Eco-nomics.
Armstrong, M. and J. Vickers (1993). Price discrimination, competition and regulation.
Journal of Industrial Economics 41, 335–359.
Bergstresser, D., J. M. Chalmers, and P. Tufano (2009). Assessing the costs and benefits of brokers in the mutual fund industry. The Review of Financial Studies 22, 4129–4156.
Berndt, A., B. Hollifield, and P. Sand˚as (2010). The role of mortgage brokers in the subprime crisis. NBER working paper 16175.
Breslaw, J., I. Irvine, and A. Rahman (1996). Instrument choice: The demand for mort-gages in Canada. Journal of Urban Economics 39, 282–302.
Cason, T. N., D. Friedman, and G. H. Milam (2003). Bargaining versus posted price competition in customer markets.International Journal of Industrial Organization 21, 223–251.
Courchane, M. J. and D. Nicerkson (1997). Discrimination resulting from overage prac-tices. Journal of Financial Services Research 11, 133–151.
Demyanyk, Y. and O. V. Hemert (2009). Understanding the subprime mortgage crisis. forthcoming Review of Financial Studies.
Duca, J. V. and S. S. Rosthenal (1994). Do mortgage rates vary based on households default characteristics? evidence on rate sorting and credit rationing. Journal of Real Estate Finance and Economics 8, 99–113.
Edelberg, W. (2006). Risk-based pricing of interest rates for consumer loans. Journal of Monetary Economics 53, 2283–2298.
Einav, L., M. Jenkins, and J. Levin (2009). The impact of information technology on consumer lending. working paper.
Engert, W. and C. Freedman (2003). Financial developments in Canada: Past trends and future challenges. Bank of Canada Review.
Goldberg, P. K. (1996). Dealer price discrimination in new car purchases: Evidence from the consumer expenditure survey.Journal of Political Economy 104(3), 622–654.
Hall, R. E. and S. Woodward (2010). Diagnosing consumer confusion and sub-optimal shopping effort: Theory and mortgage-market evidence. NBER working paper 16007.
Horta¸csu, A. and C. Syverson (2004). Product differentiation, search costs, and competi-tion in the mututal fund industry: A case study of S&P 500 index funds. Quarterly Journal of Economics, 403–456.
Keys, B. J., T. K. Mukherjee, A. Seru, and V. Vig (2010a). 620 FICO, Take II: Securiti-zation and screening in the subprime mortgage market. Mimeo.
Keys, B. J., T. K. Mukherjee, A. Seru, and V. Vig (2010b). Did securitization lead to lax screening? Evidence from subprime loans. The Quarterly Journal of Economics, 307–362.
Klemperer, P. (1995). Competition when consumers have switching costs: An overview with applications to industrial organization, macroeconomics, and international trade.
KPMG (2008). Canada mortgage bonds program evaluation. Audit and Evaluation Ser-vices - Final Report.
Lascelles, E. (2010). Market musings. TD Securities Economics Strategy.
Livshits, I., J. MacGee, and M. Tertilt (2009). Costly contracts and consumer credit. mimeo.
Riley, J. and R. Zeckhauser (1983). Optimal selling strategies: When to haggle, when to hold firm. The Quarterly Journal of Economics 98(2), 267–289.
Scott Morton, F., F. Zettelmeyer, and J. Silva-Risso (2003). Consumer information and discrimination: Does the internet affect the pricing of new cars to women and minori-ties? Quantitative Marketing and Economics 1, 65–92.
Stole, L. A. (2007).Chapter 34: Price Discrimination and Competition, Volume 3. Ams-terdam: Elsevier. Handbook of Industrial Organization.
Verboven, F. (2002). Quality-based price discrimination and tax incidence: Evidence from gasoline and diesel cars.The RAND Journal of Economics, 275–297.