University of Pisa
Department of Economics and Management
Master of Science in
Strategia, Management e Controllo
THESIS TITLE
Leveraged Buyouts (LBOs) in the Private Equity Industry: the
Role of Debt and Financial Structure as Drivers for the Value
Creation of the Fund’s Investors
CANDIDATE:
SUPERVISOR:
Stefano Spagnolo Prof. Antonio Corvino
Introduction ... vi
Part I – An Overview of Private Equity ... 11
1.1 What is Private Equity? ... 11
1.2 Brief History and Current Market Overview of LBOs ... 15
1.2.1 Before the 1980s ... 16
1.2.2 1980s: Leveraged Buyouts on the rise ... 16
1.2.3 1990s: the fall and rise (again) of the LBO market ... 17
1.2.4 2000-2007: LBOs booming, but bouncing off the crisis ... 17
1.2.5 2007-2015: LBO market gets back on its feet, ready to restart ... 18
1.2.6 Outlook of the Leveraged Buyout Market today ... 19
1.3 Leveraged Buyouts at work ... 24
1.3.1 Equity side ... 24
1.3.1.1 The main vehicle: the Private Equity Fund ... 24
1.3.1.2 What are GPs and LPs ... 26
1.3.1.3 Capital flows pattern: the J-Curve ... 31
1.3.1.4 GP-LPs contract (LPA): fees and “distribution waterfall” ... 32
1.3.1.5 GP-LPs agency costs ... 38
1.3.2 Debt side (hints) ... 40
1.4 Sources of Value Creation in LBOs and Role of Financial levers ... 40
1.4.1 Preliminary: agency theory aspects and “perfect targets” for LBOs ... 40
1.4.2 Sources of value: the traditional Kaplan’s model ... 44
1.4.3 Leverage as a source of value ... 48
1.4.4 The evolution of the Kaplan’s model ... 52
1.5 LBO performance: Costs and Returns ... 55
1.5.1 Costs of investing in LBOs ... 55
1.5.1.1 Risk ... 56
1.5.2 Returns of investing in LBOs ... 57
1.5.2.1 Absolute performance: IRR and multiples ... 57
1.5.2.2 Performance patterns at a fund level ... 58
1.5.2.3 Performance patterns at a general level ... 60
1.5.2.4 Money-weighted vs. time-weighted rates of returns ... 63
Part II – The Debt Side in Leveraged Buyouts ... 69
2.1 Preliminary aspects ... 69
2.2 The primary role of banks: leveraged loans ... 70
2.3 The LBOs Financing Package (1980 – mid-1990s) ... 73
2.3.1 Senior Debt ... 73
2.3.2 Subordinated Debt ... 76
2.3.2.1 The junk bond market explosion ... 77
2.3.3 1989: the end of an era? ... 81
2.4 The LBOs Financing Package (mid-1990s – 2007) ... 82
2.4.1 Senior Debt ... 83
2.4.1.1 The Advent of Institutional Investors ... 83
2.4.2 Subordinated Debt ... 85
2.4.3 Other Debt ... 86
2.4.4 Developments in buyout financing ... 86
2.5 Need more capital? The Structured Credit market, Securitization and Credit Derivatives ... 88
2.5.1 The usage of ABS in “Securitized” LBOs ... 90
2.5.2 “We created the investor”: investment banks’ CDOs ... 93
2.5.2.1 Background of Collateralized Debt Obligations ... 94
2.5.2.2 CDOs in the LBO market ... 98
Part III – Research Approach and Methods ... 103
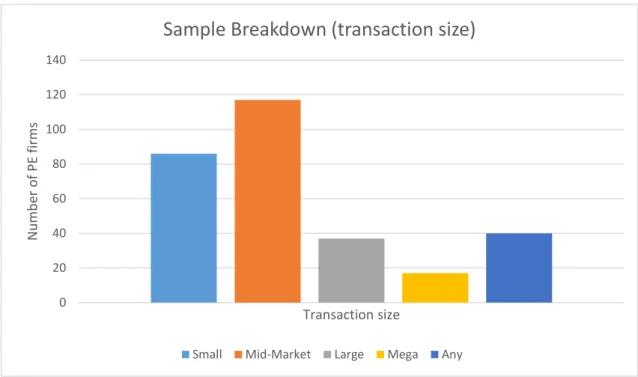
3.1 The Sample ... 104
3.2 The Survey ... 109
Part IV – Empirical Results ... 115
4.1 Descriptive Analysis ... 117
4.2 Conclusive remarks ... 142
4.2.1 After the crisis: Value creation or destruction? ... 143
4.2.2 The LBO financing package after 2007 ... 144
4.2.3 Other drivers of value creation ... 148
vi | P a g .
The modern Private Equity (PE) industry can be traced back to the early 1980s, when it started to gain popularity on an international scale. In particular, Leveraged Buyouts (henceforth, LBOs) have always played a substantial role in the overall PE industry, in terms of both the capital required for such transactions and the relevant impact that they have usually brought in the economy as a whole.
A typical LBO transaction entails a specialized PE firm taking over one or more companies (so-called “target companies”) through a relatively small level of equity and a meaningful amount of debt, that usually reaches as high as 80% of the entire financing package (hence the term “leveraged”). Once the target company is acquired, the PE firm and its management will have to drive value creation, to reimburse debt fully and to make a profit for the PE firm and its investors.
But what are specific levers by which a PE firm manages to create value in an LBO operation? Amongst other scholars, Kaplan argued that three main drivers ultimately lead to value creation in LBOs: operational engineering, governance engineering and financial engineering. While operational engineering requires putting a great focus on sustainable long-term growth, governance engineering relates to changes and practices adopted within the board of directors and the top management area once the target company gets acquired, in order to develop a brand new corporate strategy. Finally, financial engineering relates to leverage and the overall debt-financing package as a source of value creation.
So far, a great number of authoritative scholars have delivered substantial research concerning the role of the first two levers as drivers for the value creation process in LBOs. On the contrary, very few findings are nowadays available regarding the role of financial engineering in delivering value over years.
Therefore, I decided to fill this research gap by investigating how leverage and the debt-financing package evolved over time and their ability to drive value for the
vii | P a g .
PE firm and its investors, with particular regard to the aftermath of the 2007 financial crisis on the LBO market. My research question was set out as:
The role of private equity firms and banks in structuring the “debt side” of LBOs in Europe after the 2007 financial crisis, and possible implications for the Limited Partners’ value creation.
While the first part of my thesis is based on a literature review process and mainly concentrates on general aspects of the debt financing package and the evolution from the inception of the phenomenon in the 1980s, the last part comprehends an empirical investigation on how the debt component of LBOs has evolved after the financial crisis, and possible correlations with the renewed value creation process that has been marked out. In particular:
Part I includes general aspects of the private equity industry. It provides a brief history of the LBO market, the mechanics by which it actually operates, and it reports corroborated academic models of value creation for LBO operations.
Part II focuses specifically on the debt side of LBOs, investigating its evolution over time and explaining in detail financial instruments and tools used to reach high levels of debt.
Part III introduces the methodology that I used to carry out my research project. In particular, it describes the sample of PE firms that I selected and analyzes the survey that was elaborated and finally sent to such a sample. Part IV, at last, reports empirical results that were accurately processed by
viii | P a g .
As the final step of my academic path, this project is the result of much effort and commitment. Despite I have done all my best and put a lot of energies in doing it, this work would not have been possible without the support of some people that helped me follow through.
To begin with, I would like to thank all the executives and top managers of private equity firms that contributed to my research by responding to the survey that was sent to them. Among them, I owe special thanks to Dr. Mattana, who helped me more than once with his superior expertise in the leveraged buyout market, and that gave me precious advice for almost any aspect of this project.
I would also like to thank my supervisor, Professor Antonio Corvino, for his valuable knowledge and, last but not least, for his availability and patience in guiding me throughout this final path.
And most of all, I would like to deeply thank my family for having always supported me in everything I have done. I owe thanks to my parents, who have always been on my side and backed me up whenever I needed, and to my sister, whose presence is source of inspiration and joyousness. I would not be where I am without you.
11 | P a g .
Part I – An Overview of Private Equity
1.1 What is Private Equity?
“I like to define private equity firms as organizations that run governance that run businesses”
(Michael H. Jensen)
Private Equity (PE) is a relatively recent phenomenon that has been widely defined by academics, scholars and practitioners over time. Many definitions of this financial activity can be found on books, papers and academic articles, as well as those provided by authoritative associations worldwide that deal with this topic. Regardless of the variety and the number of these different explanations, Private Equity activity can be generally defined as the purchase of control equity stakes in unquoted companies that are characterized for high growth potential, with the aim of actively managing, thereby realizing value creation, and then reselling them on the market gaining as much as possible. More specifically, it is a medium to long-term investment that, by strengthening management expertise, delivering operational improvements and bringing in financial resources, leads the company to create value on a long-term perspective, which is then monetized by selling back the firm on the market.
Private Equity as an Alternative Investment asset class
Although put it in these terms Private Equity appears to be somewhat of a typical and not excessively sophisticated financial activity, it is by contrast encompassed within the alternative investments category, as shown even in the new report of the World Economic Forum1. In other words, financial investments can be easily
1 World Economic Forum (2015), Alternative Investments 2020 – An Introduction to Alternative Investments, available at:
12 | P a g .
divided into two macro categories, the first of them being “traditional investments”, which comprise typical investments in cash, stocks (private or public) and bonds (government or corporate), that is, asset classes with which investors are most familiar with and the easiest and most accessible to find on the markets. On the other side, the “alternative investments” category is made up of all the other and more sophisticated asset classes, which are often not even known by the majority of people without adequate financial expertise, such as commodities, real estate, even art and antiquities, as well as private equity, venture capital and hedge funds investments. Besides the mere asset class on which they are based on, alternative investments are usually characterized by illiquidity, long-term ranges and high risk that make them highly specialized and suitable only for a little portion of investors.
Private Equity categories
Private equity investments cannot be considered as a unique, single class. Indeed, it gathers many different subsets of very dissimilar investments that need to be separately analyzed to better understand this phenomenon. Specifically, the main classification splits private equity into different investment categories, each of them refers to a different stage of the life cycle of the company and requires capital for a specific purpose. Academics and practitioners have hitherto given different categorizations and taxonomies of the various types of investments to be collected below the private equity macro class, and, as easily predictable, several differences have emerged, especially between U.S. and European terminologies. With the clear objective of making things simpler, we will report here the most common and worldwide accepted stages that characterize the various private equity classes, highlighting their utilization nowadays. According to the British Private Equity & Venture Capital Association (BVCA)2, one of the most authoritative PE
http://www3.weforum.org/docs/WEF_Alternative_Investments_2020_An_Introduction_to_AI.pdf
(accessed December 2015)
2 BVCA (2012), A Guide To Private Equity, available at:
http://www.bvca.co.uk/Portals/0/library/Files/Website%20files/2012_0001_guide_to_private_equity.p df (accessed December 2015), pp. 16-17
13 | P a g .
association all over the world, there are different stages in which private equity investments can be divided into:
Seed, that implies a PE investment at the very beginning: in particular, a capital commitment is required to develop a business concept by drawing up the business plan and funding the initial R&D expenses to create the first prototype of the product;
Start-up, for businesses that are being set up, but need more funding to start producing the product commercially and develop marketing activities; Early Stages, for companies that have completed the product development
stage, but need more capital to start generating profits (it is worth noting that many authors, especially in the past, used to split this category into
first-stage, second-stage and third-stage);
Growth (or Expansion), for established companies that need additional capital to grow and expand;
Buyout, a large class which encompasses many other subsets of operations that often rely on a significant quantity of debt to be carried out (each category will be analyzed subsequently);
Bridge financing, for companies requiring capital to enter the public markets through an IPO within few months;
Turnaround, to rescue a company in a financial distress situation.
As mentioned earlier, some differences emerged between the U.S. and European terminologies, especially as far as venture capital investments are concerned. In particular, the European view used to distinguish Venture Capital (seed and start-up companies) from Private Equity (early-stages and expansion capital, as well as buyouts), whereas the American view used to consider Venture Capital as a subset (along with the buyout subset) of the whole Private Equity macro category. Both versions are reported in Figure 1.
14 | P a g .
Nowadays, according to the majority of national industry trade associations3, and
due to a standardization process, the U.S. classification is the most worldwide accepted and, therefore, it will be the one used throughout this thesis. One last thing that is worth noting (but not adopted here) is that, within the American version, many authors are accustomed to solely considering “growth capital” and “buyouts” as “private equity”, opposing de facto the private equity category (i.e., only growth capital and buyouts) to the venture capital category.
Leveraged buyout: definition and classification
As explained above, buyouts are overall considered as a subset of the Private Equity macro class, and they can be defined as the purchasing of the total or the majority of stocks in a company in order to obtain a significant portion of the equity ownership, taking it away from prior stockholders. Being it a wide definition of a typical buyout transaction, a Leveraged Buyout (henceforth, LBO) is when the purchase of a company is financed using a relatively small portion of equity and a
3 See, amongst others, BVCA (www.bvca.co.uk), AIFI (www.aifi.it), NVP (www.nvp.nl), and BVA (www.bva.be). Venture Capital Seed Start-up Private Equity Early stages Growth Buyout EUROPE PRIVATE EQUITY Buyout LBO MBO/MBI Venture Capital Seed Start-up Early stages U.S.
Figure 1 – Differences between Europe and U.S.
15 | P a g . meaningful amount of debt, which typically ranges from 60 to 90 percent of the total value. In particular, LBOs have played a very important role in the private equity industry since its inception and they can take a variety of forms, mainly depending on the subject that carries it out and on the purpose that leads him to such an operation. We can distinguish, in particular:
Institutional buyout, when an institutional investor (be it a venture capital or private equity firm, a bank and so forth) acquires the control of a company in order to increase its value and then dispose of it in some years; Management buyout (MBO), when internal managers decide to take over their own company, often because they think that they are capable of providing higher value to the firm (an institutional investor is in most cases involved in the ownership acquisition, using internal management as a prominent source for value creation);
Management buy-in (MBI), when external managers decide to take control of a business;
It is worth pointing out that this is certainly not a comprehensive list of all possible buyout configurations4, but includes only the most relevant types and broadly used,
and the most prone to be used alongside high levels of debt, within the private equity industry. Hence, for the purpose of this work, we will hereafter refer only to these three main categories.
1.2 Brief History and Current Market Overview of LBOs
Nowadays, Leveraged Buyouts fill a large part of the whole private equity industry, as it exhibits worldwide aggregate deal values in the order of hundreds of billions of dollars per year. As easily predictable, U.S.A. are the largest market, directly followed by Europe (with U.K. being the most important and active market), while the rest of the world holds negligible percentages, even though the Asian market has been displaying considerable growth in recent years.
4 By way of example, other possible configurations include Corporate buyouts, Workers buyout, Family buyout and Fiscal buyout.
16 | P a g .
That said, for a better understanding of today’s market of LBOs, a brief explanation of the history of these financial operations is going to be needed5.
1.2.1 Before the 1980s
LBOs as we know them today started to enter into popularity in the early 1980s, when this phenomenon attested rapid expansion as a direct and unavoidable consequence of the economic environment of prior years. Indeed, the “economic boom” occurred in the 1960s gave birth to a conglomeration process that led many companies to continuously grow their size by entering ever more businesses, and thereby creating enormous corporations that were very often inefficient and value-destructive. Conglomerates were thus made up of a variety of different and uncorrelated business units that were allowed to survive only by means of a strong liquidity capacity of the parent firm.
1.2.2 1980s: Leveraged Buyouts on the rise
It is in such a situation that leveraged buyouts started to be popular, strictly along with so-called “corporate raiders”: actually, these activities were often badly-judged, as they used to buy companies with undervalued assets just to close them down right after and sell the assets separately, making a profit on the difference. However, the highly-depreciated value whereby such operations were possible sheds much light on how those businesses were economically inefficient and useless, and make it natural to understand that LBOs were the natural consequence. As funds raised in the early 1980s started to display significant and tempting returns for its investors, ever more funds began to emerge, allured by such impressive yields. Furthermore, it spurred the issuance of high-yield bonds (so-called “junk bonds”) as investors rushed to enter such a profitable market, and the influx of capital over years seemed like it would have never arrested.
5 For a more detailed analysis, see Gilligan, J. and Wright, M. (2014), “Private Equity Demystified – an explanatory guide”, ICAEW Corporate Finance Faculty, London (UK), pp. 23-27
Kaplan, S.N. and Strömberg, P. (2009), “Leveraged Buyouts and Private Equity”, The Journal of Economic Perspectives, Vol. 23, No. 1, pp. 121-128
17 | P a g .
Kaplan6, in a subsequent paper, argued that the market was rapidly getting “overheated” and – as a consequence of that – the large majority of deals concluded in the 1985-89 period were not as good and profitable as transactions concluded in the earlier period, showing instead an increase in overpriced deals for companies that were not worth investing in.
The peak of the market was reached in 1989, with the symbolical buyout of the U.S. based conglomerate RJR Nabisco, for $23bn or thereabouts. In Europe, the largest buyout of that period was the one of Gateway Supermarkets for £2.2bn.
1.2.3 1990s: the fall and rise (again) of the LBO market
Right after reaching the peak in the late 1980s, in the early 1990s the market started to collapse – a massive wave of recent transactions defaulted and many of them ended in bankruptcy, and millions of investors (especially the ones who invested in junk bonds) lost their capital.
Although the depressed climate that was predominating in those years, however, the LBO market was not dead, it was just starting to recover. More observable deals (public-to-private transactions) had undoubtedly shrunk, as well as the overall number of completed deals and many smaller funds raised when the market was skyrocketing disappeared, but the leveraged buyout phenomenon had not ended. Private, unquoted companies and divisions suddenly became the most preferred targets. LBO firms began to specialize in one or more sectors becoming more industry-focused, as they revised their way of doing business, concentrating on strategy rather than mere liquidity and cash flows in order to pursue sustainable, long-term value. In short, they recognized errors made in the recent past, and they were trying not to perpetrate them for the future.
1.2.4 2000-2007: LBOs booming, but bouncing off the crisis
As a result of the imposing process of restructuring and deep reorganization put in place in the previous decade, the LBO market started to gradually rebound, and
6 Kaplan, S.N. and Stein, J.C. (1993), “The Evolution of Buyout Pricing and Financial Structure”, The Quarterly Journal of Economics, Vol. 108, No. 2
18 | P a g .
since the early 2000s leveraged buyouts’ relevance was increasing again. Globalization played an important role even within the LBO sector, as it was basically split in two segments: on the one hand, the largest LBO firms (most of them founded at the outset of the 1980s) had become ever bigger and they operated in an international context; on the other hand, smaller funds had specialized and invested in specific industries, focusing in particular on mid-market companies. Furthermore, the debt market had changed as well, mutating the roles of typical lenders and introducing new players alongside new ways of financing. The LBO market was rising again, reaching its top in 2006-07 when the bulk of committed capital reached impressive levels, but then the financial crisis emerged and the situation crashed once again. Banks preferred to hold cash rather than realize their typical business activity by lending it, so the huge amount of capital hitherto reached by private equity LBO funds, which strongly relied on debt to be deployed, could not be invested. Committed capital, de facto, was entangled within the fund, causing the LBO firm’s managers to charge annual fees to investors for capital that was unlikely to yield a return.
1.2.5 2007-2015: LBO market gets back on its feet, ready to restart
In the aftermath of the financial and economic crisis that occurred in 2007-08, the LBO market, as almost any other economic and financial activity, struggled to resist for the unavoidable fall of capital provided by those who, just little time before, were willing to invest in such operations.
Many private equity firms defaulted; others tried to get the best out of the crisis by purchasing strongly devalued companies in hopes of selling them when the markets will be rising again; still, others diversified their businesses, by entering kindred financial activities, usually within the alternative investment’s class, such as hedge funds and real estate funds.
However, for some years onwards, private equity and the leveraged buyout’s sector have started to slowly recover – and to gradually rise, once again. Both commitments and investments have recommenced to increase, year by year, and so far LBOs have seemed to be well rebounding. As a proof of that, it is worth
19 | P a g .
recalling that two of the biggest deals ever made were completed in 2013: the H.J. Heinz Company’s buyout by 3G Capital along with Berkshire Hathaway for $28bn, and the Dell Inc. purchase made by MSD Capital and Silver Lake for approximately $25bn.
1.2.6 Outlook of the Leveraged Buyout Market today
After the brief exposition of the overall history, we will now attempt to outline what exactly private equity – with particular regard, obviously, to the leveraged buyout sector – is nowadays, defining both the broad dimension of the market in terms of billions of dollars, and the major players that compete within this industry. As far as the market’s size is concerned, to evaluate how big actually this industry is, we can draw on the two broadest, internationally used measures, which are capital raised and capital invested by funds, year after year. For the purpose of this work, we will consider the 2009-2015 period, that is, the period right after the economic crisis occurred.
A great deal of relevant and reliable data concerning the market’s size is easily findable, be it on the most significant trade associations (for example, PEGCC and EVCA7), on dedicated databases such as Preqin and Burgiss, or on publications made by the biggest companies operating in the industry or in an industry-related context (e.g. financial advisory, investment banking).
To begin with, the U.S.A. are the global leading market, as it is the most considerable in a worldwide perspective both for raised and committed capital, and the most active in terms of number and volume of transactions. As we can see from the PEGCC website, which analyze the LBO American market’s size on a quarterly basis, in the U.S.A. fundraising levels have gradually increased over years, displaying an upward trend (Figure 2).
7 The Private Equity Growth Capital Council (PEGCC) and the European Private Equity and Venture Capital Association (EVCA) are the most authoritative trade associations respectively for the U.S.A. and Europe. For further information, visit www.pegcc.org and www.investeurope.eu
20 | P a g .
Figure 2 – source: Private Equity Growth Capital Council
Moreover, it is worth reporting that the total amount of committed capital (also called “dry powder”) from which funds’ managers can draw upon when investment opportunities are available, exhibits a value of $466bn in 2015.
Turning to the amount of capital invested by the U.S.A., Figure 3 exhibits a rather steady trend since year 2011, with a striking average of $100bn to $150bn of investments on a quarterly basis.
21 | P a g .
Figure 3 – source: Private Equity Growth Capital Council
Turning our attention to the second-leading worldwide market, that is, Europe, for a general overview of what actually the leveraged buyout market is, we can draw upon the annual PwC report8, which accurately describes the whole private equity
market across European countries. The graph of the European investment trend over the last six years is reported below (Figure 4).
Figure 4 –EU Investments (source: Private Equity Trend Report 2015)
8 PricewaterhouseCoopers (2015), “Private Equity Trend Report 2015”, available at:
https://www.pwc.lu/en/private-equity/docs/pwc-pe-private-equity-trend-report-2015.pdf (accessed December 2015)
22 | P a g .
As observable, the European buyout market is consistently smaller than its U.S. counterpart, both for value and number of deals. Even the fundraising situation, although not graphically shown, is reported to be gradually rising since 2009, displaying a positive trend and meaning a progressively renewed confidence in the private equity asset class.
Nevertheless, what strikingly emerges from both the American and the European market’s situations is the cyclicality that distinguishes the market itself. Specifically, as it also results from the little overview on the history of LBOs that we provided above, the leveraged buyout’s market is characterized by cycles that repeat again and again, and which are generally known as “boom and bust cycles” within the industry. As we will explore in detail in next paragraphs, this cyclicality is, among other things, due to initial above-average performances that lead to an “overheated” market that, in turn, inexorably lead to a subsequent bust period. Keeping our focus on the overall outlook of what the LBOs market is today, we will now conclude by providing an overview of the most important players worldwide. Such a market, as said earlier, is nowadays characterized by few, global firms that are often generalist, meaning that they operate in a broad range of financial sectors and work throughout the world, along with a greater number of smaller firms that are usually more industry-focused and operate within specific geographical areas. To give some insight on the size of these global firms and the bulk of capital they manage, Table 1 provides a summary of their worldwide relevance by ranking them on the basis of assets under management (AUM)9
globally run within their private equity business.
9 Assets Under Management (AUM) are generally referred to as the committed capital (dry powder) raised by funds plus the total unrealized value of ongoing investments.
23 | P a g .
Firm Location AUM ($bn)
KKR New York, USA 98.7
The Blackstone Group New York, USA 91
The Carlyle Group Washington, USA 65
TPG Capital Fort Worth, USA 60
Apollo Global Management New York, USA 38
Bain Capital Boston, USA 35
Table 1 – Worldwide biggest LBO firms classified by AUM (2015)
In order to assess the global dimension of the industry and the huge amounts managed by any of these international firms, many authoritative rankings are computed nowadays, one of those being the PEI 30010, which classifies the most
prominent PE firms by their last 5-year fundraising levels. Notwithstanding different metrics are oftentimes used, what is worth pointing out is that, besides the massive amounts of capital managed, the biggest players are all U.S.-based, as a proof of the American market being the most active and remarkable market for this financial industry.
10 PEI 300 is the annual ranking provided by the Private Equity International. For further information, visit https://www.privateequityinternational.com
24 | P a g .
1.3 Leveraged Buyouts at work
In this section, we will explore typical mechanics by which leveraged buyouts actually works. As such transactions carry out their operations by means of a large portion of debt and a smaller equity stake, we will split this section in two parts analyzing characteristics of both parties in deals. Starting with the “equity side”, we will provide a description of private equity Limited Partnerships and assess the role of LPs and GPs within this legal entity, namely, to see how PE and LBO firms manage to raise money from investors and, subsequently, how they invest it. We will then go on to investigate the relationship intervening among parties, examining the key features of the investors-LBO firm agreement, called LPA11. We will finally conclude by giving a few hints on the role of debt, since a thorough analysis will be postponed to Part II.
1.3.1 Equity side
Since LBO firms originally initiate leveraged buyout operations, these are required to provide the equity stake within the entire financial package. Hence, a somewhat detailed analysis of LBO firms’ main actors, internal relationships intervening among them and how these firms generally work is going to be needed.
1.3.1.1 The main vehicle: the Private Equity Fund
So far, we have talked generally about private equity and its different variants, providing an overview of the history of leveraged buyouts and trying to evaluate its overall market’s size in the world. We will now take a step forward and analyze operational mechanisms whereby private equity actually carries out its investments.
Although these are the basics of the industry, many scholars have offered a picture on the fundamentals of this industry, offering a view to understand how it
11 LPA stands for “Limited Partnership Agreement” and it can be referred to as the official contract laying down rights and responsibilities among parties within the Limited Partnership legal model.
25 | P a g .
practically operates12. Private equity firms (and thus, LBO firms as well) raise money by means of a fund, which typically has a fixed life of ten years, extensible to an additional two-year period should particular investment’s conditions occur (“ten plus two” structure). Moreover, they take the form of closed-end funds13 in
which a limited number of investors is admitted, with large portions of capital, and are characterized by illiquidity, meaning that withdrawals are not permitted once capital is committed to the fund.
That said, as far as the legal structure is concerned, funds are usually separate business entities from the parent LBO firm, and in most cases they take the form of a private (i.e. unquoted) Limited Partnership14, in which General Partners (GPs) and Limited Partners (LPs) coexist. Specifically, within such a structure LPs are outside investors who provide and commit capital to the fund, whereas GPs are the managers, associated with the private equity firm, whose main task is to run the fund by gradually deploying capital into specific companies, so-called portfolio companies, and thereby yielding a return by the end of the fund’s life. A schematic illustration of the fund’s basic functioning is provided in Figure 5.
12 Fenn, G.W., Liang, N. and Prowse, S. (1995), “The Economics of the Private Equity Market”, available at: http://www.federalreserve.gov/pubs/staffstudies/1990-99/ss168.pdf (accessed December 2015) Kaplan, S.N. and Strömberg, P (2009), “Leveraged Buyouts and Private Equity”, The Journal of Economic Perspectives, Vol. 23, No. 1, pp. 123-124
Phalippou, L. and Gottschalg, O. (2009), “The Performance of Private Equity Funds”, The Review of Financial Studies, Vol. 22, No. 4, pp. 1750-1751
13 Closed-end funds raise a fixed amount of capital by issuing shares that are not redeemable until the end of the fund’s life, so that investors can subsequently cash out their shares only by selling to other investors. Another hallmark is that, once the stated amount of capital is raised, no more shares can be issued afterwards (hence the locution “closed-end”).
By contrast, hedge funds usually take the form of open-end funds, although with several constraints that make them an in-between among private equity funds and mutual funds.
14 Although the large majority of private equity investments are carried out with the traditional Limited Partnership model (private funds), public private equity also exists, taking the form of quoted trusts in which all types of investors are admitted, without any kind of constraints and with the possibility to trade their shares in the secondary markets. The main purpose is to allow smaller investors to take part in private equity investments, as they would not have such a possibility within the customary form of the L.P. For further information, visit the trade association’s website at http://www.lpeq.com/
26 | P a g .
Figure 5 – Private Equity fund’s mechanics
Being that a general and somewhat simplified picture of a typical private equity fund’s structure, commonly valid for all investments’ stages, within the leveraged buyout sector things are usually more complicated, as banks and other providers of debt must be considered. In particular, debt financing is strictly alongside equity financing (i.e. the private equity fund), where the latter typically holds a littler part. In addition, unlike other private equity’s investments, in leveraged buyouts’ transactions the fund does not directly invest in portfolio’s companies: rather, it creates a special purpose vehicle15 at first, in which financial resource stemming
from both equity (the fund) and debt (banks and other lenders) will flow, in order to acquire the total control, or at least the majority of the target’s stakes.
1.3.1.2 What are GPs and LPs
Notwithstanding GPs and LPs have already been introduced in the previous paragraph, we will now provide a more detailed profile of such figures within the fund’s perspective.
15 In LBOs, a Special Purpose Vehicle (SPV), also called Newco, is a legal entity created by the parent firm with the specific aim of buying out a company. Nevertheless, still within the LBO context, SPVs are widely used for other purposes as well, such as separating high-risk projects from the firm, and in financial engineering and securitization’s operations carried out by banks, as we will see in next sections.
Private Equity Fund (L.P.)
General Partner (GP) Limited Partners (LPs)
Company A Company B Company C Company D
= Management = Investment
27 | P a g .
GPs, or the General Partners, are the managers entitled to raise and then run the fund on behalf of investors, aiming at obtaining a profit to be subsequently delivered to them. In particular, being GPs are a group of managers within the LBO firm, legally speaking the latter can be considered as the sole, broad General Partner. Hence, typical GPs in an LBO transaction are firms like Blackstone, KKR or Apollo Global Management, which firstly raise money for the fund and then manage it in order to have a positive return for investors.
Turning to LPs, Limited Partners are simply the investors who provide capital to the fund. Specifically, once they commit a given amount of capital to the fund that will be run by the GPs, neither they are allowed to call back any part of the capital committed until the end of the fund’s life, since the fund is illiquid by nature, nor they have any possibility to interfere in the investment process.
However, although LPs are all encompassed within such a broad category, investors’ classes are very different one another, each of them having different strategies and purposes for investing in private equity. Meaningful research has hitherto been done relating to this issue, so that nowadays both different classes of investors and the sets of objectives they aim to pursue are clear enough to categorize LPs within distinct groups.
Hence, we will start by giving some insight on what are the typical objectives that characterize various investors, thereby shedding light on reasons why they actually allocate their money into private equity; then, we will provide a brief overview of each type of investor separately, highlighting the categories that are more active in the leveraged buyout sector as well. In particular, on the basis of the objectives set out by different kinds of investors, we may classify16:
16 Such a classification was originally made by the WEF; see
World Economic Forum (2015), Alternative Investments 2020 – An Introduction to Alternative Investments, available at:
http://www3.weforum.org/docs/WEF_Alternative_Investments_2020_An_Introduction_to_AI.pdf
(accessed December 2015), pp. 18-20; Consistently with the WEF, see also BVCA:
BVCA (2015), Examining Private Equity's Place In investors' Portfolio, available at:
http://www.bvca.co.uk/Portals/0/library/documents/Guide%20to%20Private%20Equity's%20Place/BVC A%20Guide%20to%20Examining%20Private%20Equity%E2%80%99s%20Place%20in%20Investors%E2%8 0%99%20Portfolios.pdf (accessed December 2015), pp. 6-7
28 | P a g .
Long-term sight, which encompasses investors whose main purpose is to increase their capital over a very long-term horizon, usually more than 15-20 years. Within the private equity scope, they are allured by above-average returns, partly due to the illiquidity premium;
Liability driven, when investors’ main objective is to accrue their capital over a long-term horizon, but they have to deal with regular outflows of cash on a short-term basis, thus they appreciate both the higher returns and the possibility of steady cash flows provided by such investments;
Diversification driven, when investors mainly aim at diversifying their portfolio as a reason to invest in private equity.
Being these the most frequent reasons for investing in the overall private equity’s asset class, we will now turn to concentrate on various investors’ categories, focusing on which are most involved in leveraged buyouts, specifically.
Both academics17 and practitioners’ trade associations have so far made a great
deal of research with regard to this issue, thus we will draw on such findings as a whole in outlining what kind of investors are more attracted by LBOs within the private equity industry. In particular, we can distinguish:
Pension funds, whether they are public or private (corporate pension funds), are amongst the most influential and active actors within the whole LP category, as they have heavily invested in private equity since its inception in the early 1980s, backing it with increasingly higher quotas of capital. They have solely financial purposes, aiming at high returns to grow their capital over time;
17 Fenn, G.W., Liang, N. and Prowse, S. (1995), “The Economics of the Private Equity Market”, available at: http://www.federalreserve.gov/pubs/staffstudies/1990-99/ss168.pdf (accessed December 2015), pp. 45-51
Lerner, J., Schoar, A. and Wongsunwai, W. (2007), “Smart Institutions, Foolish Choices: the Limited Partner Performance Puzzle”, Journal of Finance, Vol. 62, No. 2
29 | P a g .
Sovereign wealth funds18, which are funds managed on behalf of public institutions, have shown a rising interest in private equity activities, and nowadays they hold a large part of the total fund’s shares;
Financial institutions, broad category encompassing commercial and investment banks, advisors, insurance companies, and asset managers, whose aims can vary from higher returns to diversification purposes; Endowments and foundations, although somewhat more active in the
venture capital sector, represent a rather large fraction of the total capital raised;
Family offices and high-net worth individuals (wealth management)19, though they were relevant investors of private equity, their importance have decreased over years, overwhelmed by the impressive amounts of capital committed by pension funds; however, on a relative basis, they allocate the highest percentage of their total portfolio in private equity, compared to other investors. They are mainly allured by above-average yields, even though they have diversification purposes as well;
Funds of funds, which are mainly used by investors who do not want to directly invest into PE funds, especially because they want to mitigate risk associated with such investments. They have a strong relevance within the total fund, with sharing similar to that of sovereign wealth funds.
Others, a residual category that comprises less relevant types of private equity investors who allocate trifling shares of capital over the total fundraising process. These include corporate investors and academic institutions.
A summary of various LPs’ classes linked to their main investment’s philosophy is provided in Table 2.
18 A sovereign wealth fund, as perceivable from the expression itself, is a fund raised with excess financial resources of a government, and managed on behalf of it. These funds are usually common in countries in which there is abundance of scarce resources, such as oil and gold.
19 A family office is typically an advisory firm that deals with wealth management, where main clients are high-net worth individuals who want tailor-made investment solutions for their capital, in order to accrue its value over years. Family offices are similar, but not equal to asset managers.
30 | P a g .
Investment’s philosophy
Main objectives Investors (LPs)
Long-term sight I. High returns
(accrue capital over time) o Sovereign funds o Endowments and foundations o Wealth management
Liability driven I. High returns
II. Steady cash flows
o Pension funds
Diversification driven I. Diversification
II. High returns
o Financial
institutions (such as banks and advisors)
Table 2 – source: World Economic Forum
To conclude, Table 3 reports every single type of Limited Partners who invested their capital in European leveraged buyouts over the 2010-2014 period, with their relative percentage of committed capital, basing on the EVCA Yearbook20.
Investor type 2010 2011 2012 2013 2014 Pension Funds 18.5 24.5 26.9 38.0 29.7 Funds of Funds 13.4 19.1 17.7 10.7 11.0 Banks 7.3 7.8 4.0 2.1 2.8 Insurance Companies 6.5 6.8 8.0 9.7 8.9 Private Individuals 3.0 5.7 3.6 3.7 2.7 Family Offices 10.7 4.1 3.9 2.9 5.0 Sovereign Wealth Funds 1.8 14.0 11.2 12.7 7.8 Government Agencies 4.4 5.0 3.0 1.2 4.1 Other Asset Managers 4.7 2.4 7.0 4.8 3.6
Endowments and Foundations 0.7 3.5 2.0 3.0 5.2 Corporate Investors 1.0 1.9 0.7 1.3 1.4 Academic Institutions 0.1 0.4 0.8 0.0 0.1 Capital Markets 3.0 0.3 1.2 1.1 0.3 Others 25.0 4.4 10.1 8.9 17.5 Total 100.0 100.0 100.0 100.0 100.0
Table 3 – Limited Partners commitment to LBO funds (source: EVCA Yearbook)
20 The file can be downloaded at
31 | P a g .
1.3.1.3 Capital flows pattern: the J-Curve
After the in-depth analysis of both the legal structure of a fund and the main parties involved in, we will now turn to expose the typical cash flows patterns of a private equity fund, namely, how capital is practically managed one it is committed to the fund. First of all, since confusion may exist, it is worthwhile to point out that committed capital (i.e. capital provided by investors to the fund) is not a synonym for capital invested. As a matter of fact, commitment of capital does not imply any immediate money transfer to the fund from LPs, as the investment process is lengthy and may take several years before it is completed. Hence, once capital is committed to the fund, GPs will start searching out for profitable investments, and they will require investors for a part of the capital committed (making a capital call) on a continuous basis every time they find an investment opportunity, and until commitments are fully deployed. Several authors have made research on how many years does this process typically take to be finished. Lyungqvist and Richardson21 found that, from the date the fund’s activity begins, 56% of
committed capital is invested by the end of the third year and 93% by the tenth year (meaning that a little portion of the capital is likely not to be invested). Similarly, Kaserer and Diller22 found that approximately 23% of capital is invested
at inception, whereas 60% of total commitments are deployed within three years. Likewise, returns to investors in the form of cash outflows (distributions) are typically not delivered at the end of the fund’s life, all at once. Instead, GPs usually return profits to investors on an ongoing basis, starting several years after the beginning of the fund’s activity and, more specifically, when investments are mature and ready to be divested and cashed in, realizing the yield. The aforementioned authors, in their papers, found an average time of 6-7 years for
21 Lyungqvist, A. and Richardson, M. (2003), “The Cash Flow, Return and Risk Characteristics of Private Equity”, available at: http://archive.nyu.edu/bitstream/2451/26715/2/S-CG-03-01.pdf (accessed January 2016)
22 Kaserer, C. and Diller, C. (2004), “European Private Equity Funds – a Cash Flow Based Performance Analysis”, available at: http://papers.ssrn.com/sol3/papers.cfm?abstract_id=547142 (accessed January 2016)
32 | P a g .
returns to be accrued and subsequently delivered to investors, since the fund starts its activity.
That said, it is simply comprehensible that movements between capital inflows (i.e. capital calls) and capital outflows (i.e. distributions) are graphically representable as in Figure 7.
Figure 6 – the J-Curve representation for capital movements
One caveat that must be kept in mind relates to the fact that, although the J-Curve can usefully represent the model whereby capital flows occur in and out of the fund, it must not be mixed up with the performance-related J-Curve (which describes the IRR generation over the fund’s life) that will be analyzed in next paragraphs.
1.3.1.4 GP-LPs contract (LPA): fees and “distribution waterfall”
Fees are one of the most prominent parts within the contractual relationship intervening between the GP and LPs, since they represent the reward due to the General Partner (i.e. the LBO firm) as the manager of the fund. Overall, there exist two main categories of fees (management fees and carried interest) that are typically embedded in all private equity’s contracts; nonetheless, other less
-60 -40 -20 0 20 40 60 80 1 2 3 4 5 6 7 8 9 10 11 12 Cap ita l fl o w s
Fund's life (years)
J-Curve representation (Capital in/outflows)
33 | P a g .
common types also exist, and we will only refer to the most relevant ones in a leveraged buyout’s scope.
Broadly speaking, the large majority of existing funds have adopted and still adopt the so-called 2/20/1 structure, where “2” is the percentage usually requested on an annual basis for management fees, “20” is the typical percentage of carried interest and “1” is the percentage share held by the GP in the total fund’s capital23.
Management Fees
As one of the two aforementioned primary fees, management fee are fixed fees that LPs have to pay out to the GP every year of the fund’s life, and they can be calculated on either committed capital or net-invested capital, depending on the contractual terms. This kind of fee is meant to cover the operational costs of managing the fund, as well as to pay salaries of the GP’s partners. Although the most common management fees’ percentages are fixed at an average of 2%, several structures can be set out (in ascending order of sophistication):
a) A constant percentage of the committed capital (e.g. 2%) to be maintained for the whole life of the fund;
b) A “decreasing fee” schedule, in which the initial percentage set out gets gradually reduced (e.g. by 25 basis points each year), either on an immediate basis or after a certain period of time;
c) A constant percentage over the entire life’s fund but with a switch from the basis upon which fees are calculated (usually from committed to invested capital);
23 The following analysis draws on the works of authoritative scholars, revisited accurately:
Metrick, A., and Yasuda, A. (2010), “The Economics of Private Equity”, Review of Financial Studies, Vol. 23, No. 6
Robinson, D.T. and Sensoy, B.A. (2013), “Do Private Equity Managers Earn Their Fees? Compensation, Ownership and Cash Flow Performance”, Review of Financial Studies, Vol. 26, No. 11
Gilligan, J. and Wright, M. (2014), “Private Equity Demystified – an explanatory guide”, ICAEW Corporate Finance Faculty, London (UK)
34 | P a g .
d) A decreasing fee schedule with switch in the calculation basis, in which a gradually lower percentage is set out, associated with a shift from committed to net-invested capital.
It is worth observing that, holding everything else equal, more complex structures are usually associated with lower costs for investors, both because of the decreasing percentages applied and because the net-invested capital basis is smaller than its counterpart. Moreover, as easily perceivable, more complex models are generally applied by larger funds, that can afford worse conditions on a relative basis, relying on their size to accrue impressively higher amounts on an absolute basis.
However, their fixed nature makes them unrelated to performance, and what is more, they are found to be increasing when market’s conditions and fundraising processes are favorable, gradually substituting variable fees as funds get larger24.
In other words, management fees may be considered as a risk-free return for GPs, which cash them whether they yield profits for investors or they make miserable investments that lead to losses, and such an issue is nowadays matter of debate among scholars, considering it one of the agency costs intervening in the GP-LPs relationship that is reported below.
Carried Interest
Carried interest, also called “carry” or “performance fee”, is the second inevitable fee findable in any fund’s contract. As opposed to its fixed counterpart, carried interest is a performance-based variable fee, which takes the form of a percentage to be retained by GPs over profits consequently to successful divestments (exits).
24 Notwithstanding the fact that management fees rise along with funds’ size, the authors (Robinson and Sensoy) argue that net-of-fees performance is not affected by such additional costs, meaning that performances of larger funds more than compensate the fee’s increase. According to the authors, who support an efficient bargaining thesis between GPs and LPs, this is due to the capability of GPs to exploit favorable opportunities and their superior skills and expertise that permit them to outperform. These findings are in stark contrast to the situation in mutual funds, in which net-of-fees performance are strongly and negatively related to increases in management fees.
35 | P a g .
Hence, GPs will start to collect these fees only several years on to the date the fund began its activity.
In particular, every time the GP exits one or more investments, it will compute the realized profit over the basis set out in the LPA (as usual, either committed capital or net-invested capital), setting aside its carried interest’s percentage (in most cases 20%) and paying back the remainder to investors as their own yield. We have to point out that, reasonably, this is a somewhat simplified explanation as in practice things are far more complicated: we are mainly referring to the “distribution waterfall” that will be comprehensively analyzed subsequently in this section. As mentioned above, being carried interest a variable fee, GPs tend to substitute it with fixed management fees as funds grow in size, thus showing severe predilection for a secure fixed-income in place of performance-based rewards. Nevertheless, in their paper Robinson and Sensoy argued that larger funds are the most likely to witness the highest carried interest, implying that both skilled GPs manage to raise higher funds and they are more willing to link their remuneration to performance, as they are confident of their expertise and abilities. Indeed, unlike management fees, carried interest are positively related to performance, meaning that the higher the performance GPs expect to realize, the higher the carried interest that they will charge to investors.
Other fees
Being management fees and carried interest the most common fees charged to investors in any contract across every subsector of the private equity industry, we will now turn to signal another two fees that, conversely, are mainly used within the buyout sector, namely, transaction fee and monitoring fees. The main hallmarks characterizing them, as opposed to the most common fees, are that they are charged to portfolio’s companies rather than investors, and they are subsequently shared between GP and LPs.
A transaction fee is a one-time fee that private equity (LBO) firms charge to a company when buying it. Technically speaking, the LBO firm actually charge such a fee to its SPV, which is aimed at purchasing the portfolio’s company, when it
36 | P a g .
buys out the target, and it is commonly encompassed within the purchase’s price. The rationale of the transaction fee is to cover unspecified financial advisory costs borne by the GP in completing the deal, and it usually ranges from 1% to 2% of the total transaction value. By nature, the transactions fee can be deemed as a fixed fee.
By contrast, monitoring fees are charged on a yearly basis because of time and effort spent by the GP in controlling its investment. They are performance-based fees, as they are calculated as a percentage over EBITDA value, swinging between 1% and 5% of such an economic measure. This wide range hinges on companies’ size: generally, the smaller the target, the higher the EBITDA’s percentage applied, and vice versa.
The “distribution waterfall”
The distribution waterfall, as the name itself suggests, is the arrangement set out within the contract whereby the GP and LPs decide to distribute capital when investments are gradually exited: in other words, it is the agreement included in the LPA laying down how capital must be returned to the parties (GP-LPs) when exiting various investments. As easily perceivable, this process involves the GP’s ownership stake proceeds and carried interest distributions, whereas it does not consider management fees as they are retained on an annual basis and are unrelated to profits. An important caveat is related to the fact that two different versions actually exist: the European (“whole fund”) and the American (“deal-by-deal”) distribution waterfalls. For the purposes of this work, we will not investigate nuances of both types, but we will consider solely the typical structure of the European variant. Indeed, it is the most preferred from an investor perspective since it benefits LPs more than the other, and as a result, it has been outclassing the American version in recent times, becoming the predominant type25.
25 The “deal-by-deal” American waterfall considers each investment separately from others; in so doing, the GP is advantaged in gaining profits earlier (investments’ losses do not have to be offset by higher returns in other profitable investments!), and LPs are thus impaired. Being things so, a claw-back provision is often included within the agreement. By contrast, the European waterfall considers all investments in a fund perspective, therefore being fairer for investors.
37 | P a g .
Specifically, the distribution waterfall is a four-phase process that starts concurrently with companies’ divestments, in which each phase must be fulfilled before the next enters into practice26:
I. Recovery phase: in this phase, all proceeds need to be returned to investors until the whole committed capital’s amount initially raised is reached; II. Hurdle phase: once committed capital is totally returned, investors are
entitled to receive, with priority, a preferred return (hurdle rate) that is typically set out at 8% of realized profits, before the GP can cash in any return27;
III. Catch-up phase: after yielding a common 8% preferred return to investors, the GP can now receive its first carried interest quota. In particular, the agreement entitles the GP to get any subsequent capital distribution until a 20%-profit over the 100%28 of the total preferred return received by
investors in advance;
IV. Carried interest phase: after the catch-up provision is wholly fulfilled, all of the subsequent proceeds will be equally distributed on a (typical) 80-20 basis (80% to LPs, 20% to GP).
26 A “phase zero” may be referred to as ongoing incomes flowing to the GP as a consequence of its 1% stake into the fund.
27 Multi-hurdle waterfalls are also possible, by setting up several hurdle rates in which different percentages are allocated respectively to the GP and LPs.
28 Slightly lower quotas are often applied, such as 80% of the preferred return received by investors. Figure 7 – the distribution waterfall at a glance
HURDLE RATE COMMITTED CAPITAL REPAYMENT (phase 1) PREFERRED RETURN (phase 2) CATCH-UP PERIOD (phase 3) CARRIED INTEREST TO LPs (80%) GP STAKE’S INCOMES AND TO GP (20%) (phase 4) = distributions to GP = distributions to LPs
38 | P a g .
Figure 8 illustrates a typical distribution waterfall, including preliminary and proceeding incomes (such as dividends) due to the GP as a shareholder of the fund, and it goes on describing typical phases of the process as they occur.
1.3.1.5 GP-LPs agency costs
Notwithstanding the Agency Theory and its implications will be better explained in next paragraphs when talking about the principal-agent relationship between the LBO firm (by means of the fund) and portfolio companies, there is here a need to make some hints on the parallel principal-agent relationship between GPs and LPs. Figure 9 tries to exemplify this twofold issue.
Herein, we will restrict the context to the first issue, outlining possible agency costs stemming from the contract between the GP and LPs (1), and postponing a comprehensive analysis of agency problems with portfolio companies (2) in subsequent sections.
However, before going on to address the problem, a brief explanation is going to be needed. In essence, agency theory can be referred to as the relationship intervening between the principal (typically shareholders) and the agent (mostly executives and the top management team). In particular, the principal is the party who engages the agent to provide a service on its behalf, yet the latter has an incentive to undertake somewhat risky actions that are not in the principal’s
Agency problems (2) Agency problems (1) Fund LPs Portfolio companies GP
39 | P a g .
interest. Hence, such a theory analyzes both problems and feasible solutions to this matter.
Within a GP-LPs perspective, agency frictions that have been detected refer to29:
i. The catch-up provision set out in the LPA as part of the distribution waterfall. Indeed, once the hurdle rate is reached and the preferred return has wholly been delivered to investors, the GP might have more of an incentive to accelerate distributions, as subsequent returns will be fully retained until the catch-up phase is fulfilled.
ii. The basis upon which fees are calculated. In fact, more and more GPs tend nowadays to switch from a “committed capital basis” to a “net-invested capital basis”, since it is more favorable for investors, but it entails some downsides as well. In particular, a net-invested capital basis might coax GPs into keeping so-called “zombie investments”, namely, investments that have
low or no return at all, but preserved only with the aim of not reducing the calculation basis and, thereby, fees.
iii. Rising management fees as funds grow their size. As previously analyzed when describing fees, we reported a tendency to heighten fixed-income fees in connection with larger funds raised. This may be seen as an ever poorer incentive for the GP to outperform, as fixed fees are unrelated to performance and the fund’s managers might be more prone to relax, impairing investors interests.
iv. The low ownership stake of the GP into the fund. Given a typical 1% share of the overall fund’s capital, many scholars have raised the question of whether such a tiny percentage may not be sufficient to spur fund’s managers into maximizing value30.
29 For a further analysis of these agency frictions, see
Robinson, D.T. and Sensoy, B.A. (2013), “Do Private Equity Managers Earn Their Fees? Compensation, Ownership and Cash Flow Performance”, Review of Financial Studies, Vol. 26, No. 11
30 As regards iii. and iv., Robinson and Sensoy found no evidence of poorer performance due to the rise of fixed-income fees or to a low stake. Yet, other authors have provided different results in their papers and the issue is still matter of debate among scholars.
40 | P a g .
1.3.2 Debt side (hints)
Debt is the largest part of the overall financial package in a leveraged buyout transaction, and as we will see in following paragraphs, it is an essential driver for creating value. Its incidence covers 60 to 90 percent of the whole target’s value, and its composition and evolution, as well as in-depth analysis of financial instruments used and the ever-stronger usage of derivatives deserve a special consideration in a separated part of this work. For this reason, we will set aside and appropriately discuss debt in Part II.
1.4 Sources of Value Creation in LBOs and Role of Financial levers
In this section, we will shed light on typical sources of value creation in leveraged buyouts, relying on past and more recent literature that has dealt with this matter. It is important to note that, even though we will address value creation on a portfolio company perspective in this section, it is necessary as it is closely tied to consequent performances subsequently delivered to investors (LPs) and analyzed in following paragraphs. In particular, we will begin by observing the most common factors that allowed the origination of the LBO phenomenon, and we will go on to extrapolate from the most authoritative academic works what are the typical levers on which LBOs have relied on to achieve value creation, as well as their adjustment over time. After that, we will specifically concentrate on finance as a source of value creation, introducing a cost-benefit analysis of debt based on a thorough review of existent literature and related to both corporate governance and merely financial aspects. Finally, we will conclude by revising the traditional value-creation model formerly seen analyzing how sources, and specifically finance-related drivers, have evolved over years, in order to have the most up-to-date model that best fits current times.
1.4.1 Preliminary: agency theory aspects and “perfect targets” for LBOs Before illustrating what are the classic drivers leading to value creation according to academic research, it is worthwhile to briefly report what factors most implied