SOCIAL SCIENCE WITH SOCIAL MEDIA
A Dissertation
Presented to the Faculty of the Graduate School of Cornell University
In Partial Fulfillment of the Requirements for the Degree of Doctor of Philosophy
by
Scott Andrew Golder May 2017
SOCIAL SCIENCE WITH SOCIAL MEDIA
Scott Andrew Golder, Ph. D. Cornell University 2017
Over the past twenty-five years, electronic communication has matured from being a niche social activity mainly enjoyed by academics and engineers, to an important enabler of the daily activities of a demographically diverse population of hundreds of millions of people worldwide, augmenting, complementing, or even replacing offline methods of socializing, dating, shopping, learning, working, and engaging in political activities.
While this transition is in itself interesting, it also has significant implications for the social and behavioral sciences. The daily lives of people worldwide are now captured in detailed, event-level recordings that are time-stamped and geo-stamped, providing researchers with a new kind of observational data, enabling them to address fundamental questions about social identity, status, conflict, cooperation, collective action, and diffusion. This dissertation explores these implications, with a critical review and two empirical explorations.
Chapter one reviews existing literature and examines the methodological challenges that arise along with the opportunity provided by online behavioral data, including generalizing to the offline world, protecting privacy, and solving the logistical challenges posed by data at a larger scale than social and behavioral
scientists typically use.
Chapter two is an investigation into measuring the rhythms people experience in their mood over the course of the day, week and year. By analyzing the text of hundreds of millions of timestamped messages from the social media service Twitter, I show that there is a consistent shape to people’s moods over time, including boosts in positivity in the morning and on the weekend, and that seasonal variation tracks changes in daylength.
Finally, chapter three examines how moral judgments about personal debt affect decisions by lenders about who to lend to and at what rate. By analyzing the text portion of loan applications in the microlending service Prosper.com, I show that, though traditional economic characteristics like credit score dominate, non-economic characteristics also help predict lending outcomes and have effects that are mediated by the creditworthiness of the applicant.
iii
BIOGRAPHICAL SKETCH
Scott A. Golder was born in 1980 in Boston, Massachusetts and lived in Massachusetts continuously through his undergraduate and early graduate studies. From 1999 to 2003, Golder attended Harvard College, from which he graduated
magna cum laude in Linguistics with a related field in Computer Science. While an undergraduate, he co-created the Harvard Dialect Survey, an online linguistic data collection project that was later featured in the New York Times and was its most-read article of 2013.1,2 From 2003 to 2005, Golder attended the Massachusetts Institute of Technology, completing an M.A. in Media Arts and Sciences at the Media Laboratory. Golder has periodically worked in industry during his time as a graduate student. During his three years as a research scientist at Hewlett Packard Labs (2005-2008) in Palo Alto, California, Golder conducted among the first published studies of Facebook. He has also been a summer graduate intern at IBM Research, Microsoft Research New England, and Google.
Golder arrived at Cornell University in 2008 to pursue a Ph.D. in Sociology. He began a leave of absence in 2012 in order to pursue opportunities in industry, including working on a software startup, before completing his Ph.D. in 2017. He presently resides in Columbia, Maryland.
1http://www.nytimes.com/interactive/2013/12/20/sunday-review/dialect-quiz-map.html
2
v
ACKNOWLEDGMENTS
First, I would like to thank my advisor and committee chair, Professor Michael Macy. Michael has been a consistent source of insights and enthusiasm throughout my time at Cornell, and my work has benefited from his guidance greatly. Our collaborations have been both productive and enjoyable, and I am grateful for his encouragement to seek impactful outlets in which to share them.
I would like to thank my committee members, Professor Victor Nee and Professor Jon Kleinberg. Victor kindly and generously provided several semesters of support and office space, enabling me to focus on my research, as well as untold hours of valuable and wide-ranging conversations. Jon’s work has long been an inspirational example of how formal approaches can enlighten our understanding of social behavior; likewise, his advice and feedback have been valuable and appreciated. I could not have chosen a better intellectual home than Cornell Sociology. An engaging community in which to learn and study, the department has also been supportive in accommodating my multi-year leave of absence, enabling me to both complete my graduation requirements and also pursue opportunities in industry.
Finally, I would like to thank my parents, Caroline and Stuart Golder, and my wife, Dr. Angie Boyce, for all of their support. My early-morning writing sessions have been possible only because Angie took on the bulk of the responsibility of getting our son Simon up, fed and off to daycare. Post-dissertation, I’m looking forward to having breakfast with them again.
vii
TABLE OF CONTENTS
Biographical Sketch iii
Acknowledgments v
Table of Contents vii
List of Figures ix
List of Tables xi
Introduction 1
Chapter 1: Digital Footprints: Opportunities and Challenges for Online Social Research
9
Chapter 2: Diurnal and Seasonal Mood Tracks Work, Sleep and Daylength Across Diverse Cultures
49
Chapter 3: Debt and Credit in an Online Microlending Market 79
ix
LIST OF FIGURES
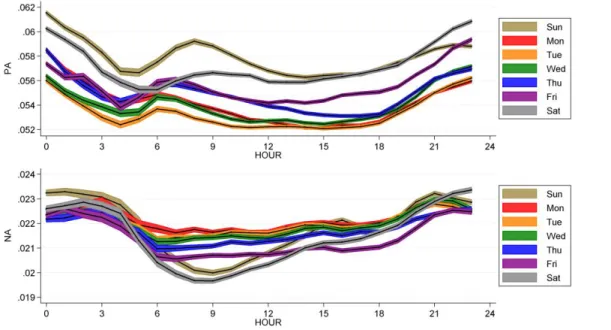
Figure 1. Hourly changes in individual affect broken down by day of the week. Each series shows mean affect (black lines) and 95% confidence interval (colored regions).
53
Figure 2. Hourly changes in between-individual affect (y-axis) over a 24-hour cycle (x-axis), broken down by day of the week. Each series shows the mean affect (black lines) and 95% confidence interval (colored regions).
54
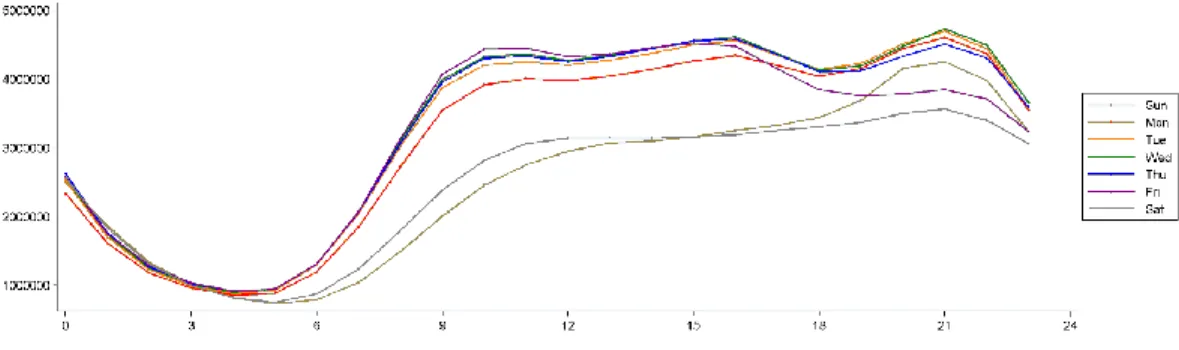
Figure 3. Number of messages posted on Twitter (y-axis) by hour (x-axis) and day of the week.
55
Figure 4. Hourly changes in within-individual affect (y-axis) over a 24-hour cycle (x-axis), broken down by chronotype, for PA (top) and NA (bottom). Each series shows the mean affect (black lines) and 95% confidence interval (colored regions).
56
Figure 5. Hourly changes in individual affect in four English-speaking regions. Each series shows mean affect (black lines) and 95% confidence interval (colored regions).
57
Figure 6. Line of best fit through the 14.3M person-month observations (affect by minutes gained or lost per day). For visual reference, 100 aggregate observations binned by percentiles are superimposed.
58
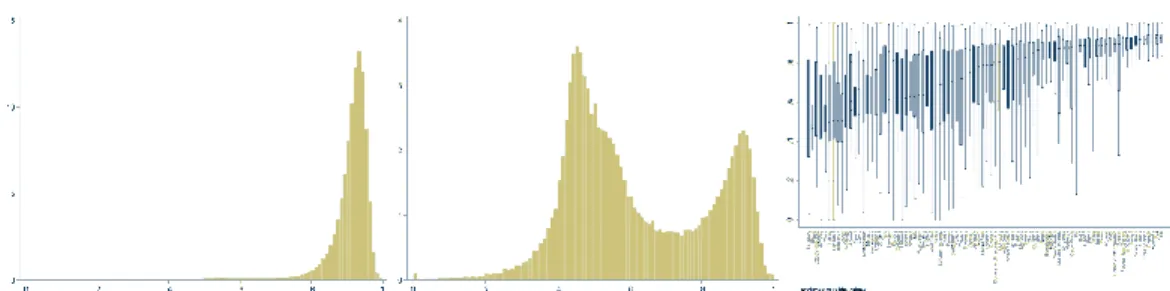
Figure 7. English proficiency across the population. Left: Histogram of individual English proficiency in English-speaking countries shown in Figure 5. Middle: Histogram of individual English proficiency in all other countries. Right: Boxplots of English proficiency in each country/region.
75
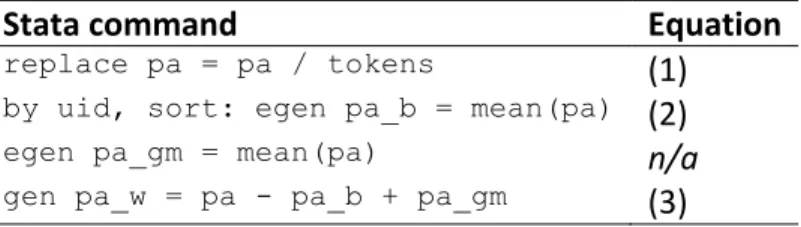
Figure 8. A typical Prosper.com loan listing. This listing includes a photograph, detailed economic information (“Credit Profile”) and a
borrower-provided free-text description of their reasons for borrowing and their other circumstances (“Description”). The list of bids received is shown at bottom.
96
Figure 9. Prosper’s weekly loan activity, March 2006 to September 2008. 100 Figure 10. Prosper bids disproportionately go to a very small number of
listings, especially among the riskier credit grades.
x
Figure 11. Weekly investor demand, as measured by bid-to-listing ratio. 103 Figure 12. Proportion of listings (top) and loans(bottom) by credit grade and
week.
104
Figure 13. Across all credit grades, nearly all loans are in good standing after three months. Over time, borrowers in riskier credit grades experience many more defaults.
105
Figure 14. A 2-D projection of the 64 dimensions produced by word2vec. 116 Figure 15. Partial dependence plots of debt-to-income ratio and loan amount
requested.
124
Figure 16. Partial dependence plots showing the impact of selected LDA-derived topics on borrower rate.
130
Figure 17. Partial dependence plots showing the impact of selected LDA-derived topics on borrower rate, broken down by credit grade.
xi
LIST OF TABLES
Table 1. Time zones and countries/regions. 62
Table 2. The overall dataset contains a large number of relatively inactive users whose aggregated messages include too little information to provide robust measures of individual affect. We excluded these users, as well as those who we identified as non-proficient in English.
77
Table 3. Counts of Activities on Prosper 100
Table 4. Count of Listings on Prosper by Number of Bids Received. Most listings received five or fewer bids.
101
Table 5. Prosper Group Membership Statistics 107
Table 6. Top words per topic generated using Latent Dirichlet Allocation. 113 Table 7. Regression model results, including economic inputs, photo presence
and group membership.
117
Table 8. Performance of models learned using adaptive boosting 121 Table 9. Degradation in model performance relative to full model, when
individual inputs are omitted
123
Table 10. Model performance by credit grade. 125
Table 11. Within-credit grade model performance relative to full model, when inputs are omitted
127
Table 12. Absolute and relative model performance when text analysis inputs are included.
128
Table 13. Absolute and relative model performance for borrower rate prediction, by credit grade (LDA model scores only).
1
INTRODUCTION
The activities through which we live our social lives have moved over the past quarter century from taking place exclusively offline, to taking place partially or mostly online, mediated through internet-based services and engaged with through a screen, either at one’s computer or, increasingly, on one’s mobile device. Furthermore, these tendencies feed on one another – the more time we spend in front of a screen, the more we engage in social activities that way; and in turn, the more social activities are centered on online experiences, the more we grow fixated to the screen. These online experiences may be as commonplace as sharing and socializing with friends or shopping for clothes and household goods, or may be as weighty as engaging in economic or political activity.
Delivering any of these services requires maintaining sufficient data to administer the services in question. A service for socializing with one’s friends needs to maintain, for example, data indicating who is friends with whom, and an archive of their communications. An online merchant needs to remember who has purchased what, so that billing, shipping, and the other necessary activities of commerce may take place. In many cases, scaling a business entails scaling a large and expensive data infrastructure capable of tracking millions of users and potentially billions of interactions, in real time. It was not long before it became apparent that the data necessary to run a business could be repurposed in a variety of ways. A socializing service could not only track who is friends with whom, but also use that data to predict
2
who might be friends with whom. An online shopping site could use its understanding of who purchased what, to offer recommendations about what other things people might like to purchase. These new purposes are, broadly, of value to the user, and include assistance in locating old friends or in identifying the best product that meets one’s needs and preferences.
As the capability to collect data grows, and with it the investments in learning to turn that data into information, the kinds of data that can be collected grow. Rather than tracking only those items a person purchases, for example, an online store might develop the data processing capability to track all those items a person looks at, as well as when, and from where (at home, on a mobile device, using a certain web browser, and so on.).3 The cycle repeats itself – greater learnings from data leads to greater investment in collecting, storing and processing that data, as well as to efforts to identify novel purposes to which the data can be put.
Like other technologies, the technologies of data analysis are not unambiguously or exclusively positive or negative in their effects, and can be put to uses that might not please users, for example encouraging or forcing them to reveal personal information they might otherwise not – even if that revelation is predictive or approximate, rather than explicit or definitive, and subjecting them to unwanted surveillance, marketing, discrimination, or even physical harm or the threat of it. Though this scenario sounds potentially dystopian, we may take comfort in the
3 The data from a single source can be combined with external data sources, as well; for example, in Chapter 2, data from the social network service Twitter is enriched by including geographic data in the form of global cities’ latitudes and daylight hours.
3
possibility that the challenges we are forced to confront by pervasive data collection and aggregation can be addressed by the same. Though large-scale social networks may enable bad actors to threaten and harass from a distance, deeper understanding of the structure of those networks and the content of those messages may enable more effective filter creation or other technical mechanisms of inhibiting or stopping those bad actors. Though data enables potentially inappropriate quantification, for example using social behavior as a tool to guide access to economic or professional opportunities, as a society we are now forced to confront questions about whether we will support data being put to any purpose that benefits the holder, or whether we will circumscribe through law, regulation or norm those purposes that are unfair or unjust. And, as I explore in this dissertation, it is in large scale recordings of behavioral data that we might find the possibility of developing a greater understanding of many varieties of human behavior.
In recent years, a body of literature has started to develop in the social sciences exploring the “opportunities and challenges” (as I refer to them in Chapter 1) associated with these data and efforts by social, behavioral and computer scientists to learn from them.
One of the earliest critiques leveled at the use of online data for social science research had to do with representativeness. As I discuss in detail in Chapters 1 and 2, participants in online social spaces may not necessarily be representative samples of some greater population; this was especially true when internet use was limited to professionals and people affiliated with universities, but remains true today, in light of the differential access opportunities that split along predictable geographic, racial and
4
socioeconomic lines. However, it is not feasible to expect that online social spaces would be representative in this way, and it is not necessary that they do so, for the same reasons that laboratory experiments need not represent the population as a whole, so long as variation in the behaviors in question does not lie along the same axis as the population’s representativeness. Though it has been shown that non-representative laboratory samples can have effects on what are believed erroneously to be fundamentally human rather than cultural attributes (Henrich, Heine, and Norenzayan 2010), laboratory experiments in general attempt to isolate single behaviors and induce variation in them that is expected to be robust against cultural or other idiosyncratic factors. Also, it is possible in some circumstances to examine both the universal and the culturally specific manifestations of some behaviors using online data, as demonstrated in Chapter 2, where I show how mood expression varies globally, but with attention to how culture mediates those expressions.
As noted in Chapter 1, and echoed by critical works by others, online data is necessarily incomplete and imperfect (Lewis 2015; McFarland, Lewis, and Goldberg 2016; Shaw 2015). This much, though, becomes obvious after even the most minimal introspection. Data from an online social environment provides information about communication within that environment and views into communication among that same set of actors taking place through other channels is necessarily absent. Studying workplace email networks, for example, provides one view onto how coworkers communicate, but tells us nothing about the conversations they have face-to-face, over real-time chat channels, or otherwise. Purchases people make in one online store provide a partial view onto their consumption patterns, revealing nothing about the
5
things they buy at other online stores or at their local shopping mall.
Data is also error-prone and incomplete or misleading in either obvious or non-obvious, and sometimes playfully meaningful ways. Out of laziness, fear, privacy or other motives, people may fill out profiles incompletely, including only those bare minimum facts that are required to participate in a service. They may not include their name, or their age, or their location or gender – the service might not even ask for it. When they do include information, they may use pseudonyms, say their age is 120 years old to avoid providing their real age, or list a fictional or incorrect location. Sometimes misinformation can be used to make a point – providing a politically controversial location may be a sign of solidarity with the people at that location, and also an attempt to confuse location based algorithms.
Activities like these are what Shaw (2015) points to as the historicity and “materiality” of an online social space, and suggests more generally that the architectural structure of an online environment and the behaviors it affords limit its use as an instrument of social scientific research. However, as I describe in Chapter 1, any online space should be thought of as much as an ethnographic field site as a source of disembodied data; it is incumbent upon the researcher to develop an understanding of the kinds of social activities that are expressed in an environment before implicitly bringing an interpretive lens to it, even if that lens is framed primarily in terms of the properties of the data the site generates. As Butts (2009) points out in the context of network analysis, choices about how to define which nodes count, and what constitutes an edge, can have large effects on the resulting understanding of behavior in a network. Likewise, a mischaracterization of the
6
meaning of a behavior in an online space can result in inaccurate conclusions, as has always been the case in field research in more traditional ethnographic work in sociology and anthropology.
These challenges, representativeness, completeness, and accuracy, are indeed important concerns, and demonstrations of why this is so stand as useful correctives against the view that mere data alone, at sufficient scale, renders them moot. The latter view is exemplified by Wired editor Chris Anderson’s (2008) polemical article, “The End of Theory,” and more recently and substantively, by a debate between Google AI researcher Peter Norvig and MIT linguist Noam Chomsky (Norvig 2011), whose distinct definitions of success yield distinct beliefs about what constitutes good science; as Breiman (2001) puts it, these two camps differ in whether it is most important that models are accurate or that they are explanatory. In brief, Chomsky argued that statistical models whose sole aim is to reduce the error on some prediction task are not scientific progress, because they do not increase our understanding of the mechanisms or structures giving rise to the data, while Norvig argues that statistical language models have value in a world in which reality is too complex to be explained by simple models, not to mention the success that has been shown in delivering technologies like search engines, speech recognition, machine translation.4 For Chomsky, a successful model of grammar would predict with high fidelity when a human speaker would deem a sentence ungrammatical, based on an understanding of the tree structure of that sentence; a statistical model might look at the same sentence
7
and instead assign it a low probability, due to having never before seen a sentence that “looks like” it.
Both have a point. The statistical modeling community has yielded approaches to building predictive models that have demonstrable success in the real world, from language to computer vision, and these models, with potentially millions of inputs, do explain more of the variance in a dataset than a far more parsimonious model might, even when appropriately controlling for overfitting to the data at hand. What’s more, the traditional tools of science may not be up to the challenge of answering questions using large, modern datasets. Since the t statistic is dependent on the standard error, which in turn is dependent on n, for a sufficiently large dataset, any t statistic will be likewise large, yielding very small p values, which have long been the cornerstone of tests determining scientific importance (Krueger 2001). In other words, old rules of thumb for evaluating models no longer work, and in such a world, more appropriate evaluation may indeed include reduction of prediction error on unseen data.
On the other hand, parsimonious theoretical models’ goal is not to explain as much variance as possible, but rather to explain as much variance as possible using the combination of factors implied by a hypothesized mechanism about how the world works. For this reason, quantitative social scientists, in particular, have leaned toward a theory-first rather than a data-first approach; though a dataset may be intriguing because it suggests the possibility of testing a particular hypothesis, the hypothesis necessarily comes before the test. This contrasts with a data-first approach, in which,
8
much like ethnographically-oriented social scientists, one might explore the data as though an anthropologist stumbling into a remote society or a natural scientist encountering a previously unobserved physical phenomenon, seeking to first observe patterns, which may raise other questions and suggest other tests to perform, or may provide evidence consistent or inconsistent with existing theories. For example, Chapter 2 brings to bear a large sample of data from Twitter which, through exploration, revealed patterns that informed existing theories about human mood that had previously been observed only with much smaller and less powerful datasets.
The relationship between the ethnographer and the statistical modeler shares more in common than a data-first approach. As Mohr and Bogdanov (2013) point out in a special issue of Poetics focused on topic modeling, the approach shares much in common with post-World War II work in content analysis, with the shared goal of identifying and quantifying themes in text, but in a faster and potentially more objective way. Topic modeling, as well as other text analysis methods, are employed in both Chapters 2 and 3, with methods ranging in sophistication from keyword counts to topic modeling, to semantic modeling.
Despite the challenges, both theoretical and practical, of working with large-scale behavioral data from the internet, the detailed observations of multifaceted human behavior that these systems provide will likely make them indispensable to the future of the social sciences. Taking advantage of these opportunities will depend on whether social scientists can collaborate with and learn from computer and information scientists to develop and employ the multiplicity of qualitative and quantitative methods necessary to make sense of that data and learn from it.
9 CHAPTER 1
DIGITAL FOOTPRINTS: OPPORTUNITIES AND CHALLENGES FOR ONLINE SOCIAL RESEARCH5
Introduction
Scientific disciplines make revolutionary advances not only through new discoveries, theories, and paradigms, but also because of the invention of new tools and methodologies (Kuhn 1962). The electron microscope, space telescope, particle accelerator, and MRI have allowed scientists to observe the world at greater scale or at finer resolution, revealing previously-obscured details and unexpected patterns, and experiencing the "eureka moments" of scientific breakthroughs. Newly developed tools for observing online activity are having a similar transformative effect on the social and behavioral sciences. These studies show how "digital footprints" collected from social media enable us to understand human behavior and social interaction in ways we could not do before.
While the societal impact of electronic communication is widely recognized, its impact on social and behavioral science is also profound, providing global yet fine-grained observational data and a locus for population-scale experimentation. A 2001 Annual Review of the "social implications of the Internet" (DiMaggio et al. 2001) assessed the Internet as a transformational phenomenon in the reproduction of social inequality (Hargittai 2010; L. Robinson 2011), community mobilization (Hampton
10
and Wellman 2003; Rainie and Wellman 2012) and the use of leisure time (J. P. Robinson 2011). This review turns the tables, surveying studies that use online data to advance knowledge in the social sciences. A 2004 Annual Review of the “new science of networks” surveyed recent advances in the mathematics of networks, including biological and mechanical as well as social systems (Watts 2004). Although network analysis is clearly an important application of online data, the transformative research opportunities opened up by new sources of empirical data include but also extend beyond network analysis. The rapidly growing field has become too large for a comprehensive review, and therefore only a limited number of studies that illustrate the theoretical and methodological opportunities and challenges are referenced here, with a slight bias toward papers authored by sociologists or published in sociological journals. Although I include studies that examine online purchases to study social behavior, I primarily focus on studies in which people interact directly with one another, such as social networking sites.
Hard Science
Over the past century, there has been no shortage of social theory but there are severe constraints on access to data. The reason is simple: social life is very hard to observe. For example, it is much easier to ask an isolated individual about their friends than to observe the ongoing interactions and exchanges that are the stuff of friendship. Ethnographic participant-observation studies and surveys of complete networks make it possible to fully document social interactions, but only at costs that can be
11
prohibitively expensive to implement except in very small groups. The need to collect relational data through direct contact has therefore generally limited studies of social interactions to small bounded groups such as clubs (Zachary 1977) and villages (Entwisle et al. 2007). Lengthy time-series data on nation-level populations, such as the Framingham Heart Study6 or The National Longitudinal Study of Adolescent Health (Harris et al. 2009) are enormously expensive logistical challenges and are usually undertaken by multiple cooperating institutions in government and academia. Attempts to measure network structure at the population level by surveying egocentric networks (a randomly chosen person and their network neighbors) can be useful for studying the attributes of network nodes (such as degree), and edges (such as tie strength), but this methodology has serious limitations (Flynn, Reagans, and Guillory 2010; Marsden 1990), including the inability to measure essential network attributes (e.g. distances, clustering, connectivity, and centrality) or social interactions (e.g. diffusion and polarization).
Because of the difficulty observing social interactions at population scale, most surveys rely on random samples composed of observations that are selected to be independent and to provide an unbiased representation of the underlying population distribution. However, independent observations preclude the ability to directly measure influence from a respondent's friends. We know that people do not entirely "think for themselves," but when we study opinion formation using random samples, we are left with little choice but to assume that a respondent's opinions are shaped
12
entirely by his or her other traits, such as demographic background, material self-interest, or personal experience. As a result, we cannot rule out the possibility that demographic differences in opinions (e.g. the social liberalism of college graduates) are spuriously generated or exaggerated by the unmeasured effects of peer influence (McPherson 2004; Della Posta, Shi, and Macy 2013; Salganik, Dodds, and Watts 2006). Conversely, snowball sampling makes it possible to obtain relational data among network neighbors with which to measure demographic differences in beliefs and behavior net of the similarity between network neighbors, but the path dependence in selecting respondents makes it more difficult to obtain an unbiased representation of the population distribution.
Longstanding limitations on the ability to observe social interaction are rapidly disappearing as people all over the globe are increasingly choosing to interact using devices that provide detailed relational records. Data from online social networks – email archives, phone logs, text messages, and social media postings – allow researchers to relax the atomistic assumptions that are imposed by reliance on random samples. In place of path analytic models of social life as relationships among variables that measure individual traits (Duncan 1966; Wright 1934), data from online social networks makes it possible to model social life as relationships among actors (Macy and Willer 2002).
The rapid increase in the use of digital technologies that generate time-stamped digital footprints of social interactions, from email (Kossinets and Watts 2006) to mobile telephone (Eagle, Macy, and Claxton 2010) to social media (Lewis et al. 2008), affords unprecedented opportunities for the collection of both experimental and
13
observational data on a scale that is at once massive and microscopic – massive in the sense that the people under study can number into the millions and the data grow into the terabytes, and microscopic in the sense that individual micro-interactions are recorded. In place of retrospective reports about respondents’ behavior and interactions, online data can provide a detailed record of daily activities and the frequency and intensity of social relationships. These methods greatly expand our ability to measure changes in behavior, not just opinion; to measure these changes at the individual level yet on a global scale; to observe the structure of the underlying social network in which these individuals are embedded; to travel back in time to track the lead-up to what later becomes an event of interest; and to find the dogs that don’t bark (e.g. the failed outcomes that escape the attention of publishers, editors, and authors).
This research strategy is not new. For many decades, social and behavioral scientists have acquired data collected as a byproduct of the administrative or record-keeping processes of governments and organizations. Organizations track their membership lists, firms track the purchases of customers and the performance of employees, and banks collect massive data from credit card transactions.
What is new is the macroscopic global scale and microscopic behavioral extensiveness of the data that is becoming available for social and behavioral science. The Web sees everything and forgets nothing. Each click and key-press resides in a data warehouse waiting to be mined for insights into behavior, to enable useful functions from spam detection to product recommendations to targeted advertising. Our mobile phones, tablets, and laptops report every webpage we visit and every link
14
we click and can even report our precise location and movements. Our social interactions are mediated through email, Skype, instant messaging, Facebook, and Twitter. Our photographs are identity-tagged, geo-tagged and time-stamped, creating a who-when-and-where recording of everything we upload. Social media platforms like Facebook and online labor markets like Amazon Mechanical Turk make it possible to conduct controlled experiments using thousands of participants from all over the world.
The emerging field of computational social science (Lazer et al. 2009) is concerned with computational methods to collect, manipulate and manage massive amounts of data, as well as with employing the appropriate techniques to derive inferences, such as automated content classification and topic modeling, natural language processing, simulation, and statistical models for analyzing non-independent observations (Anderson, Wasserman, and Crouch 1999). The rapid growth of computational social science reflects the growing recognition that these new tools can be used to address fundamental puzzles of social science, including the effects of status competition, trust, social influence, and network topology on the diffusion of information, the dynamics of public opinion, the mobilization of social movements, and the emergence of cooperation, coordination, and collaboration.
Computational social science has also reinvigorated social network analysis, one of the historical specialties in sociology that has long been concerned with understanding the processes behind the formation of social ties and their consequences for and constraints on the actions and efforts of individuals and entire communities. Until recently, social network analysis has been limited to very small groups by the
15
requirements of direct observation of interpersonal interactions. We now have the ability to obtain detailed measures of network structure and network processes at the population level. The challenge of analyzing massive amounts of online data has pushed social network analysis into the forefront of computational social science, as these techniques have been applied to the inherently relational data created from online interaction.
When it Rains it Pours
The Social Telescope
The ability to observe hundreds of millions of people makes it possible to measure differences with small effect sizes that might otherwise be swamped by random variability. Just as an enormous antenna like the Arecibo Observatory is required to detect the low frequency radiation emitted from neutron stars (Lovelace & Tyler 2012), online networks comprise a massive antenna for social science that makes visible both the very large, e.g. global patterns of communication densities between countries (State et al. 2012) and the very small, e.g. hourly changes in emotional affect and micro-behaviors like doing homework, getting drunk, and getting a headache (Golder and Macy 2011).7
Online behavior is recorded in real-time rather than retrospectively. In social network studies, when individuals are given "name generators" and surveyed about their communication patterns, they are subject to a variety of potential biases. Question wording and ordering can cause respondents to artificially limit or otherwise
16
vary the individuals they report, leading to underestimates of network size (Fischer 2009; Pustejovsky and Spillane 2009) or even measures of some other network (Burt 1997) when survey questions mistakenly elicit report of a social tie outside the researcher’s intended scope. Online behavior – time-stamped and passively recorded – provides an unambiguous recording of when, and with whom, each individual communicated.
When activities are recorded via mobile devices, real-time mosaic accounts of collective behavior become possible that otherwise could not be reconstructed. As smartphone use increases in prevalence, the offline context of online behavior becomes available, such as common participation in a public event. For example, sampling a corpus of tweets (brief messages posted on Twitter) that occurred during a certain time range, and within a limited radius of a given event, can reconstruct how online activity complemented a parade or demonstration, or add a geographic variable back into an analysis that is otherwise blind to spatial location.
Relatedly, online behavior is observed unobtrusively, limiting the potential for Hawthorne-type effects in which researcher-induced desirability bias makes it difficult to observe normatively inappropriate behaviors (e.g. expressions of racial and ethnic prejudice), which participants may self-censor in surveys and in laboratory studies (Zizzo 2010). Observing behavior unobtrusively ensures that the social pressures and normative constraints on individuals are exerted by their peers rather than by the researchers. For example, online dating sites provide an unprecedented opportunity to
17
study the effects of racial and ethnic preferences on mate selection choices. Using a sample of 6,000 online profiles from Yahoo! personals, Robnett and Feliciano (Felicano, Robnett, and Komaie 2009; Robnett and Feliciano 2011) found that, among those Whites who stated racial preferences in their online profiles, men were more likely to exclude Blacks than other racial categories, while women were more likely to exclude Asians. Similar results were reported by the online dating site OK Cupid8 which showed that Black women received replies at lower rates, and women of several races preferred White men over men of other races. In another dating-related study, Taylor et al. (2011) found support for the “matching hypothesis” that people seek partners whose perceived social desirability matches their own self-assessment.
Moreover, online interactions have been characterized as "persistent conversations" (Erickson 1999) that can be observed in real-time, even if the observation is taking place after the fact. Unlike ephemeral in-person conversations, online conversations are recorded with perfect fidelity and can persist forever. Though care must be taken when analyzing documentary evidence out of its original historical context, long after perspectives and circumstances have changed, the conversations themselves can be largely reconstructed, allowing retrospective analyses to be far more complete and exact than in most archival research.
The task for the researcher is to see online behavior as social behavior, the kind that might occur in any field site, be it a remote village, a law office, or a high school cafeteria. Some researchers explicitly conceptualize online sites as field sites in the
18
ethnographic sense (Lyman and Wakeford 1999). Relatedly, online behavior in social media represent social action in the Weberian sense – action that is oriented toward others (Weber 1922), involving what Weber called “verstehen” – the subjective meaning for the actors involved. Paccagnella (1997) noted the multiple ways one might interpret the purpose, use, and limitations of technology, hence the need not to conflate the meaning to the researcher with the meaning for users (Pinch and Bijker 1984).
The Virtual Laboratory
Although most research using online data has been observational, a growing number of studies use the Web as a virtual lab for controlled experiments. Experiments address a key limitation of all observational studies, online or off – the inability to measure a phenomenon free from potentially confounding unmeasured factors. For example, it has been difficult to distinguish between contagion on a social network and common exposure of network neighbors to some unobserved source of similarity. An outbreak of sneezing, for example, could indicate a spreading virus or common exposure to seasonal allergens. Aral, Muchnik, and Sundararajan (2009) reviewed numerous statistical techniques that have been proposed to tease these processes apart using observational data and concluded that none are sufficient, a conclusion also reached by Shalizi and Thomas (2011).
Controlled experiments with random assignment are one solution. In a path-breaking pair of studies, Centola (2010, 2011) created a web-based health information community that made it possible to manipulate the levels of clustering and homophily in users' social networks. By randomly assigning participants to conditions, Centola
19
removed shared environment and homophily as sources of network autocorrelation, leaving only the possibility for contagion as an explanation. He found that the rate and extent of contagion was higher in the clustering condition than in the random condition (2010), consistent with the predictions of theoretical models (Centola and Macy 2007) of the spread of simple and complex contagions on small-world networks in which complex contagions benefit from the social reinforcement provided when multiple neighbors become “infected.” This social reinforcement is more likely when the network is highly clustered. Adoption was also greater in the homophilous condition (2011) than in the random condition, with no variation in network structure.
Experimentation online offers several advantages as well as challenges compared to traditional offline experiments in laboratory settings. An obvious advantage is the greater economy of scale. For example, Centola’s online experiment with repeated involvement of 144 participants would be logistically prohibitive in the lab, but once an online system is built for a few users, the marginal cost of scaling it up to hundreds or even thousands of users is relatively minimal. Larger numbers of participants not only increases statistical power, it also allows new research opportunities. For example, it becomes possible to test hypotheses about changes in collective behavior, in which groups rather than individuals are the units of analysis.
Less obvious but arguably more important theoretically, scalable experiments allow multiple simultaneous realizations of the same starting conditions. This makes it possible to test the possibility that highly non-random patterns may nevertheless have very limited predictive value if the patterns observed in one “world” vary widely (and perhaps entirely randomly) from one world to the next, due to processes that are path
20
dependent or confer cumulative advantage. This possibility was demonstrated for the first time by Salganik and colleagues (Salganik et al. 2006; Salganik and Watts 2009) in an experiment that has become an “instant classic.” They varied the level of social influence on a music download site that they created for the research. When participants were subject to influence, they found that music preferences were highly non-random in each world, making it possible to predict what would be downloaded simply by knowing how many others in that world had downloaded the same song. The surprising result was that this information was not very helpful for predicting what songs would be downloaded in another “world.” Their findings are a telling reminder to academic researchers, marketing departments, campaign managers, and epidemiologists who use observational data obtained from the one world that we inhabit to try to predict outcomes based on statistically significant patterns (Watts 2012).
Other online experiments have used existing websites rather than creating their own. Bond et al. (2012) tested the effects of social influence on voter turnout by manipulating whether Facebook users were exposed to information about the number of their friends who had voted. Although this experiments required the cooperation of Facebook, that possibility is reinforced by the widespread use of online experiments by industry. Web practitioners are already familiar with "A/B testing," in which multiple versions ("A" and "B") of a website are created and visitors are randomly assigned to one version or another to test the effects of different layouts, colors, or content on user engagement, retention, click-throughs, and so on. In many cases, studies motivated by theoretical questions can piggyback on the practical needs of
21 industry to better understand user behavior.
Researchers conducting otherwise traditional laboratory studies may now turn to an online labor pool. Amazon's "Mechanical Turk" is an online labor market with a vast global user base that is culturally, geographically, and demographically far more diverse than the undergraduate psychology majors that comprise most offline participant pools. Touted as " artificial artificial intelligence," Mechanical Turk is designed to be a programmatic means of having humans complete tasks for which artificial intelligence is inferior, such as summarizing a document or choosing the best of five photographs. Typical compensation per task ranges from a few cents to a dollar, depending on the time required. Mason and Suri (2011) provide a review of methodological issues arising in the use of Mechanical Turk for online experiments. Rand (2012) points to a number of inherent limitations in nearly all online experiments, such as the inability to maintain consistency in and control over participants' immediate physical surroundings, with the associated risk that results may be contaminated by distractions or by outside sources of information. Additionally, “Turkers” sometimes click mindlessly simply to complete the task, which requires steps to detect random clicking and failure to follow instructions. Incentives may also not operate as intended, since Turkers appear to "anchor" on payment levels so that paying more makes them believe they deserve more, producing a greater quantity of work but not at a greater level of quality (Mason and Watts 2009).
22
Research Applications
Social Networks, Contagion, And Diffusion
Social network analyses have been among the earliest studies to use online data. Though numerous social networking sites exist, researchers have focused on two of the largest, Twitter and Facebook, with over 300 million and 1 billion worldwide users, respectively. Facebook profiles contain rich demographic data, including full names, dates of birth, geo-location, affiliations with friends, organizations, and political and social movements, and cultural tastes. Though less demographically rich, Twitter data is much easier to obtain via a more open API (see "Methods, Skills, and Training," below). Private data from Facebook is not generally available for research purposes, though several strategies exist for researchers to use Facebook data. First, researchers may build "apps" or add-on applications, which, when adopted by users, allow access to their demographic and behavioral data. These apps can be narrowly targeted to just those users with the desired demographic traits, network properties, or cultural or political preferences. However researchers need to keep in mind that reliance on self-selection means that the result is a non-random convenience sample whose results cannot be generalized even to the targeted sub-population. Second, researchers may invite participants into the lab the way they might for any other lab experiment, who then log in to their Facebook account (Gilbert and Karahalios 2009). Several studies have leveraged a Facebook policy that allowed people affiliated with the same university to see a more detailed user profile than is otherwise generally available (Lewis et al. 2008; Lewis, Gonzalez, and Kaufman 2011; Wimmer and Lewis 2010). These studies examined a complete university cohort to study homophily
23 patterns in race as well as cultural tastes.
Some researchers have arranged with Facebook staff to gain access to anonymized private user data for research purposes. For example, Golder, Wilkinson, and Huberman (2007) showed that private messaging by non-friends took place primarily at late-night hours, Traud et al. (2010) compared the network structures of multiple universities, and Mayer and Puller (2008) modeled tie formation within one university. Some researchers have collaborated with Facebook's own internal research team to analyze private data as well as conduct large-scale experiments. Das and Kramer (2013) examined inhibition in self-expression, but this was only possible because of the internal logging that takes place on messages that users write but ultimately choose not to post. Bond et al. (2012) isolated the effects of social influence from mass-media influence in increasing likelihood to vote, by conducting a massive experiment on 61M Facebook users.
boyd and Ellison (2007) identified distinctive structural aspects of social networking sites: a personal profile and a publicly-visible list of network neighbors (who share a tie). They note that the visibility of others’ egocentric networks varies by site and as the sites themselves change over time. For example, LinkedIn makes some profile aspects visible only to paid users (viewer and viewed). Twitter allows users to view indirectly the content received by those they follow only if the user also follows those same people.9 Facebook requires symmetric social ties (two friends must each
9 That is, if A follows B, then A can see all of B’s messages, but if B and C engage in a conversation, this is visible to A only if he follows both B and C. The purpose of this ostensibly due more to
24
indicated friendship with the other) while Twitter and most blogging platforms allow asymmetric ties, leading to an extremely long-tailed degree distribution (e.g. celebrities often have many thousands of followers). Some demand a clear tie to one’s offline identity (e.g. Google Plus and Facebook), while most do not, though even among the latter, participants often choose to establish a verified identity, especially on blogs and online dating sites where credibility is needed. These varying requirements impact users’ behavior, helping some spaces to flourish and elicit trust and cooperation, while others exhibit distrust and hostility. These differences in turn open up important research opportunities for understanding how variations in structure, norms, cultural protocols, and incentives affect individual and collective outcomes.
Borgatti and Halgin (2011) distinguish two types of network ties based on their persistence over time – states (e.g. kinship and friendship) and events (e.g. exchanges and conversations). A further distinction can be made between ties of affiliation (e.g. participation in the same event) and interactions (e.g. discussing the event). Ties can also be positively signed (attraction, friendship, cooperation) or negative (repulsion, antipathy, conflict), and they can be directed (listening, liking) or undirected (marriage, kinship, partnership). Online social networks share these properties. Leskovec, Huttenlocher, and Kleinberg (2010) examined tie formation in online networks including Epinions, Slashdot, and Wikipedia and found that undirected ties are formed as predicted by structural balance theory (the product of signs in a
25
balanced triad must be positive), but when ties are directed, status effects appear to play the larger role (e.g. if A defers to B and B defers to C, C is unlikely to defer to A).
A number of studies have used online networks to confirm two classic findings on the importance of ties that span large network distances, Granovetter's (1973) Strength of Weak Ties and Burt's (1992) Structural Holes. For example, Eagle et al. (2010) used national telephone logs among 65M subscribers (about 90% of the population) to show that diversity in the networks of the members of a community was positively related to economic development, confirming offline network results reported by Granovetter and by Burt. Gilbert and Karahalios (2009) studied the relationship between tie strength and connectivity using data from Facebook. They employed an innovative approach to developing a metric for online tie strength. While studies often rely on the number of messages exchanged as a metric for tie strength, Gilbert and Karahalios used multiple indicators, including exchange of photos and public and private messages. In their lab study, they instrumented a Web browser to collect participants' Facebook activity and compared this to participants’ ratings of the strength of their ties to various friends. A similar study compared the volume and direction of messages, retweets, and @mentions among Twitter followers with the same users’ offline friends and discovered a close correspondence (Xie et al. 2012).
Other research has replicated Milgram’s classic investigation of the small-world phenomenon in which letters traveled through the mail through a chain of acquaintances until a target unknown to the originator was reached, which revealed the celebrated “six degrees of separation” (Milgram 1967; Travers and Milgram 1969).
26
Dodds, Muhamad, and Watts (2003) found a similar average path length in an experimental study of search on global email networks, and Leskovec and Horvitz (2008), using a global instant messenger network of 240M users, observed a mean path length of 6.6 steps, compared to Milgram's 5.2. A similar analysis of the global Facebook network (Ugander et al. 2011) found that number of steps separating users had declined from 5.3 in 2008 to 4.7 in 2011 as the network grew in size.
Massive network data have also made it possible to study how structural conditions affect the spread of social contagions, including the decision to join a group, adopt a convention, or spread information. Bakshy et al. (2012) used news feed posts for 250M Facebook users to show that novel information spread primarily through weak ties. In contrast, using mobile phone call records for 4.6M subscribers (about 20% of the national population), Onnela et al. (2007) found that while weak ties "held the network together" (in that disconnection of the network into isolated components was most vulnerable to deletion of these ties), most information traveled through ties of intermediate strength. The authors conclude that models of network structure typically rely on global characteristics such as betweenness, implicitly weighting all ties equivalently, but tie strength may play a larger role than the global characteristics.
Backstrom et al. (2006) investigated social influence in two social networks, LiveJournal (an online blogging community) and DBLP (a database of academic paper coauthors). The offline co-authorship network differs from the online blogging community in requiring far greater personal interaction and coordination. Nevertheless, the likelihood of joining a community (on LiveJournal) and attending a
27
conference (evidenced by DBLP) both increased not only with the number of network neighbors who had joined, but more surprisingly, with the number of closed triads among these neighbors. A possible explanation is that the ties between two neighbors are stronger when the triad is closed (the two neighbors of an actor are also neighbors of each other, as found by van der Leij and Goyal (2011). In addition, closed triads may entail greater fear of exclusion and more closely synchronized communications, leading to stronger social influence than when the triad is open.
Ugander et al. (2012), using Facebook-internal data about users' and non-users' email addresses, investigated how the probability to accept an invitation changed with the number of Facebook neighbors and the number of “connected components” (connected only by links through ego). Contrary to the result reported by Backstrom et al. (2006), the authors found that the probability increased not with the number of Facebook neighbors but with the number of connected components, even after controlling for demographic diversity. A possible explanation is that invitees discount multiple invitations from friends who know one another, interpreting these invitations as conveying redundant information about the benefits of membership. Since the data are missing two potentially important social ties, Facebook friends who did not include ego in their contact lists and friends who are not on Facebook, there is no way to know if distinct “connected components” in the observed ego network might actually be connected by these missing links.
Romero, Meeder, and Kleinberg (2011) found evidence to support the theory of complex contagions (Centola and Macy 2007) by examining the spread of the use of Twitter hashtags. Hashtags for controversial topics like politics were more likely to
28
be adopted following exposure to multiple adopting neighbors, compared to topics like music or sports. More recently, Weng, Menczer, and Ahn (2013) used Twitter hashtags to confirm a key implication of the theory of complex contagions – that the spread of complex contagions depends on network structure, a result that is consistent with the experimental findings reported by Centola (noted above). Other studies have used online data to test longstanding theories about information diffusion, including the existence of well-connected “influentials” who initiate cascades. Popularized by Gladwell (2000) in The Tipping Point, the theory of these high-degree network nodes (or "hubs") was earlier proposed by Katz and Lazarsfeld (1955), who referred to them as “opinion leaders” in a two-step model of the flow of influence. Billions of advertising dollars are targeted at so-called influentials based on this theory, but a growing number of studies cast serious doubts. Dodds et al. (2003) found that successfully-completed chains in their replication of Milgram's "six degrees" study did not in fact leverage highly-connected hubs. Cha et al.'s (2010) study of 1.7B tweets found that hubs “are not necessarily influential in terms of spawning retweets or mentions,” a result consistent with Kwak et al. (2010) that also casts doubt on the influence of widely-followed users on Twitter. Similarly, Bakshy et al. (2011) identify cases in which actors with average degree are the source, and González-Bailón et al. (2011) point to the importance of random seeds as well as nodes with higher centrality.
Exchange, Cooperation and Trust
A growing number of studies are using online data to address enduring problems of trust and cooperation in social exchange, in which the valued goods being
29
exchanged are time, attention, information, and status. Research by State et al. (2012) is consistent with a basic principle of exchange theory (Homans 1961; Emerson 1962; 1972), that exchange relations tend to be reciprocally balanced. They found that “couchsurfers" (people who are part of an online community of budget travelers who stay in others' homes), compensate their hosts' hospitality by conferring status in the form of public comments.
Attention is also a valued resource in social exchange. Podolny (2001) suggests that attention is a prism or lens through which one is judged by others; having the attention of powerful others can, in turn, redound to one's financial benefit and is a signal to others about who is worth investing attention. Online experiments confirm that individuals are willing to exchange monetary compensation for praise and attention from peers, even when it is artificial (Huberman, Lock, and Onculer 2004). More broadly, Huberman's research program centering on the “attention economy” created by online interactions addresses the puzzle created by the sheer volume of information available online, which makes attention scarce and valuable. Yet little is known about how attention is directed or attracted. Twitter users have been shown, for example, to rate others as more interesting to the extent that their own neighbors expressed interest in those others (Golder and Yardi 2010).
Like attention, trust is another resource that can be especially important in online interactions where identities can be ephemeral, limiting the reliability of reputational information and the ability to punish cheaters (Friedman and Resnick 2001). In response, users have evolved norms to regulate behavior, such as requiring newcomers to a community to be first to commit to the exchange. In a pioneering
30
study of online interactions, Kollock (1999) observed this practice in a community of bootleg tape recording traders, who also collectively paid enforcement costs by maintaining a "blacklist" of people who should not be traded with due to perceived past transgressions. Other studies have confirmed a principle originally proposed by Hechter (1988) that it is more effective to reward trustworthy behavior than to punish transgressions, since the latter creates incentives to increase the costs of detection. Friedman and Resnick (2001) attribute the remarkable effectiveness of the eBay feedback system in part to the incentives the system creates to maintain one’s identity, an incentive that increases over time.
Exchange-theoretic analysis can also be applied to personal as well as business and organizational relationships. For example Backstrom and Kleinberg (2014) randomly selected 1.3 million adult Facebook users to test the effect of network embeddedness (defined as the overlap in their friendship circles) on the formation and durability of romantic relationships. Surprisingly, they found that “dispersion” (or lack of overlap), not embeddedness, was conducive to successful relationships, a result that contradicts the theory of the strength of embedded ties but is consistent with a previously unexplored romantic implication of Burt's (1992) hypothesis that people are attracted to “structural holes.”
Online research on social exchange includes survey research as well as observational studies. Willer et al. (2012) administered surveys on Freecycle and Craigslist to compare the levels of solidarity reported by the sites' respective members. The results confirmed the exchange-theoretic hypothesis that the generalized exchange of Freecycle entails greater levels of solidarity than the negotiated exchange taking
31 place on Craigslist.
Collective Action and Social Movements
Many online communities rely on voluntary contributions by large numbers of unrelated individuals, presenting researchers with a remarkable opportunity to address longstanding puzzles in the study of collective action: how do order and consensus emerge among loosely-affiliated contributors, and what motivates them to contribute to this public good? Two prominent examples are open-source task groups like Wikipedia and Linux and massively-multiplayer online games such as World of Warcraft and Everquest. An overview of these two areas is provided by Contractor (2013). Wikipedia is an openly-editable collaborative encyclopedia written and edited by thousands of volunteers every day. Like many voluntary associations in the offline world, Wikipedia, Usenet, and many other online communities, are self-governed almost entirely by the evolving normative obligations and limits collectively established and agreed to by their participants, but with the critical difference that the detailed evolutionary records are preserved for study by the scientific community.
As Wikipedia has grown, its community of editors has created a number of policies to guide contributors and to resolve disputes, such as policies requiring articles to be written from a neutral point of view and to include statements only if they can be supported by reference to a publicly-available source (not first-hand research by the editor) (Kriplean et al. 2007; Kriplean, Beschastnikh, and McDonald 2008). Although these institutional arrangements help to regulate and coordinate user behavior, they also make the motivation to contribute even more puzzling since there is less opportunity to exploit the community to promote a parochial point of view.
32
Anthony, Smith, and Williamson (2009) examined the quality of Wikipedians’ contributions and pose the interesting puzzle that “anonymous Good Samaritans” contributed among the highest-quality content, while others (Welser et al. 2011) point out that Wikipedians self-organize into roles, focusing on “cleaning up vandalism,” providing domain expertise, and so on.
Many of the challenges faced by formal organizations – recruiting a skilled labor force, defining roles and responsibilities, and monitoring and rewarding performance, also arise in massively-multiplayer online roleplaying games (MMORPGs). Players can take on a particular role (trolls, warriors, etc.) and they can unite to form guilds (teams), work together to attack other guilds, and perform in-game tasks such as achieving quests. Like Wikipedia, guilds must overcome collective action and coordination problems in order to select, train and retain members. Choi et al. (2008) found that good fit between persons and tasks is associated with longer membership in a guild, while Wang, et al. (2011) found that players’ orientation toward performance and achievement displayed greater expertise, while those oriented toward having an immersive experience displayed less expertise.
To date, most of the research on these communities has been largely descriptive, and a vast opportunity remains for researchers to use data from user interactions to test hypotheses derived from the collective action, public goods, and game theoretic literature. Data from Wikipedia is freely available for download10 and Sony has made Everquest data available for academic research.