4.2 A VIRTUAL TORNADIC THUNDERSTORM ENABLING STUDENTS TO CONSTRUCT KNOWLEDGE ABOUT STORM DYNAMICS
THROUGH DATA COLLECTION AND ANALYSIS
William A. Gallus, Jr*., Cinzia Cervato, Carolina Cruz-Neira, Galen Faidley, and Rex Heer Iowa State University, Ames, Iowa
1. INTRODUCTION
In 1996, the National Research Council (in the National Science Education Standards) and the National Science Foundation (Shaping the Future) urged that all students have access to excellent undergraduate education in science, and that these students learn science by direct experience with the methods and processes of inquiry (NRC, 1996; NSF, 1996). Such methods are generally common in the fields of chemistry and physics where laboratory experiments allow students to directly measure quantities with instruments and experience phenomena with their senses. In meteorology, the difficulty of reproducing most atmospheric phenomena in the classroom restricts similar applications.
To get around this restriction for at least one atmospheric phenomenon, we have developed a tool that takes advantage of most people’s inherent fascination with severe weather and tornadoes and allows students to discover, measure, and explore in a virtual supercell thunderstorm environment. The virtual storm will be described in this paper, and preliminary results from pedagogical studies using the tool will be presented.
2. OVERVIEW OF THE VIRTUAL STORM Initial development of the virtual supercell thunderstorm began at a time when numerical model simulations of supercells containing tornadoes did not accurately reproduce many of the well-known visual features that span a wide range of spatial scales (e.g., comma-shaped rain core, tornado). The numerical model output was not visually realistic enough to allow its direct inclusion into the virtual world, it was determined that the virtual storm would have to be created from scratch, making use of an artist frequently consulting with a meteorologist. Photographs, videos, and guidance from those with experience in tornado intercept projects were used heavily to create this visually realistic artistic rendering of a supercell containing a tornado. The result might be thought of as a 21st century three-dimensional (3D) version of the simple two-dimensional (2D)
* Corresponding author address: William A.
Gallus, Jr., Iowa State University, Dept. of Geological and Atmospheric Sciences, Ames, IA 50011; e-mail: [email protected]
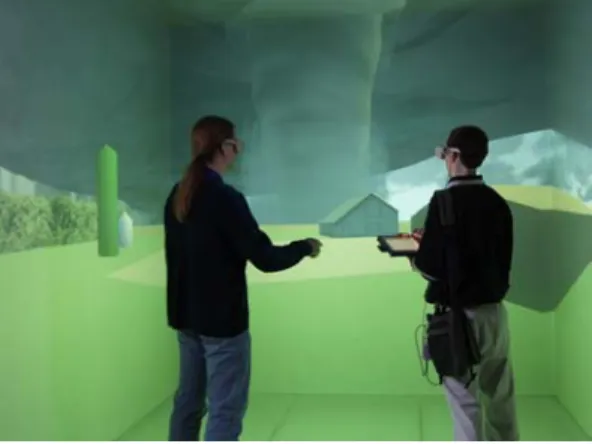
schematics often used in textbooks to convey complex information to students. Using the method described above, a virtual supercell thunderstorm scaled to match those commonly observed was created. It could be viewed in a highly immersive CAVE-like environment (Cruz-Neira et al 1993) or on a desktop PC. A view of two users within the CAVE environment can be seen in Fig. 1. The virtual storm represents an instant in time during the mature, roughly steady-
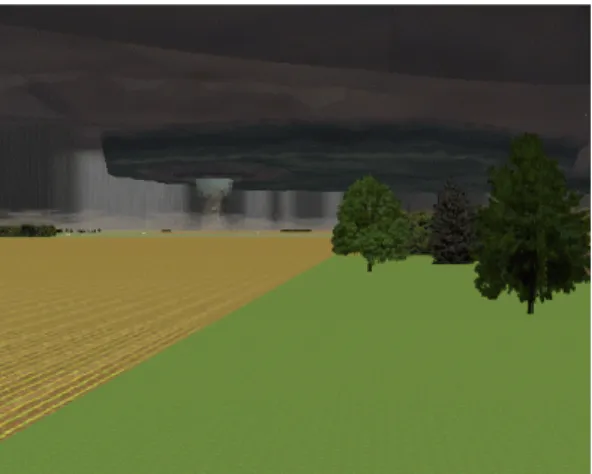
Figure 1: Two users of the virtual storm, nearing the tornado within the CAVE environment. state, stage of a tornadic supercell, and includes such visually realistic features as a wall cloud, tornado, tail cloud, comma-shaped rain region, anvil cloud, rear-flank downdraft clear slot, and shelf cloud. The thunderstorm cloud itself was scaled to be roughly 10 miles across its narrow axis and 50 miles long, with anvil cloud extending far downwind at high levels. The initial view of the storm that students see when beginning the application is shown in Fig. 2.
Work is currently being done to improve the realism of the storm. This includes the addition of mammatus clouds to the base of the anvil, the development of a better method of depicting rain and hail regions, and a particle system for the condensation funnel and debris cone of the tornado. Lightning is also being included to make the virtual world more dynamic. Audio representing the roar of the tornado, thunder, rain of varying intensity, and hail is also being incorporated at this time.
Figure 2: View of the PC version of the virtual tornadic supercell looking roughly west from a point about 25 miles away from the tornado. One design challenge faced during construction was allowing flexibility in the application of the virtual tool. The virtual storm was designed so that it could be used in almost any educational setting, from K-12 through graduate education. During the initial development, different software had to be used for the highly immersive CAVE version than for the version that would run on PCs more directly accessible to students. Recently, changes have been made to use the VRJuggler virtual reality framework (Bierbaum 2000) which allows the same version to be used on the desktop and in the immersive environment. This change along with the change from a proprietary graphics library to an open source one will allow for widespread dissemination of the virtual tool on most platforms.
The distinct visual features present in the virtual storm (e.g., wall cloud, anvil cloud, tornado) can serve as the motivation for students to explore and reason. In the early version of the activity, students could only experience the storm through their visual sense. Thus, when students were working with the virtual storm they were given questions to guide their exploration and encourage scientific thinking such as:
1) Where is the tornado usually found within the storm?
2) Why do forecasters look for a hook shape in the rain area to find a likely location for a tornado?
These questions, and similar ones, would require students to navigate throughout the storm. During such navigation, students would note that their entire perspective of the storm changes as they move into regions with lower cloud bases or restricted visibility due to rain (see Fig. 3). The navigation can be performed in a “drive” mode, which resembles what storm chasers experience,
or a “fly” mode which might be what researchers would experience in a research aircraft during an experiment. Questions like (1) are then used as a catalyst to have students offer explanations for why the tornado is not in the middle of the storm.
Figure 3: A view of the tornado in the PC version, looking west approximately 5 miles. Rain within the hook region, and blowing dust due to the rear-flank downdraft can be seen. 3. DATA PROBING CAPABILITY
To provide far more opportunities for students to discover, explore, and learn as scientists would, in the past year data-probing capability has been added to the application via a Graphic User Interface (GUI). Based on observational studies in the literature such as Wakimoto et al (1998), a data field was created for several atmospheric parameters to match the visual features of the virtual supercell thunderstorm. Temperature perturbations reflect the low-level cold pool associated with melting and evaporation of rain, subsident warming within the rear-flank downdraft, and the warm core within the buoyant updraft. Relative humidities depict some of the same features. Pressure perturbations, vertical velocities and horizontal wind components were all supplied to match both the virtual storm and observational studies. The GUI was developed using the Tweek software package. Tweek is an extensible toolkit that allows a 2D Java GUI to communicates with virtual environment applications (Hartling and Cruz-Neira, 2003). This software allowed the 2D GUI to be separated from the virtual storm itself which was presented within a separate graphics window (see Fig. 4). The only information passed between the two is the user’s position in the virtual space, and the direction the user is looking. The GUI allows a student to sample data at any point as they navigate in the virtual world. The measurement that they take then is displayed on a map, along with all prior
measurements. To control the large amounts of data that can accumulate, simple color-coding is used on the map, and more precise data readings are displayed in a separate table
Figure 4: PC version of activity, showing both graphical window and GUI.
beneath the map. Fig. 5 shows the GUI after a student has sampled several points for temperature information. The sampling can occur in three dimensions – a slider scale on the right side of the GUI map allows the student to move up or down in the atmosphere. When a student samples data, the data are assumed to be collected from an instrument operating like a vertical sounder. Thus, all information in the vertical is collected at a single point by just one click of the mouse button. In Fig. 5, the large
Figure 5: Temperature information sampled by a student on a map, with A marking an arrow pointing in the direction the student is looking, B showing the current temperature in the table, C the temperature legend, D an arrow showing north, E a history table of probed values, F the sampled temperature data shown as dots on a map, and G the selection menu for different types of data.
arrow (marked A) represents the student’s position with the arrow pointing in the direction the student is viewing the virtual world.
Along with the temperature data that is shown as color-coded dots on the map (because the student has selected this field to explore), data from other weather parameters also appears in the table.
To improve navigation, the GUI was designed so that students can choose to either navigate around in the virtual storm graphics window, or simply click positions on the GUI map, in which case they are taken immediately to that spot in the virtual world. As there are pros and cons for navigating in each window, it was interesting to observe how students prefer to use the virtual world for navigation and data collection and only in a few cases and after they have become familiar with the tool, they realize that the GUI is a faster way to probe the system.. Clicking in the GUI window is the fastest way to move to a particular spot in the storm environment, but because of limited resolution to precisely position oneself (such as trying to find the coldest temperature perturbation at the surface in the area of heaviest rain and hail) may require navigation in the 3D graphics window. Likewise, finding the winds in the tornado itself may be most easily accomplished by navigating there in the virtual world. Fig. 6 shows a display of wind information collected at a series of points. Although wind information was supplied to the application in u and v component form, the GUI uses arrows of different length to convey speed and direction.
Figure 6: Wind information sampled by the student and displayed on the GUI.
Preliminary studies of the impact of the use of the activity on student learning have been conducted over the previous 2 springs. During spring 2002, the GUI was not available; during 2003, a simple version of the GUI had just been developed, and students could probe for temperature information alone. In each year, surveys and quizzes were distributed to the nearly 400 students enrolled in the introductory meteorology course at ISU (MTEOR 206). One survey was performed at the beginning of the semester to determine students’ interest in various meteorological topics, opinions about science, and initial understanding about severe weather and tornadoes. Because the virtual storm activity itself was only available on PCs in one lab, volunteers were solicited from the class with the promise of extra credit for participation. During both years, between 10-20 students served as a test group for the use of the application. These students were given instructions on how to use the activity and were then sent into the virtual world in teams of 2 to answer a few questions. As mentioned above these questions were tailored to encourage the students to explore the system and discover the pertinent information
After these students had completed the use of the virtual storm, they were given a survey to provide feedback on their experience with the activity. In addition, these students were given a quiz testing their understanding of severe thunderstorms with tornadoes. Later in the semester, after a traditional lecture on severe thunderstorms and tornadoes, the entire class was given the same quiz on their understanding of these topics.
During the first year, the virtual storm group’s scores on the classroom-wide quiz improved by an average of 3.8 points over what they received when taking the quiz immediately after exploring the virtual storm. This result was statistically significant (paired t-test, p=0.0002). The students also had a higher average score on the second quiz than the rest of the class, but the result was not statistically significant, implying the virtual storm by itself was not a good means of teaching about tornadic storms. The purely visual aspect of the activity in this first year (no GUI yet available) may have limited its use as a constructivist tool (students exposed to the virtual storm prior to having any other teaching about severe storm dynamics). Student feedback, although usually positive, did suggest three shortcomings: (i) more information was desired than just what the eye could see, (ii) navigation was cumbersome, and (iii) students often became disoriented.
Some of these shortcomings were addressed in year 2 when the simple GUI was added. The GUI allowed for the addition of other on visual information and the group of students indicated in
surveys that problems with getting disoriented disappeared. The average results from the quizzes were almost identical to the previous years. The students scored an average of 3.5 points higher on the second quiz than on the first. This was again found to be statistically significant (paired t-test, p=0.098 006) Once again there was also not a statically significant difference between the students that used the virtual storm and those that did not. However, variance In scores in the quiz immediately following the virtual storm activity was much less than in year 1, which together with the fact that the mean score was about the same, implies the data probing may have helped all students to do well, and resulted in less dependence of performance on prior knowledge about severe thunderstorms and tornadoes.
5. CONCLUSIONS
A virtual tornadic thunderstorm has been developed to allow student exploration and discovery of storm-scale atmospheric dynamics. The virtual storm has been developed using VR software that allows for widespread dissemination and use on both PCs and immersive systems. The visual realism of the storm and a user-friendly GUI that allows students to collect and display meteorological data permit the entire tool to be used in a wide range of educational settings from K-12 through graduate-level meteorology courses.
Learning outcomes collected during two consecutive years with the Virtual Tornado activity in various stages of development suggest that this tool is best used to complement instruction in the traditional lecture environment. Although most students feel comfortable navigating in a virtual learning environment, they still require guidance to grasp the complexity of a severe thunderstorm system and to understand the causes of the multiple phenomena occurring within the system.
6. ACKNOWLEDGMENTS
This research was funded by NSF CCLI grant DUE0127465.
7. REFERENCES
Bierbaum, A. D., 2000: VR Juggler: a virtual platform for virtual reality application development. Master’s Thesis: Iowa State University.
Cruz-Neira, C., D. Sandin, and T. DeFanti, 1993: Surround-screen Projection-based Virtual Reality: the design and implementation of
the CAVE. SIGGRAPH 93 Conference
Proceedings, 27, 135-142.
Hartling, P. and C. Cruz-Neira, 2003: Scalable graphical user interfaces for virtual environments. Presence: Teleoperation and
Virtual Environments. (in press).
National Research Council, (1996) National
Science Education Standards, National
Academy Press, Washington, D.C. National Science Foundation, (1996) Shaping the
Future: New Expectations for Undergraduate Education in Science, Mathematics,
Engineering, and Technology, (NSF 96-139)
Washington D.C.
Wakimoto, R. M., C. Liu, and H. Cai, 1998: The Garden City, Kansas storm during VORTEX 95. Part I: Overview of the storm’s life cycle and mesocyclogenesis. Mon. Wea. Rev., 126, 372-392.