Abstract So far, results on the dimensionality of the Young Schema-Questionnaire (YSQ) were based on exploratory factor analysis. In this study, confirmatory techniques were used to investigate the latent structure of the YSQ and its measurement invariance across a Dutch clinical (n= 172) and non-clinical (n= 162) sample. Data support the 16 factor structure as originally hypothesized by Young (Young, J. E. (1994). Cognitive therapy for personality disorders: A schema-focused approach(Rev. ed.). Sarasota, FL: Professional Resource Press), including Social Undesirability, which did not appear as a separate factor in earlier studies. Furthermore, results suggest factorial similarity across both samples. Best fit was found for a model in which inter-factor correlations and factor loadings were specified as invariant across samples while error variances were allowed to vary. An additional finding was that the YSQ can be split into two parallel parts. Parallel tests represent the same underlying constructs, and share identical psychometric properties, but contain different items. Their utilization could be highly profitable for research and clinical practice.
Keywords Young Schema-QuestionnaireÆMulti group confirmatory factor analysisÆParallel testsÆMeasurement invariance
Variance-covariance matrices, means, and standard deviations of the observed data in this study can be obtained with the first author.
M. M. Rijkeboer (&)
Department of Clinical Psychology, Utrecht University, Heidelberglaan 1, 3584 CS Utrecht, The Netherlands
e-mail: [email protected] H. van den Bergh
Faculty of Humanities, Utrecht Institute of Linguistics, Utrecht University, Utrecht, The Netherlands
DOI 10.1007/s10608-006-9051-8 O R I G I N A L A R T I C L E
Multiple Group Confirmatory Factor Analysis
of the Young Schema-Questionnaire in a Dutch Clinical
versus Non-clinical Population
Marleen M. RijkeboerÆHuub van den Bergh
Introduction
Most cognitive diathesis-stress models of psychopathology elaborate on the cognitive content-specificity hypothesis as formulated by Beck (1976, 1987; Beck & Emery, 1985; Beck, Freeman, & Associates, 1990), stating that each mental disorder can be charac-terized by a cognitive content specific to that disorder. These cognitive formulations of psychopathology centre mostly on the role of negative automatic thoughts and dys-functional assumptions (for an overview, see Power & Dalgleish, 1997).
Recently, however, attention has shifted to the role of a deeper level of cognitive representation, the unconditional core beliefs or maladaptive schemas, which are held as general vulnerability factors for a broad range of psychopathology (Young, 1994; Young, Klosko, & Weishaar, 2003). Influenced by—among others—Beck (1976), Erikson (1963), and Bowlby (1973, 1980), Young assumes that Early Maladaptive Schemas (EMSs) develop as a result of the interaction of temperament, and ongoing, negative or toxic childhood experiences. As opposed to conditional schema conceptu-alizations (e.g., ‘‘I will be successful, if I try hard enough’’), these EMSs are hypothe-sized to contain broad pervasive and mainly unconditional themes (e.g., ‘‘I am a failure’’) regarding oneself, one’s relationships with others, and the world. EMSs elaborate throughout one’s lifetime into deeply entrenched structures, which are self-perpetuating in nature (Young et al., 2003). They give rise to negative automatic thoughts and high levels of distress. Taking a dimensional view, Young and Klosko (1994) state that schemas are present in every human being, but that they become more rigid and extreme in more symptomatic individuals.
Young identified 16 early maladaptive schemas, which are expressed in the Young Schema-Questionnaire (YSQ, 2nd edn; Young & Brown, 1994). The YSQ consists of 205 items, to be rated by a 6-point Likert subscale ranging from ‘completely untrue’ to ‘describes me perfectly’. All items are grouped, which means that the items of every subscale are placed together.
Research on the YSQ suggests its value for the assessment of personality disorders as well as other clinical disorders, and problems in adjustment. Data reveal strong corre-lations between the scales of the YSQ with personality disorders (Carine, 1997; Hoffart, Versland, & Sexton, 2002; Lee, Taylor, & Dunn, 1999, Petrocelli, Glaser, Calhoun, & Campbell, 2001; Schmidt, Joiner, Young, & Telch, 1995). Specific schemas, as repre-sented by the YSQ, appear to be related to job-burnout among public school teachers (Rittenmyer, 1997), eating attitudes in bulimic psychopathology (Leung, Waller, & Thomas, 1999; Meyer, Leung, Feary, & Mann, 2001; Waller, Dickson, & Ohanian, 2002; Waller, Meyer, & Ohanian, 2001;Waller, Ohanian, Meyer, & Osman, 2000; Waller, Shah, Ohanian, & Elliott, 2001), eating psychopathology in anorexia nervosa (Leung et al., 1999), romantic jealousy (Dobrenski, 2001), alcohol-dependency (Decouvelaere, Graziani, Gackiere-Eraldi, Rusinek, & Hautekeete, 2002), depersonalization disorder (Simeon, Guralnik, Knutelska, & Schmeidler, 2002), depression (Harris & Curtin, 2002; Shah & Waller, 2000; Waller et al., 2001), specific dysfunction in personality and behavioral adjustment in incarcerated women (Loper, 2003), low body satisfaction (Braitman, 2002), and low interpersonal adjustment and marital satisfaction (Freeman, 1999). Furthermore, several studies showed good discriminative power of the YSQ, comparing subjects with specific disorders to non-clinical controls (e.g., Leung et al., 1999; Shah & Waller, 2000; Simeon et al., 2002;Waller et al., 2000; Waller et al., 2001). In all cases the comparison group endorsed lower scores than the clinical group.
All before mentioned results, however, can only be interpreted in a meaningful way, if the YSQ measures the same constructs across different populations. This implies that the schema scales represent unidimensional constructs, and the latent multidimensional structure of the YSQ is invariant across both clinical and non-clinical samples.
Several studies have been conducted to test the factor structure of the original YSQ, all using exploratory techniques. A first study was performed by Schmidt et al. (1995), investigating the dimensionality of the YSQ in both a clinical and non-clinical sample separately. In the non-clinical sample (n =1129; students) 12 of the factors originally proposed by Young (1994) were found. The clinical sample (n =187; outpatients) yielded 15 out of the 16 hypothesized schemas. The only subscale that failed to emerge as a separate factor was ‘Social Undesirability’. Lee and colleagues (1999) replicated this study in a large clinical sample of 433 in- and outpatients. Comparable results to the Schmidt et al. (1995) study were found. Fourteen independent factors were obtained. Again the EMS scale ‘Social Undesirability’ did not emerge as an independent factor. In addition, the scale ‘Emotional Inhibition’ emerged as two independent factors, ‘Emo-tional Constriction’ and ‘Fear of Losing Control’. In reaction to the findings of these two studies, in subsequent research on the YSQ in most cases the ‘Social Undesirability’ subscale has been dropped from the analysis.
In order to improve the efficiency of the YSQ, Young (1998) formulated a YSQ Short Form (YSQ-S) including 75 items divided into 15 subscales, which correspond to the factors as found by Schmidt and colleagues (1995). Each YSQ-S subscale was con-structed by selecting the first five items with highest loadings from each corresponding factor. Welburn, Coristine, Dagg, Pontefract, and Jordan (2002) investigated the factor structure of the YSQ-S in a clinical sample (n =196), using PCA. All 15 factors were extracted, and 70 of the 75 items loaded exactly with the theoretical structure of the instrument. The comparability of the long (YSQ-L) and short versions of the YSQ was investigated by Waller, Meyer, and Ohanian (2001) and Stopa, Thorne, Waters, and Preston (2001), administering the YSQ-L from which the YSQ-S was extracted. In both studies the scores on the two versions of the YSQ were significantly correlated with each other. Alpha levels of most scales of both forms were adequate (a> .70), but significant mean differences between the YSQ-L and YSQ-S were found on 5 to 6 scales by Waller and colleagues (2001), and on 3 scales by Stopa et al. (2001). Yet, none of the differences were large.
Results of all before mentioned studies seem to indicate adequate psychometric properties for both the YSQ-L and the YSQ-S. Nevertheless, a few methodological aspects need to be considered.
First, in search of the underlying multidimensional structure of the YSQ researchers have used exploratory factor analysis exclusively. Exploratory techniques, however, can never answer definitively questions regarding the latent structure of a set of variables, since exploratory factor analysis can only suggest structures, which sub-sequently require confirmation by confirmatory factor analysis (Fabrigar, Wegener, MacCallum, & Strahan, 1999; Mulaik, 1987).
Second, all factor analyses are performed within the different populations separately. Hence, no explicit test of the invariance of the dimensionality of the YSQ-L and YSQ-S across populations has been performed. Multiple groups confirmatory analysis (MGCFA) does allow for the testing of a hypothesized factor structure in different populations simultaneously (Floyd & Widaman, 1995; Jo¨reskog & So¨rbom, 1993; MacCallum & Austin, 2000). This is therefore a helpful technique in identifying measurement invariance (Meredith, 1993).
Third, the YSQ-S was constructed by selecting the first five items with highest loadings from each corresponding factor as found by Schmidt et al. (1995). Clark and Watson (1995) warn against this procedure, pointing out that ‘top items’ may not yield the subscale that best represents the target construct. Moreover, since no study used CFA to confirm the factor solution as found by Schmidt et al. (1995) and Lee et al. (1999) and subsequent studies on the YSQ-L and YSQ-S excluded the subscale ‘Social Undesirability’ from their analyses, it could be the case that this subscale has been dropped prematurely.
Fourth, both forms of the YSQ contain grouped items, so the items of every subscale are placed together. This can seriously bias the interpretability of the found factor solution. McFarland, Ryan, and Ellis (2002), for example, tested the effect of item placement on psychometric results. By comparing two versions of a personality inven-tory (a randomized format in which the items are interspersed on the test across sub-scales and a grouped format) the results provide evidence that the two test versions revealed different factor structures and that a randomized format can lead to more sound psychometric properties of the constructs being measured. Moreover, with a randomized format effects due to response tendency are minimized.
Thus, a key aim of the present study was to replicate results on the multidimensional latent structure of the original YSQ containing all 16 hypothesized schemas (2nd ed.; Young & Brown, 1994) using confirmatory techniques based on structural equation modeling (Bollen, 1989). To investigate measurement invariance across a clinical and non-clinical sample the factor structure was analyzed in both samples simultaneously. A randomized format of the YSQ was used.
Method
Participants
After analyzing missing value patterns and removal of cases with more than 10% missing values (n= 14), the remaining total sample consisted of 334 participants.
The student sample (n= 162), representing a non-clinical population, was composed of 27 men and 135 women, with a mean age of 23.5 years (SD= 6.76; age range 18–55). Within this sample 40.1% was single and educational level was high. All were enrolled in undergraduate psychology courses at Utrecht University in the Netherlands.
The patient sample (n= 172) consisted of 75 men and 97 women, with a mean age of 33.9 years (SD= 10.75; age range 18–74). Of these patients 47.8% were single, 47.1% had graduated from college, while the remaining 52.9% were educated at lower levels. The patients were admitted to five psychiatric institutions in the Netherlands and par-ticipated in a treatment program for personality disorders. All were screened by psy-chiatrists or clinical psychologists. The most common problems on Axis I were mood disorders (major depressive disorder, dysthymia), anxiety disorders (post-traumatic stress disorder, obsessive–compulsive disorder, panic disorder with or without agora-phobia, social phobia), eating disorders, identity disorders, and adjustment disorders. All patients presented at least several Axis II criteria (American Psychiatric Associa-tion, 1994) of which 16% did not meet the threshold for a personality disorder classi-fication, 5% was classified within cluster A, 27% within cluster B, 19% within cluster C, 29% received the diagnosis Not Otherwise Specified, and of 4% the diagnosis on Axis II
was provisional. Patients with psychotic symptoms and cognitive disorders were not included in the study.
Measure
Both samples completed the Dutch version of the original Young Schema-Questionnaire. The instrument was back translated according to standard procedures (van de Vijver & Hambleton, 1996). Two independent bi-lingual professionals conducted the translations. After incorporation of comments of colleagues and non-psychologists the order of items was randomized in order to minimize response tendencies. Young, author of the original version, authorized the Dutch version (Schema-Vragenlijst; Sterk & Rijkeboer, 1997). Each of the 205 items is rated using a 6-point Likert subscale ranging from ‘completely untrue’ to ‘describes me perfectly’. The overall score of each scale is calculated from the mean of the items in that scale. In all cases a higher score reflects a more maladaptive, detrimental core belief.
Procedure and data analysis
Reliability and discriminative power
First, the reliability was estimated by computing the internal consistency of each original schema scale in both samples. In order to test the discriminative power, mean differ-ences of the scale scores between the samples were compared, usingt-tests.
Parallel item parcels
As a second step the multidimensionality of the YSQ was tested. Because of the large amount of items comprising the YSQ, two parallel parcels were formed per subscale with an equal number of items (Kishton & Widaman, 1994), using the method of ‘matched random subtests’ as described by Gulliksen (1950). In the end 32 subscales with an optimal subtest configuration were formed, that is, subscales with identical means, standard deviations, and reliabilities (see Appendix 1 for parallel subscales). Measurement models testing multidimensionality
The hypothesized latent structure of the YSQ, composing of 16 factors as proposed by Young and Brown (1994), was analyzed in both samples simultaneously, conducting multiple groups confirmatory factor analyses (MGCFA’s) with the use of LISREL 8.51 (Jo¨reskog & So¨rbom, 2001) by means of Maximum Likelihood estimation. The two parallel item parcels served as indicators for each factor. Since our goal was to examine latent schema variables which determine their indicators (a so-called effect-indicator model: Bollen & Lennox, 1991; Foster & Cone, 1995) the correlation matrix was used. This is simply a standardized covariation matrix, with clear interpretational advantages (Kelloway, 1998). Yet, the degrees of freedom provided by LISREL need to be adjusted (van den Bergh & Eiting, 1989).
Bothinvariantas well asvariantrestrictions were placed on the parameters (Fig.1) in order to create overidentified models (Bollen, 1989). Invariant restrictions were imposed on parameters withinboth populations. In order to create parallelism, equal factor loadings and residuals were specified for each parcel pair. Hence, the indicators of a latent factor or schema have identical true score and error variances within a specific
Fig. 1 Meas ure ment model s investi gating the mult idimensi onality of the YSQ
sample. The variant restrictions were linked to comparisons of parameters across groups. Four nested models were specified to investigate the factor structure (Jo¨reskog, 1971), each posing varying constraints on the possible differences between the samples1.
Fit indices
To evaluate the absolute fit of these relatively complex models, several subjective indices of goodness-of-fit were used. First thev2statistic was inspected, which Jo¨resko¨g and So¨rbom (1989) advise to evaluate in comparison with the degrees of freedom. Mueller (1996) suggests as a ‘rule of thumb’ criterion for good fit:v2/df < 2. In addition to this ratio several other fit indices were used. Following recommendations by Hu and Bentler (1998) the CFI, NNFI, and RMSEA were included. For comparison of the relative fit of the four nested models, thev2differencetest was used. The preferred model is the most efficient one, with respect to both goodness-of-fit and parsimony.
Power
Because restrictions were imposed on the parameters both within and across samples, the total amount of estimated parameters declined (Model I:152 parameters, Model II: 168; Model III: 184; Model IV: 304). Therefore, the ratio subjects to estimated parameters ranged from 2.2 to 1.1. With hindsight the power of all likelihood ratio tests (based on the non-centrality parameter) was determined to be over .90, NCP‡196.6; df‡720; power > .90 (Saris & Stronkhorst, 1984). Hence, the power of all tests was high.
Results
Reliability and discriminative power of the original scales of the YSQ
Table1presents Cronbach’s alpha for the original scales of the YSQ. All schema scales showed adequate to high internal consistency, irrespective of the population being assessed,aranging from .73 to .95. Highest internal consistency values were found in the clinical sample, for which the YSQ was originally designed. All scales in both samples exceeded a level of minimum integrity of .70 as suggested by Nunnally and Bernstein (1994). Furthermore, as shown in Table1, highest mean scores were found in the clinical sample, as was hypothesized. Results from t-tests for independent samples, with Levene’s correction in case of unequality of variances, revealed significant mean score difference for all scales. In all analyses the more stringent criterion of the Bonferroni’s revisedp value (.05 divided by 16) was used (Grove & Andreason, 1982). Moreover, after removal of the effect of gender, educational level and age, using ANCOVA, the mean differences between the two samples remained significant for all scales,F‡12.86, p < .001. This could imply that the 16 schema scales of the YSQ show high iscriminative power. Note however, that the comparisons can only be meaningful if scales measure the same construct within both populations, and do so with equal true score as well as error variances.
1 Interested readers are invited to email the first author for a detailed report on the parcelling and MGCFA procedure used.
Inspection of the multidimensionality or factor structure of the YSQ
First, the absolute fit of the four nested models considering this overall structure was tested (Table2). Models were tested in both groups simultaneously to allow for com-parison of parameter estimates across samples. The degrees of freedom of each mea-surement model were adjusted (dfminus 32; see van den Bergh & Eiting, 1989). All models yieldedv2/dfvalues lower than 2. Furthermore, other practical fit indices showed an adequate fit to the data. RMSEA values were below .07 for all models. Tests of significance revealed that most certainly all RMSEA values were even less than .05, p ranging from .87 to 1.00. CFI and NNFI coefficients were also indicative of a good fit, CFI and NNFI‡.95, except for the semi-parallel model, although its values closely reached cut-of points, NNFI = .94, CFI = .94.
Table 1 Descriptives, reliability and discriminative validity of the original subscales of the YSQ
Original subscales
Ni
Sample t-test
Non-clinical Clinical Overall Non-clinical vs Clinical a M SD a M SD a M SD t df p Emotional deprivation 9 .93 1.56 .75 .91 3.26 1.29 .95 2.43 1.36 14.84 276.13 < .001 Abandonment 18 .88 1.92 .61 .91 3.31 1.05 .94 2.63 1.11 14.90 271.55 < .001 Mistrust/Abuse 17 .91 1.86 .64 .91 3.20 1.03 .94 2.55 1.09 14.24 282.47 < .001 Social isolation 10 .86 1.92 .72 .91 3.50 1.25 .93 2.73 1.29 14.21 269.87 < .001 Defectiveness/Shame 15 .83 1.48 .42 .92 2.83 1.09 .94 2.17 1.07 14.90 215.37 < .001 Social undesirability 9 .73 1.84 .52 .81 2.97 1.01 .86 2.42 .99 12.81 218.79 < .001 Failure to achieve 9 .83 1.77 .56 .90 3.08 1.21 .92 2.44 1.15 12.70 237.21 < .001 Dependence/Incompetence 15 .86 1.74 .49 .91 2.97 1.00 .94 2.38 1.00 14.34 248.13 < .001 Vulnerability 14 .82 1.76 .53 .88 2.74 1.00 .90 2.26 .94 11.20 256.93 < .001 Enmeshment 11 .85 1.60 .57 .89 2.64 1.11 .90 2.14 1.03 10.80 256.25 < .001 Subjugation 10 .79 1.97 .58 .86 3.32 1.07 .90 2.66 1.10 14.37 262.63 < .001 Self-sacrifice 17 .85 2.62 .62 .88 3.69 .92 .91 3.18 .95 12.35 293.13 < .001 Emotional inhibition 9 .79 1.72 .56 .82 3.27 1.07 .90 2.52 1.16 16.62 260.65 < .001 Unrelenting standards 16 .88 2.42 .69 .89 3.33 1.03 .91 2.88 .99 9.31 290.52 < .001 Entitlement 11 .77 2.33 .57 .74 2.69 .74 .76 2.52 .69 5.00 314.23 < .001 Insufficient self-control 15 .84 2.19 .62 .88 3.14 .96 .90 2.68 .94 10.74 285.45 < .001
Note: Ni = number of items;a= internal consistency;M= mean,SD =standard deviation;t=T-value;
df= degrees of freedom;p= level of significance
Table 2 Four nested models testing the factor structure of the YSQ in two samples simultaneously
(N= 334) withMLestimation
Models Fit-indices
v2 df* p v2/df NNFI CFI RMSEA (p)
I. Semi-parallel 1507.93 872 < .001 1.73 .94 .94 .065 (.87) II. Tau-equivalent 1143.83 856 < .001 1.34 .97 .98 .035 (1.00) III. Congeneric 1123.70 840 < .001 1.34 .97 .98 .034 (1.00) IV. Non-congeneric 1019.19 720 < .001 1.42 .97 .98 .039 (1.00)
Note:v2= chi-square statistic;df*= adjusted degrees of freedom;p= level of significance; NNFI = Non-Normed Fit Index; CFI = Comparitive Fit Index; RMSEA = Root Mean Square of Approximation
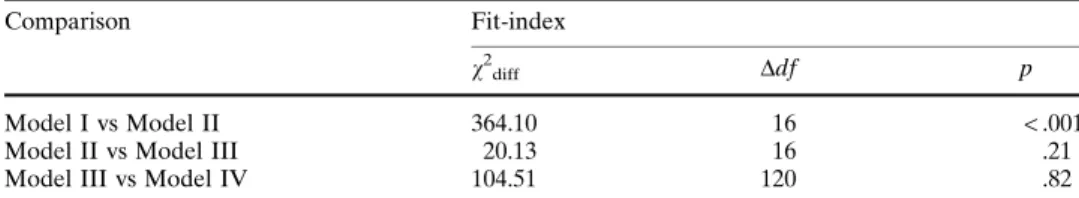
To be able to decide which model is to be preferred, chi-square differences between the nested models (Table3) were inspected, because they reveal more detailed information on estimated parameters. Comparison of a semi-parallel model and a tau-equivalent model indicated that freeing residuals across samples resulted in a significant improvement of fit, v2diff (16) = 364.10,p < .001. Comparison of a tau-equivalent and congeneric model, in which in addition the factor loadings were al-lowed to vary across samples, revealed no significant improvement of fit, v2diff (16) = 20.13, p= .21. Finally, the comparison of a congerenic and non-congeneric model, in which the core demand of an equal factor structure across samples was dropped, neither resulted in an improvement of the fit to the data, v2diff (120) = 104.51, p= .82.
Results suggested that, although all models were capable of reproducing the data, a tau-equivalent model was most parsimonious, since it contained the least amount of parameters while retaining the best model fit. In this model inter-factor correlations and factor loadings were set to be equal across the clinical and non-clinical sample, whereas error variances were allowed to vary.
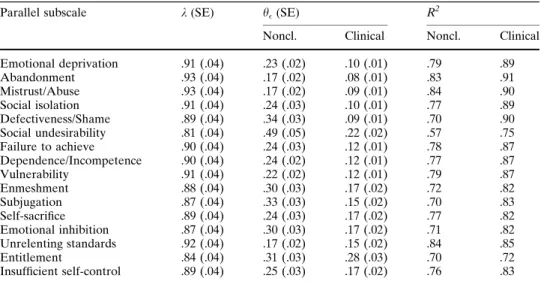
Parameters estimated within a tau-equivalent model
Considering the convergent validity of indicators, factor loadings (Table4) of parallel subscale sum scores of the YSQ were high,kranging from .81 to .93. All factor loadings were significant (k> 2*SE; see Anderson & Gerbing, 1988). The amount of variance explained by each factor was substantial,R2ranging from .70 to .91, except forSocial Undesirabilitywhich, within the non-clinical sample, explained only 57% of the variance in its parallel indicators. Within the clinical sample, however, the squared multiple correlation was far more adequate,R2= .75. The amount of variance explained by every factor, or, in this case, the reliability of each parallel test (Long, 1983) was higher within the clinical sample, for which the questionnaire was originally designed.
The inter-factor correlations,rranging from .37 to .89, and standard errors for the 16 factors as found in the preferred tau-equivalent model, are shown in Table5. Four factors were moderately related to the other factors. Most correlations of Entitlement with the remaining factors remained below .55. For Insufficient Self-Control and Unrelenting Standards most values did not exceed .68. For Enmeshment most inter-factor correlations remained below .70. Most inter-factors, however, revealed high positive inter-correlations, indicating a strong common variation between these factors. Yet, in no case the confidence interval (± 2*SE; see Anderson & Gerbing, 1988) around the correlation estimate between two factors included 1.0, which means that factors rep-resented distinct constructs.
Table 3 Comparison of nested models testing the factor structure of the YSQ
Comparison Fit-index
v2
diff Ddf p
Model I vs Model II 364.10 16 < .001
Model II vs Model III 20.13 16 .21
Model III vs Model IV 104.51 120 .82
Note: Model I = semi-parallel; Model II = tau-equivalent; Model III = congeneric; Model IV = non-congeneric;v2
diff= chi-square difference;Ddf= difference in degrees of freedom; p =level of signifi-cance;N =334
Discussion
In this study confirmatory factor analysis was used to examine the dimensional structure of the original YSQ in a Dutch clinical and non-clinical sample simultaneously. By specifying four alternative models in advance, capitalization upon chance was mini-mized. Note that a good fit implies that, according to the data, no evidence is found that a specific measurement model is incorrect. Hence support for the model is assumed.
The most important finding of this study is the replication in both samples of all 16 schema factors as originally hypothesized by Young (1994). Data provide most support for a tau-equivalent model, in which inter-factor correlations and factor loadings are invariant across the samples, whereas error variances are allowed to vary. In other words, the YSQ measures the same constructs within both samples. All factor loadings are high and significant, indicating good convergent validity of the parallel subscales of the YSQ. Moreover, all factors show adequate discriminant validity, suggesting that the 16 factors represent significantly distinct constructs. Yet, the precision with which these constructs are measured, differs across groups. The reliability of the subscales is higher in the patient sample for which the YSQ was originally designed. Still, except forSocial Undesirability, all schema scales have adequate to high reliability coefficients in both samples. The present results therefore provide support for the unidimensionality of all schema scales as well as their measurement equivalence across a clinical and non-clinical population.
These findings, however, are in contrast with earlier work of Schmidt et al. (1995) and Lee et al. (1999), who found only 12 of the original factors in a student sample and 15 factors in clinical samples. In addition to an explanation in terms of the different, more sophisticated statistical techniques, this discrepancy could be accounted for by the dif-ference in item placement. Randomized formats, as used in this study, are likely to produce more sound psychometric properties (McFarland et al., 2002).
Table 4 Factor loadings, residuals, and reliability for a Tau-equivalent model of the parallel subscales of
the YSQ
Parallel subscale k(SE) h(SE) R
2
Noncl. Clinical Noncl. Clinical Emotional deprivation .91 (.04) .23 (.02) .10 (.01) .79 .89 Abandonment .93 (.04) .17 (.02) .08 (.01) .83 .91 Mistrust/Abuse .93 (.04) .17 (.02) .09 (.01) .84 .90 Social isolation .91 (.04) .24 (.03) .10 (.01) .77 .89 Defectiveness/Shame .89 (.04) .34 (.03) .09 (.01) .70 .90 Social undesirability .81 (.04) .49 (.05) .22 (.02) .57 .75 Failure to achieve .90 (.04) .24 (.03) .12 (.01) .78 .87 Dependence/Incompetence .90 (.04) .24 (.02) .12 (.01) .77 .87 Vulnerability .91 (.04) .22 (.02) .12 (.01) .79 .87 Enmeshment .88 (.04) .30 (.03) .17 (.02) .72 .82 Subjugation .87 (.04) .33 (.03) .15 (.02) .70 .83 Self-sacrifice .89 (.04) .24 (.03) .17 (.02) .77 .82 Emotional inhibition .87 (.04) .30 (.03) .17 (.02) .71 .82 Unrelenting standards .92 (.04) .17 (.02) .15 (.02) .84 .85 Entitlement .84 (.04) .31 (.03) .28 (.03) .70 .72 Insufficient self-control .89 (.04) .25 (.03) .17 (.02) .76 .83
Note: Noncl. = non-clinical;k= factor loading;SE= standard error;h= residual;R2= squared multiple
Ta ble 5 Inter correla tions and st andard erro rs (in par enthese s) betwe en the 16 factors (N = 334) with in a T a u-Equi valent Model Para llel subscal e 1234 567891 0 1 1 1 2 1 3 1 4 1 5 1 6 1. E motional depri vation 1.00 2. Aba ndonm ent .77 (.03) 1.00 3. Mistrust/ Abuse .74 (.03) .78 (.03) 1.00 4. So cial isola tion .80 (.03) .81 (.02) .81 (.02) 1.00 5. Def ectivene ss/Sh ame .76 (.03) .85 (.02) .75 (.03) .82 (.02) 1.00 6. So cial unde sirabilit y .70 (.04) .81 (.03) .68 (.04) .81 (.03) .89 (.02) 1.00 7. Fai lure to achiev e .68 (.04) .77 (.03) .63 (.04) .80 (.03) .81 (.03) .82 (.03) 1.00 8. Dep enden ce/Inco mpete nce .65 (.04) .83 (.02) .66 (.04) .79 (.03) .81 (.03) .82 (.03) .86 (.02) 1.00 9. Vuln erabili ty .64 (.04) .79 (.03) .72 (.03) .77 (.03) .69 (.03) .73 (.04) .74 (.03) .77 (.03) 1.00 10. Enme shme nt .54 (.05) .68 (.04) .57 (.04) .65 (.04) .68 (.04) .71 (.04) .68 (.04) .74 (.03) .64 (.04) 1.00 11. Subj ugatio n .73 (.03) .86 (.02) .75 (.03) .83 (.02) .87 (.02) .84 (.03) .78 (.03) .84 (.02) .75 (.03) .81 (.03) 1.00 12. Self -sacrifice .67 (.04) .77 (.03) .70 (.03) .74 (.03) .79 (.03) .72 (.04) .69 (.04) .65 (.04) .63 (.04) .66 (.04) .88 (.02) 1.00 13. Em otional inhibi tion .76 (.03) .82 (.03) .73 (.03) .81 (.03) .83 (.02) .81 (.03) .72 (.03) .74 (.03) .76 (.03) .70 (.04) .88 (.02) .75 (.03) 1.00 14. Unre lenting st andards .55 (.04) .64 (.04) .58 (.04) .66 (.04) .66 (.04) .68 (.04) .62 (.04) .59 (.04) .64 (.04) .59 (.04) .71 (.03) .73 (.03) .65 (.04) 1.00 15. Enti tleme nt .37 (.06) .54 (.05) .59 (.04) .55 (.05) .46 (.05) .49 (.05) .46 (.05) .54 (.05) .58 (.04) .51 (.05) .54 (.05) .47 (.05) .53 (.05) .58 (.04) 1.00 16. Insuf ficien t self-co ntrol .50 (.05) .67 (.04) .62 (.04) .67 (.04) .59 (.04) .65 (.04) .71 (.03) .78 (.03) .67 (.04) .59 (.04) .67 (.04) .62 (.04) .64 (.04) .53 (.05) .68 (.04) 1.00
A resemblance with previous studies, to a certain extent, is the problem faced with the factorSocial Undesirability. In the studies by Schmidt et al. (1995) and Lee et al. (1999) this distinct latent variable did not appear in any sample. Although the present data do not provide evidence against the scale’s unidimensionality and invariance across samples, the amount of variance this factor explains in its indicators within the student sample is unsatisfactory. Nevertheless, these findings suggest that the exclusion of Social Unde-sirabilityfrom the assessment ofclinicalpopulations may have been too premature. In fact, possible important diagnostic information on social anxiety might be lost. Fur-thermore, this specific early maladaptive schema may be central to the avoidant per-sonality disorder, next toEmotional Inhibition(Jovev & Jackson, 2004). Future research should be conducted to improve the measurement model of the YSQ. Since the MGCFA’s were performed on the subscale-level, research that is conducted on the item-to-scale level may be necessary to refine the model. The found contrast in reliability coefficients forSocial Undesirabilityacross groups may be due to systematic error. Item bias analysis could give more insight in a possible differential functioning of the items comprising this—and other—scales of the YSQ for patients and non-clinical individuals. Since no evidence was found against the measurement equivalence of the YSQ at the scale-level, the endorsement of scores on these 16 original schema scales within both samples could be compared. Results suggest significant higher mean scores for the patient sample, which resembles results from other studies (e.g., Lee et al., 1999; Leung et al., 1999; Shah & Waller, 2000; Simeon et al., 2002; Waller et al., 2000, 2001). These differences in endorsement remain significant for all scales after removal of the effect of gender, educational level, and age. Hence, discriminative power of most original scales of the YSQ is adequate. Moreover, further research on the parallel versions of the YSQ suggests high sensitivity in predicting the presence and absence of psychopathology for both versions (Rijkeboer, van den Bergh, & van den Bout, 2005).
The aforementioned findings are in line with the hypothesis stated by Young and Klosko (1994) that early maladaptive schemas are present in every human being, but that they become more extreme in more symptomatic individuals. Results suggest that the YSQ identifies a large range of early maladaptive schemas irrespective of the amount of psychopathology. Furthermore, the findings may indicate the use of profiles of distorted thinking as a useful aid for assessment and treatment planning in future research. Identification of these schema profiles, which are related to specific psycho-pathology might be warranted, and their subsequent use may help to confirm diagnosis. For example, in a recent study by Jovev and Jackson (2004) borderline PD was iden-tified on the basis of Dependence/Incompetence, Defectiveness/Shame, and Abandon-ment. The obsessive–compulsive PD was differentiated by Unrelenting Standards, whereas the avoidant PD was associated withEmotional Inhibition.These results sug-gest that there are different patterns of EMS’s across different PD’s, which makes future research into a broader range of PD’s highly interesting.
An additional finding of the present study is that the item pool of the original YSQ can be split into two parallel parts. This has two major clinical advantages. Besides the improvement of efficiency, a clear advantage is the possibility to employ these parallel versions in experimental studies and clinical practice to measure schema change. Parallel tests, namely, represent the same underlying constructs and share identical psychometric properties, but contain different items (Gulliksen, 1950). By alternate administration of these parallel versions of the YSQ at pre- and post-treatment time points, bias due to recollection can be reduced. Note that, although the utilization of parallel tests could be highly profitable, their development is still quite unusual in the field of social sciences.
A limitation of this study is the use of the Dutch version of the YSQ. Replication of the factor structure within other independent samples, with different cultural back-grounds and languages, is recommended. Furthermore, it must be acknowledged that in this study the participants representing a non-clinical population are relatively high-functioning, resilient, young, and mostly female adults. Generalization of the findings to a more divers, non-student sample needs to be determined empirically. Finally, the clinical sample consisted largely of patients suffering from personality disorders. Future research on the factor structure of the YSQ with patients predominantly diagnosed on Axis I would make a useful contribution to our knowledge of the schema model.
In sum, this study aimed at the investigation of the reliability, dimensionality, and measurement invariance of the YSQ in a Dutch clinical and non-clinical population. Results from the present study are promising. Yet, further examination of the psy-chometric properties concerning the internal and external validity of all 16 schema scales of the YSQ and their parallel versions is warranted.
Acknowledgments The authors thank Jan van den Bout, Arnoud Arntz, Luk Gijs, and three
anony-mous reviewers for their valuable comments on earlier drafts of this paper.
Appendix 1
Parallel Subscales of the Dutch YSQ (with Item Numbers from Original YSQ)
Emotional Deprivation’ Emotional Deprivation’’
1, 5, 6, 7 3, 4, 8, 9 item 2 out
Abandonment’ Abandonment’’
10, 11, 13, 14, 19, 20, 22, 23, 26 12, 15, 16, 17, 18, 21, 24, 25, 27 no items out
Mistrust/Abuse’ Mistrust/Abuse’’
28, 29, 31, 34, 35, 36, 40, 43 30, 32, 33, 37, 38, 41, 42, 44 item 39 out
Social Isolation’ Social Isolation’’
47, 48, 50, 52, 54 45, 46, 49, 51, 53 no items out
Defectiveness/Shame’ Defectiveness/Shame’’
55, 57, 59, 61, 64, 65, 68 56, 58, 60, 62, 63, 66, 67 item 69 out
Social Undesirability’ Social Undesirability’’
70, 72, 77, 78 71, 73, 74, 76 item 75 out
Failure to Achieve’ Failure to Achieve’’
80, 81, 86, 87 82, 83, 84, 85 item 79 out
Functional Dependence/Incompetence’ Functional Dependence/Incompetence’’
89, 91, 95, 96, 97, 99, 102 88, 90, 92, 93, 94, 98, 101 item 100 out Vulnerability’ Vulnerability’’ 103, 104, 105, 107, 109, 110, 111 106, 108, 112, 113, 114, 115, 116 no items out Enmeshment’ Enmeshment’’ 117, 120, 121, 122, 125 118, 119, 124, 126, 127 item 123 out Subjugation’ Subjugation’’ 131, 132, 133, 136, 137 128, 129, 130, 134, 135 no items out Self-Sacrifice’ Self-Sacrifice’’ 140, 143, 145, 148, 149, 150, 151, 152 138, 139, 141, 142, 144, 147, 153, 154 item 146 out
Emotional Inhibition’ Emotional Inhibition’’
157, 158, 159, 162 155, 156, 161, 163 item 160 out
Unrelenting Standards’ Unrelenting Standards’’
165, 167, 169, 170, 172, 175, 177, 179 164, 166, 168, 171, 173, 174, 176, 178 no items out
Entitlement’ Entitlement’’
180, 183, 185, 186, 188 181, 182, 187, 189, 190 item 184 out
Insufficient Self-Control/Discipline’ Insufficient Self-Control/Discipline’’
References
American Psychiatric Association. (1994).Diagnostic and statistical manual of mental disorders(4th ed.). Washington, DC: Author.
Anderson, J. C., & Gerbing, D. W. (1988). Structural equation modeling in practice: A review and recommended two-step approach.Psychological Bulletin, 3, 411–423.
Beck, A. T. (1976).Cognitive therapy and the emotional disorders. New York: Meridian.
Beck, A. T. (1987). Cognitive models of depression.Journal of Cognitive Psychotherapy: An Interna-tional Quarterly, 1, 5–37.
Beck, A. T., & Emery, G. (1985).Anxiety disorders and phobias: A cognitive perspective. New York: Basic Books.
Beck, A. T., Freeman, A, & Associates. (1990).Cognitive therapy of personality disorders. New York: Guilford Press.
van den Bergh, H., & Eiting, M. H. (1989). A method of estimating rater reliability.Journal of Edu-cational Measurement, 26, 29–40.
Bollen, K. A. (1989).Structural equations with latent variables. New York: John Wiley & Sons. Bollen, K. A., & Lennox, R. (1991). Conventional wisdom on measurement: A structural equation
perspective.Psychological Bulletin, 110, 305–314.
Bowlby, J. (1973).Attachment and loss: Vol. 2. Separation. New York: Basic Books.
Bowlby, J. (1980).Attachment and loss: Vol. 3. Loss, sadness, and depression. New York: Basic Books. Braitman, K. A. (2002). Relationships among body satisfaction, appearance schemas, early maladaptive schemas, and sociocultural attitudes towards appearance.Dissertation Abstracts International, 62 (10-B), 4835.
Carine, B. E. (1997). Assessing personal and interpersonal schemata associated with Axis-II cluster B personality disorders: An integrated perspective.Dissertation Abstracts International, 58(01), 410B. Clark, L. A., & Watson, D. (1995). Constructing validity: Basic issues in objective subscale development.
Psychological Assessment, 7, 309–319.
Decouvelaere, F., Graziani, P., Gackiere-Eraldi, D., Rusinek, S., & Hautekeete, M. (2002). Hypothese de l’existence et de l’evolution de schemas cognitifs mal adaptes chez l’alcool-dependant [Hypothesis of existence and development of early maladaptive schemas in alcohol-dependent patients].Journal de Therapie Comportementale et Cognitive, 12, 43–48.
Dobrenski, R. A. (2001). Romantic jealousy: Symptoms, schemas, and attachment.Dissertation Abstracts International, 62(6-B), 2954.
Erikson, E. H. (1963).Childhood and society. New York: Norton.
Fabrigar, L. R., Wegener, D. T., MacCallum, R. C., & Strahan, E. J. (1999). Evaluating the use of exploratory factor analysis in psychological research.Psychological Methods, 4, 272–299.
Floyd, F. J., & Widaman, K. F. (1995). Factor analysis in the development and refinement of clinical assessment instruments.Psychological Assessment, 7, 286–299.
Foster, S. L., & Cone, J. D. (1995). Validity issues in clinical assessment.Psychological Assessment, 7, 248–260.
Freeman, N. (1999). Constructive thinking and early maladaptive schemas as predictors of interpersonal adjustment and marital satisfaction.Dissertation Abstracts International, 59(9-B), 5081.
Grove, W. M., & Andreason, N. C. (1982). Simultaneous tests of many hypotheses in exploratory research.Journal of Nervous and Mental Disease, 170, 3–8.
Gulliksen, H. (1950).Theory of mental tests. New York: Wiley.
Harris, A. E., & Curtin, L. (2002). Parental perceptions, early maladaptive schemas, and depressive symptoms in young adults.Cognitive Therapy and Research, 26, 405–416.
Hoffart, A., Versland, S., & Sexton, H. (2002). Self-understanding, empathy, guided-discovery, and schema belief in schema-focused cognitive therapy of personality disorders: A process-outcome study.Cognitive Therapy and Research, 26, 199–219.
Hu, L., & Bentler, P. M. (1998). Fit indices in covariance structure modelling: Sensitivity to underpa-rameterized model misspecification.Psychological Methods, 3, 424–453.
Jo¨reskog, K. G. (1971). Statistical analysis of sets of congeneric tests.Psychometrika, 36, 109–132. Jo¨reskog, K., & So¨rbom, D. (1989).LISREL 7: A guide to the program and applications(2nd ed.).
Chicago: SPSS.
Jo¨reskog, K. G., & So¨rbom, D. (1993).LISREL 8: Structural equation modeling with the SIMPLIS command language. Chicago: Scientific Software International.
Jo¨reskog, K. G., & So¨rbom, D. (2001).LISREL 8.51. Chicago: Scientific Software International. Jovev, M., & Jackson, H. J. (2004). Early maladaptive schemas in personality disordered individuals.
Kelloway, E. K. (1998).Using LISREL for structural equation modeling. A researcher’s guide. Thousand Oaks, CA: Sage Publications.
Kishton, J. M., & Widaman, K. F. (1994). Unidimensional versus domain representative parcelling of questionnaire items: An empirical example.Educational and Psychological Measurement, 54, 757– 765.
Lee, C. W., Taylor, G., & Dunn, J. (1999). Factor structure of the Schema-Questionnaire in a large clinical sample.Cognitive Therapy and Research, 23, 441–451.
Leung, N., Waller, G., & Thomas, G. (1999). Core beliefs in anorexic and bulimic women.Journal of Nervous and Mental Disease, 187, 736–741.
Long, J. S. (1983).Confirmatory factor analysis. A preface to LISREL. Newbury Park: Sage.
Loper, A. B. (2003). The relationship of maladaptive beliefs to personality and behavioral adjustment among incarcerated women.Journal of Cognitive Psychotherapy, 17, 253–266.
MacCallum, R. C., & Austin, J. T. (2000). Applications of structural equation modeling in psychological research.Annual Review of Psychology, 51, 201–226.
McFarland, L. A., Ryan, A. M., & Ellis, A. (2002). Item placement on a personality measure: Effects on faking behavior and test measurement properties.Journal of Personality Assessment, 78, 348–369. Meredith, W. (1993). Measurement invariance, factor analysis and factorial invariance.Psychometrika,
58, 525–543.
Meyer, C., Leung, N., Feary, R., & Mann, B. (2001). Core beliefs and bulimic symptomatology in non-eating-disordered women: The mediating role of borderline characteristics.International Journal of Eating Disorders, 30, 434–440.
Mueller, R. O. (1996).Basic principles of structural equation modeling. New York: Springer.
Mulaik, S. A. (1987). A brief history of the philosophical foundations of exploratory factor analysis.
Multivariate Behavioral Research, 22, 267–305.
Nunnally, J. C., & Bernstein, I. H. (1994).Psychometric theory(3rd ed.). New York: McGraw-Hill. Petrocelli, J. V., Glaser, B. A., Calhoun, G. B., & Campbell, L. F. (2001). Early maladaptive schemas of
personality disorder subtypes.Journal of Personality Disorders, 15, 546–559.
Power, M., & Dalgleish, T. (1997).Cognition and emotion. From order to disorder. Hove, East Sussex: Psychology Press.
Rijkeboer, M. M., van den Bergh, H., & van den Bout, J. (2005). Stability and discriminative power of the Young Schema Questionnaire in a Dutch clinical versus non-clinical population. Journal of Behavior Therapy and Experimental Psychiatry, 36, 129–144.
Rittenmyer, G. J. (1997). The relationship between early maladaptive schemas and job burnout among public school teachers.Dissertation Abstracts International, 58(5-A), 1529.
Saris, W. E., & Stronkhorst, L. H. (1984).Causal modelling in nonexperimental research. Amsterdam: Sociometric Research Foundation.
Schmidt, N. B., Joiner, T. E., Young, J. E., & Telch, M. J. (1995). The Schema-Questionnaire: Investi-gation of psychometric properties and the hierarchical structure of a measure of maladaptive schemas.Cognitive Therapy and Research, 19, 295–331.
Shah, R., & Waller, G. (2000). Parental style and vulnerability to depression: The role of core beliefs.
Journal of Nervous and Mental Disease, 188, 19–25.
Simeon, D., Guralnik, O., Knutelska, M., & Schmeidler, J. (2002). Personality factors associated with dissociation: Temperament, defences, and cognitive schemata.American Journal of Psychiatry, 159, 489–491.
Sterk, F., & Rijkeboer, M. M. (1997).Schema-Vragenlijst[Schema-Questionnaire]. Utrecht: Ambula-torium Utrecht University.
Stopa, L., Thorne, P., Waters, A., & Preston, J. (2001). Are the short and long forms of the Young Schema-Questionnaire comparable and how well does each version predict psychopathology scores?
Journal of Cognitive Psychotherapy, 15, 253–272.
van de Vijver, F. J. R., & Hambleton, R. K. (1996). Translating tests: Some practical guidelines.
European Psychologist, 1, 89–99.
Waller, G., Dickson, C., & Ohanian, V. (2002). Cognitive content in bulimic disorders: Core beliefs and eating attitudes.Eating Behaviors, 3, 171–178.
Waller, G., Meyer, C., & Ohanian, V. (2001). Psychometric properties of the long and short versions of the Young Schema-Questionnaire: Core beliefs among bulimic and comparison women.Cognitive Therapy and Research, 25, 137–147.
Waller, G., Shah, R., Ohanian, V., & Elliott, P. (2001). Core beliefs in bulimia nervosa and depression: The discriminant validity of Young’s Schema-Questionnaire.Behavior Therapy, 32, 139–153. Waller, G., Ohanian, V., Meyer, C., & Osman, S. (2000). Cognitive content among bulimic women: The
Welburn, K., Coristine, M., Dagg, P., Pontefract, A., & Jordan, S. (2002). The Schema-Questionnaire-short form: Factor analysis and relationship between schemas and symptoms.Cognitive Therapy and Research, 26, 519–530.
Young, J. E. (1994).Cognitive therapy for personality disorders: A schema-focused approach(Rev. ed.). Sarasota, FL: Professional Resource Press.
Young, J. E. (1998).Young Schema-Questionnaire Short Form. New York: Cognitive Therapy Centre. Young, J. E., & Brown, G. (1994). Young Schema-Questionnaire (2nd ed.). In J. E. Young,Cognitive therapy for personality disorders: A schema-focused approach(Rev. ed., pp. 63–76). Sarasota, FL: Professional Resource Press.
Young, J. E., & Klosko, J. S. (1994).Reinventing your life. New York: Plume.
Young, J. E., Klosko, J. S., & Weishaar, M. E. (2003).Schema therapy. A practitioner’s guide. New York: The Guilford Press.