A Comparative Study of Data Mining Techniques for Credit Scoring in Banking
Shin-Chen Huang, Min-Yuh Day
Department of Information Management, Tamkang University, Taiwan
[email protected], [email protected]
Abstract
Credit is becoming one of the most important incomes of banking. Past studies indicate that the credit risk scoring model has been better for Logistic Regression and Neural Network. The purpose of this paper is to conduct a comparative study on the accuracy of classification models and reduce the credit risk. In this paper, we use data mining of enterprise software to construct four classification models, namely, decision tree, logistic regression, neural network and support vector machine, for credit scoring in banking. We conduct a systematic comparison and analysis on the accuracy of 17 classification models for credit scoring in banking. The contribution of this paper is that we use different classification methods to construct classification models and compare classification models accuracy, and the evidence demonstrates that the support vector machine models have higher accuracy rates and therefore outperform past classification methods in the context of credit scoring in banking.
Keywords: Classification Method, Credit Risk Score, Data Mining, SAS Enterprise Miner, Support Vector Machine (SVM)
1. INTRODUCTION
Credit risk is important for banking, and the importance of credit risk management is increasing due to past financial events. According to past literature, banking principal is credit income. The credit risk management of banking deals with appropriate that can improve management risk of banking. Use of personal information to construct credit risk scoring models can classify and predict the credit risk of customers.
Credit experts, according to past experience, make decisions when early technologies of credit risk scoring, this method make different result. Because of the technological advancement, use of different statistics software make scoring models more accurate.
Banking through automated processing then has high accuracy and reduced business cost. In the past, banking constructed credit risk scoring models based on regression and neural network because such usage produced high accuracy [1].
The aim of this paper is therefore twofold: (1) using enterprise miner software (SASEM) to construct and compare 12 SVM classification models. (2) using enterprise miner software (SASEM) to construct and compare various classification models, namely, Decision Tree, Logistic Regression, Neural Network and SVM.
This paper is organized as follows: Section 2 describes the literature focused on credit risk and the classification methods used for credit scoring; Section 3 describes construct classification used in this research; Section 4 presents the experimental results from the proposed approaches to classify two real-world data sets; and Section 5 gives remarks and provides a conclusion.
2. LITERATURE REVIEW
As financial regulations opened up in recent years, the credit risk scoring system has become an important research issue. As banking organizations began to recognize the importance of credit risk control, credit risk scoring models have become more widely used in credit evaluation. The bank can use credit risk scoring models to reduce credit risks and to increase profits. Credit risk scoring is the method that banking organizations used when analyzing client data with credit scoring systems to decide whether applicants would be good or bad clients, with the former being able to pay off the debt and the latter having a higher possibility of breaching the contract [2].
2.1.Credit Risk
Various classification models were developed by building credit risk scoring models with data mining technologies; include Linear Discriminant Analysis [3], Decision Tree [4], Logistic Regression [5], F-Score [6], and Genetic Programming [4]. Desai et al., [7] conducted a research in credit scoring decision by comparing Neural Network, Linear Discriminant Analysis and Logistic Regression. They found that liner discriminant analysis achieved lower accuracy than neural network and logistic regression, which performed with similar accuracy.
In summation, neural network and logistic regression methodology outperform other models and are considered to be the most commonly used credit risk scoring models.
2.2. Data Mining
The competitive environment is completely different in this information technology advance era. Information systems have significant breakthrough and progress in mass data processing and high–speed computing function thanks to the improvement in information technology. In this case, the focus of the enterprise has moved from data compilation and collection transformation to the search for the most effective method of intercepting information from databases. Data mining used powerful processing and computing functions to practice multi-dimensional searches of mass data, thereby discovering hidden knowledge and useful information that benefit the decision making of users and enterprises. Data mining has been applied to various fields, including, but not limited to, industrial, commercial, medical, and biological industries. In the business context, the application of data mining can be used in insurance, banking, credit card companies. In the biomedical field, data mining can be applied to disease diagnosing.
Data mining has been defined by scholars, such as Frawley [8], as the process of searching for potentially clear and useful information from databases. In 1996, Frawley redefined data mining to be a step in knowledge discovering. The process of data mining using algorithm to do application, transformation, analysis and further, to identify data’s feature and model. Grupe and Owrang [9] defined data mining as finding new knowledge that has yet to be studied by experts from database. Berry and Linoff [10] defined data mining to be finding meaningful relationships and rules by analyzing mass data with automatic or semi-automatic method. Kleissner [11] defined data mining as a new decision-making support analyzing process that can find hidden valuable knowledge to provide enterprise for reference.
In summation, previous scholars share different opinions in data mining; however, their defining directions are close. In this study, the definition of data mining is similar to the Kleissner’s definition.
2.3. Classification Methodology
Data mining has different functions. For instance, data mining can be categorized as Classification, Prediction, Association, Clustering, etc. ‘Classification’ is building categories in feature sets according to targets’ attributes. Models describing features and cross-category relationships can classify information and provide the basis for decision-making. Using classified data to conduct the variable attribute value calculation can provide potential rules and classification results. The aim of this research is to introduce four classifications.
Decision Tree classification method uses training data to predict categories and continuous variables. Decision tree concept is classification by known data and
classification feature. Each type has a different decision model. The process is presented in a tree-shaped graph. The most commonly used decision trees include ID3 [12], C4.5 [13], Classification and Regression Tree; CART [14], that using on text symbols or discrete data type.
Logistic Regression Model, introduced by Berkson [15], uses data consisting of only two testing results, success or failure. When constructing models, it is expected to predict the relationship between the response variable and independent variable accurately and furthermore, to establish classification rules. Sample attribute can be identified when using a single sample to predict the possibility of success. Logistic regression is mainly used for solving classification problems, compiling the class variable and predicting final value between 0 and 1. Logistic regression is often used to construct binary classification as an alternative for linear discriminant analysis method in order to avoid the unreasonable presumption that the covariance matrix must be the same as the binary class [16]. Logistic regression technology has been one of the most accurate binary output methods [17].
The basic premise of Neural Network is that neurons are calculated by multiplying the input neurons and link values to produce the total output. The neural network trains and adjusts link value to make it larger or smaller, with the initial value typically produced at a random rate between +1 and -1. Link value can understood as a weighted effect. The greater the link value, the easier it is for the link to become too activated and affect the neural network. Links that are too small can usually be removed to save the computer’s time and space. These are the elements that made the neural network.
Support Vector Machine is a useful dimensional classification tool introduced by Vapnik [18], which has been widely used in various fields for classification solutions in recent years. Its application include disease diagnosis [19] [20] and credit evaluation [1] [21] [22]. Support vector machine is a learning algorithms derived from statistical learning theories. It has developed from the simple vector classification of the statistical learning theory into a hyper plane classifier.
In summation, the use of decision tree, logistic regression, neural network and support vector machine can be applied to the credit risk score predicting model. This study compares these four classification methods.
2.4. SAS Enterprise Data Mining Software
SAS Enterprise is enterprise data mining software using graphical description to complete the whole process. SAS EM includes the SEMMA data mining process. SEMMA consists of 5 stages: Sample, Explore, Modify, Model and Assess. The Sample stage helps users extract information data from the population, effectively reduce module training time, and produce reliable modules. The Explore Stage provides a variety of visual data observation tools. The
Collection Normalization Data Preprocessing
Model Construction Using SAS EM LibSVM
Decision Tree Neural Network Logistic Regression SVM SVM 12 Models: M1 - M12 2 Models: M13, M14
Model Comparison and Analysis
1 Model: M15 1 Model: M16 1 Model: M17
Figure 1. System architecture of a comparetive study of data mining techniques for credit scoring in banking
Modify Stage maintains the completeness and usability of the data by exploring and correcting data dynamically and repeatedly. The Model Stage provides various classification models including decision tree, logistic regression, neural network and support vector machine, etc. The last stage, Assess, provides a common structure and uses prediction models to predict and evaluate the model’s quality.
To sum up, using SAS Enterprise Miner to set up predicting classification models in credit risk scoring academic field is a new challenge, adjust internal attribute and compare to model accuracy.
Applications of credit risk scoring were once premised on the decision tree, logistic regression and neural network models, with the latter two approaches producing higher accuracy. Support vector machine was infrequently used for classification in the past. Therefore, the support vector machine model is emphasized in this research to compare its accuracy.
3. METHODOLOGY
This study proposes the comparison of the credit risk rating model architecture diagram, as shown below in Figure 1. As demonstrated below, after obtaining the training data, enter data pre-processing phase. Data pre-processing phase is divided into 2 parts: data collection and data normalization. First, collect and normalize data, then transform the data into SAS EM and LibSVM readable information. In the model building stage, SAS EM model building and LibSVM model are compared for their classification model accuracy.
3.1. Preprocessing
The step is one of the important sections in the research.
In this phase, the system deletes heterogeneous attributes and missing values. The system also screens and unifies formats to generalize the data sets necessary to improve operational efficiency.
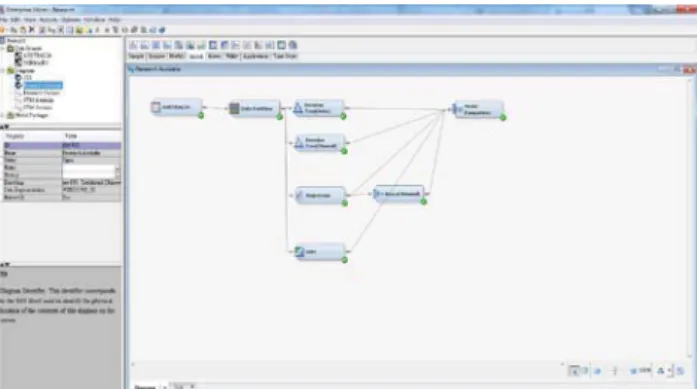
3.2. SAS EM Model Construct
In this study, SAS EM enterprise data mining software is used to construct a classification prediction model. The model is built for the demands by following the five SEMMA mining steps of SAS EM system with different nodes. The models used are decision tree, logistic regression, neural network and support vector machine. Figure 2 shows the working process in this research using 5 classification models in SAS EM workspace, from data processing to model accuracy comparing.
3.2.1. Decision Tree Classification Model
Using the SAS EM construct decision tree classification model, this step can be divided into an automatically generated decision tree model and a manually generated decision tree model. The former is set up by SAS EM internal branching process rules, and the latter is built by rules created by the user. The branch is based on the size of –Log (P). This study uses the manually generated decision tree model, and stops branching when –Log (P) is less than 5 or when the data number is less than 5.
3.2.2. Logistic Regression Classification Model
Using SAS EM construct logistic regression classification model, this step aims to build one classification model. There are 3 methods to establishing the logistic regression classification model: Forward, Backward and Stepwise. This study selects Stepwise method to establish models.
Figure 2. Model constructions of 5 classification models in the SAS EM workspace
3.2.3. Neural Network Classification Model
The step aims to establish a classification model with SAS EM construct neural network classification model. Please note that, due to its high complexity, neural network may continue to use training data and therefore cause divergence. Hence, the node must be connected behind logistic regression point. Neural network has a large number of attributes, and this study will only focus on selected attributes. The rest are left as SAS EM internal default value. There are 3 model selection criterions of selecting principle: Profit/Loss, Misclassification and Average Error. Profit/Loss selects the validation dataset cases model that maximizes profit or minimizes losses. Also, nodes using the training dataset when validation dataset is out of work. Regarding Misclassification, nodes
select the model with the least misclassification rate for the validation dataset. Average Error method uses nodes to select the model with the least average error rate for the validation dataset. In this study, Profit/Loss is used as the model criteria.
.
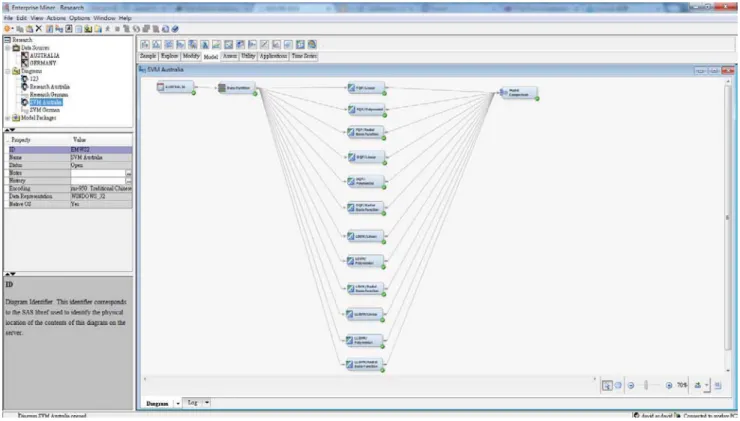
3.2.4. Support Vector Machine Classification Model
Using SAS EM Support vector machine classification model, twelve classification models are built in this stage. These twelve classification models are used in cross combination based on estimation methods and kennel functions of support vector machine. Table 1 shows the estimating methods and the kernel functions.
Figure 3 shows the working process of this study using SAS EM constructs twelve SVM classification models from dataset processing, model building to accuracy comparing.
There are 4 estimating methods: Full Dense Quadratic Programming (FQP), Decomposed Quadratic Programming (DQP), Lagrangian SVM (LSVM), and Least Squares SVM (LSSVM). Full Dense Quadratic Programming method can only solve problems consisting of small amounts of data and is therefore not suitable to process medium or large dataset, such as Quadratic Program (QP). Decomposed Quadratic Programming divides input data into two parts, in which the smaller part Table 1. Support vector machine of estimating methods
and the kernel functions
Estimation Method Kernel Functions Full Dense Quadratic Programming, FQP Linear Decomposed Quadratic Programming,
DQP
Polynomial Lagrangian SVM Radial Basis
Function Least Squares SVM,LSSVM
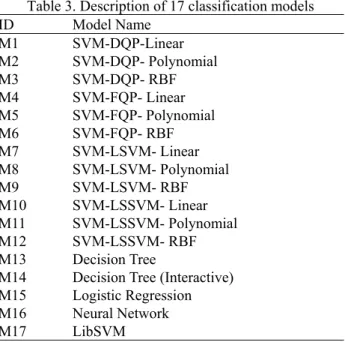
Table 3. Description of 17 classification models ID Model Name M1 SVM-DQP-Linear M2 SVM-DQP- Polynomial M3 SVM-DQP- RBF M4 SVM-FQP- Linear M5 SVM-FQP- Polynomial M6 SVM-FQP- RBF M7 SVM-LSVM- Linear M8 SVM-LSVM- Polynomial M9 SVM-LSVM- RBF M10 SVM-LSSVM- Linear M11 SVM-LSSVM- Polynomial M12 SVM-LSSVM- RBF M13 Decision Tree
M14 Decision Tree (Interactive) M15 Logistic Regression M16 Neural Network M17 LibSVM Table 2. SVM kernel function algorithm
Kernel Functions Kernel Function Algorithm
Linear K(u,v)=uTv
Polynomial K(u,v)=(uTv+1)P Radial Basis Function K(u,v)=exp[-p(u-v)2] Sigmoid K(u,v)=tanh(p*(uTv)+q)
of the data is used to optimize the larger part. The rest of the data remains unchanged, mainly to solve large Quadratic Problem. Lagrangian SVM method is suitable for managing large SVM classification models’ linear kernel function and non-linear kernel function in medium models. Mangasarian and Musicant [23] (Lagrangian Support Vector Machine) modified quadratic programming problem has no linear limits. The only two restrictions are that the parameter estimates must be nonnegative. Also, LSVM can be an iterative method. Suykens and Vandewalle [24] proposed the Least Squares SVM method, which solves linear and non-linear Least Squares SVM of C classification problems.
The kernel functions including Linear, Polynomial and Radial Basis Function for which the algorithm can refer to Table 2. This study combines these four estimating methods and three kernel functions to generate twelve support vector machine classification models.
3.3 LibSVM Model Construct
Support vector machine’s main theory is based on Structured Risk Minimization (SRM) of statistical leaning theory. Using Separating Hyperplane to separate two or multiple types of information (Lin and Lin, 2003) is the most commonly used data mining method. Support vector machine classification method is widely used to solve classification problems in various fields. Due to support vector machine establishment classification system using different kernel functions, different parameter settings may affect its accuracy. Thus, continuous testing is necessary in identifying the most suitable parameters. The kernel function of RBF (Radial Basis Function) can classify non-linear, high dimensional data and only require adjusting Cost parameter (C) and Gammer ( ). Cost parameters determine the division of the two sample types. Test parameters use RBF. Kernel functions determine the contribution degree of each sample data point to the next one.
4. EXPERIMENTAL RESULTS AND
ANALYSIS
In this study, the Australia credit database and the German credit database are used for credit ratings, Both datasets are from the UCI‘s case database.
We build seventeen classification models to compare their accuracies. Table 3 shows the numbers and names of these 17 classification models.
The Australia credit database has 690 case data. There are 15 attributes of features, including 6 nominal attributes, 8 continuous attributes and 1 target attribute (the data type of binomial, accept or reject). Credit card companies decide whether to grant such credit based on the characteristics of the applicants. This target attribute has 307 accepted and 383 rejected cases. The Australian credit dataset is characterized by the considerable gap between the maximum and minimum continuous attributes. Due to personal privacy, the names of feature attributes have been changed to anonymous symbol data, with numerical figures replacing each field. After mixing each dataset’s attributes, the system uses continuous value with different proportions to conduct data mining.
The German credit database includes credit card application information on a total of 1000 German customers. There are 25 attributes of feature, including 24 continuous attributes and 1 target attribute (the data type of binomial, accept or reject). The cases regarding target attributes resulted in 700 accepted and 300 rejected cases.
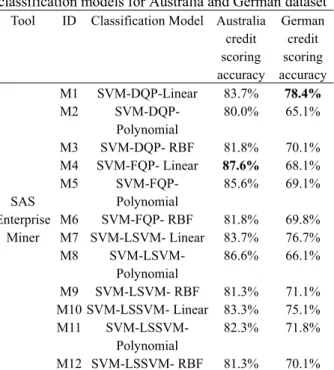
Using SAS-EM, according to the Australia dataset listed in Table 4, M4 model (SVM-FQP-Linear) has the highest accuracy (87.6%) in the twelve classification predicting models; while in the Germany dataset, M1 model (SVM-DQP-Linear) provides the highest accuracy (78.4%).
To sum up, this study demonstrates that, of these twelve support vector machine classifier models, the linear kernel function model obtained the highest accuracy rate.
Last but not least, the results from the accuracy comparisons of these seventeen classification models are listed in Table 5.
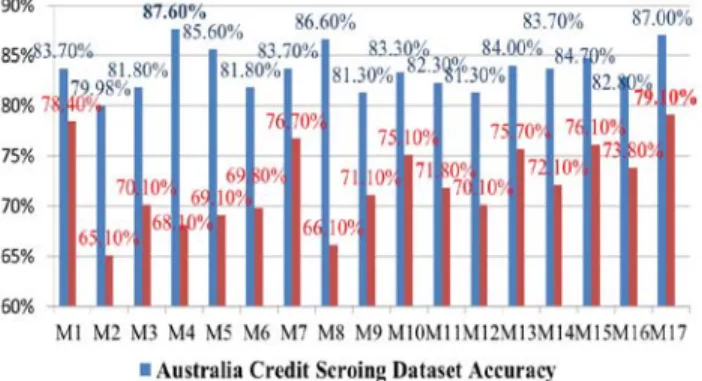
According to the Australia dataset in Table 5, M4 model (SVM the FQP - Linear) has the highest accuracy (87.6%), followed by M17 model (LIBSVM) which provides 87.0% accuracy, then M8 model (SVM the LSVM-polynomial), 86.6%. In the Germany dataset, M17 model (LIBSVM) has the highest accuracy of 79.1%, with M1 model (SVM-DQP-Linear) following and M7 model (SVM-LSVM-Linear) for the third highest accurate model.
Figure 4 shows that support vector machine classification models established using SAS EM or LibSVM achieve higher accuracy, and outperform the logistic regression and neural network classification models.
5. CONCLUSIONS
The demand of individual consumer increases year by year; hence, financial institutions provide a large amount of products and services to satisfy consumers’ needs for expanding market share. In the personal credit evaluation process, financial institutions need to reduce bad debt to make the best credit scoring classification decision. In the past, the process relied on staff experience and subjective judgment, which easily led to erroneous decisions due to bias, complex credit data features, or over-weighing the guarantee quality. Thanks to the rapid development of information technology, researchers and financial institutions began to use data mining and machine learning
methods to improve classification efficiency and accuracy, and to further build effective classification prediction models. This study is based on data mining methods to compare different classification prediction models on two datasets. Significant cost can be saved in financial institutions with massive credit dataset by making small improvements in the accuracy of its systems . If businesses begin to use existing credit risk models, achieving efficiency and increased profits will be very promising.
This research is limited to the data source of the UCI credit database. The database may include several factors that are not analyzed in the study. The data dependency that occurred in the results is therefore not discussed in the research.
This study aims to use SAS EM to create twelve support vector machine classification models to compare their accuracy. The study also uses SAS EM construct decision tree, logistic regression, neural network, support vector machine and LibSVM support vector machine, plus the previous twelve models for total for seventeen classification models for accuracy comparisons. Finally, the study analyzes the accuracy by using different credit Table 4. Credit scoring accuracy of 12 SVM
classification models for Australia and German dataset
Tool ID Classification Model Australia
credit scoring accuracy German credit scoring accuracy SAS Enterprise Miner M1 SVM-DQP-Linear 83.7% 78.4% M2 SVM-DQP-Polynomial 80.0% 65.1% M3 SVM-DQP- RBF 81.8% 70.1% M4 SVM-FQP- Linear 87.6% 68.1% M5 SVM-FQP-Polynomial 85.6% 69.1% M6 SVM-FQP- RBF 81.8% 69.8% M7 SVM-LSVM- Linear 83.7% 76.7% M8 SVM-LSVM-Polynomial 86.6% 66.1% M9 SVM-LSVM- RBF 81.3% 71.1% M10 SVM-LSSVM- Linear 83.3% 75.1% M11 SVM-LSSVM-Polynomial 82.3% 71.8% M12 SVM-LSSVM- RBF 81.3% 70.1%
Table 5. Credit scoring accuracy of 17 classification models for Australia and German dataset.
Tool ID Classification model Australia
credit scoring accuracy German credit scoring accuracy SAS Enterprise Miner M1 SVM-DQP-Linear 83.7% 78.4% M2 SVM-DQP-Polynomial 80.0% 65.1% M3 SVM-DQP- RBF 81.8% 70.1% M4 SVM-FQP- Linear 87.6% 68.1% M5 SVM-FQP-Polynomial 85.6% 69.1% M6 SVM-FQP- RBF 81.8% 69.8% M7 SVM-LSVM- Linear 83.7% 76.7% M8 SVM-LSVM-Polynomial 86.6% 66.1% M9 SVM-LSVM- RBF 81.3% 71.1% M10 SVM-LSSVM- Linear 83.3% 75.1% M11 SVM-LSSVM-Polynomial 82.3% 71.8% M12 SVM-LSSVM- RBF 81.3% 70.1% M13 Decision Tree 84.0% 75.7% M14 Decision Tree(Interactive) 83.7% 72.1% M15 Logistic Regression 82.8% 73.8% M16 Neural Network 84.7% 76.1% LibSVM M17 LibSVM 87.0% 79.1%
data and classification tools and classification predicting models.
The result of this study demonstrates that, among the seventeen classification models, M4 model (SVM-FQP-Linear) is the most accurate model (87.6% accuracy) for the Australia credit rating dataset. As for German credit rating, M17 model is the most accurate model (LibSVM) (79.1% accuracy).
The contribution of this study is using different classification tools to create classification models and compare their accuracy. The study discovers that, amongst the twelve SAS EM constructed support vector machine models, linear kernel function has higher accuracy. Out of the seventeen models, the support vector machine has the highest accuracy rate as compared to the logistic regression and neural network models.
For further research, the study hopes to compare credit risk scoring models built from different classification methods with more classification models included, such as genetic algorithms, F-score, etc. Last but not the least, find out the more ideal model for credit risk scoring classification models and improve the model’s accuracy and increase enterprises’ profit.
6. ACKNOWLEDGEMENT
This research was supported in part by the National Science Council of Taiwan under Grants NSC101-3113-P-032-001 and TKU research grant.
7. REFERENCES
[1] C. Huang, M. Chen and C. Wang. Credit scoring with a data mining approach based on support vector machines. Expert Syst. Appl. 33(4), pp. 847-856. 2007.
[2] L. Gao, C. Zhou, H. Gao and Y. Shi. Credit scoring model based on neural network with particle swarm
optimization. Advances in Natural Computation pp. 76-79. 2006.
[3] L. C. Thomas. A survey of credit and behavioural scoring: Forecasting financial risk of lending to consumers. Int. J. Forecast. 16(2), pp. 149-172. 2000. [4] J. Huang, G. Tzeng and C. Ong. Two-stage genetic
programming (2SGP) for the credit scoring model. Applied Mathematics and Computation 174(2), pp. 1039-1053. 2006.
[5] W. E. Henley. Statistical Aspects of Credit Scoring. 1994.
[6] Y. Chen and C. Lin. Combining SVMs with various feature selection strategies. Feature Extraction pp.315-324. 2006.
[7] V. S. Desai, J. N. Crook and G. A. Overstreet. A comparison of neural networks and linear scoring models in the credit union environment. Eur. J. Oper. Res. 95(1), pp. 24-37. 1996.
[8] G. Piateski and W. Frawley. Knowledge Discovery in Databases 1991.
[9] M. M. Owrang O and F. H. Grupe. Using domain knowledge to guide database knowledge discovery. Expert Syst. Appl. 10(2), pp. 173-180. 1996.
[10] M. J. Berry and G. S. Linoff. Data Mining Techniques: For Marketing, Sales, and Customer Relationship Management 2004.
[11] C. Kleissner. Data mining for the enterprise. Presented at System Sciences, 1998., Proceedings of the Thirty-First Hawaii International Conference on. 1998, .
[12] J. Quinlan. Discovering rules form large collections of examples: A case study. Expert Systems in the Microelectronics Age 1979.
[13] J. R. Quinlan. C4. 5: Programs for Machine Learning 19931.
[14] L. Breiman, J. Friedman, C. J. Stone and R. A. Olshen. Classification and Regression Trees 1984.
[15] J. Berkson. Application of the logistic function to bio-assay. Journal of the American Statistical Association 39(227), pp. 357-365. 1944.
[16] A. K. Reichert, C. Cho and G. M. Wagner. An examination of the conceptual issues involved in developing credit-scoring models. Journal of Business & Economic Statistics 1(2), pp. 101-114. 1983.
[17] H. Jo, I. Han and H. Lee. Bankruptcy prediction using case-based reasoning, neural networks, and discriminant analysis. Expert Syst. Appl. 13(2), pp. 97-108. 1997.
[18] V. Vapnik. The Nature of Statistical Learning Theory 1999.
[19] B. H. Cho, H. Yu, K. Kim, T. H. Kim, I. Y. Kim and S. I. Kim. Application of irregular and unbalanced data to predict diabetic nephropathy using visualization and feature selection methods. Artif. Intell. Med. 42(1), pp. 37-54. 2008.
Figure 4. Comparison of Australia and German credit dataset for 17 classification models accuracy
[20] C. Su and C. Yang. Feature selection for the SVM: An application to hypertension diagnosis. Expert Syst. Appl. 34(1), pp. 754-763. 2008.
[21] K. B. Schebesch and R. Stecking. Support vector machines for classifying and describing credit applicants: Detecting typical and critical regions. J. Oper. Res. Soc. 56(9), pp. 1082-1088. 2005.
[22] D. Martens, B. Baesens, T. Van Gestel and J. Vanthienen. Comprehensible credit scoring models using rule extraction from support vector machines. Eur. J. Oper. Res. 183(3), pp. 1466-1476. 2007. [23] O. L. Mangasarian and D. R. Musicant. Lagrangian
support vector machines. The Journal of Machine Learning Research 1pp. 161-177. 2001.
[24] J. A. Suykens and J. Vandewalle. Least squares support vector machine classifiers.Neural Process Letters 9(3),pp. 293-300. 1999.