Finance Publication Finance
7-2009
An Examination of Financial Patterns Using the
Survey of Small Business Finances
George W. Haynes
Montana State University-Bozeman James R. Brown
Iowa State University, jrbrown@iastate.edu
Follow this and additional works at:http://lib.dr.iastate.edu/finance_pubs
Part of theFinance and Financial Management Commons
The complete bibliographic information for this item can be found athttp://lib.dr.iastate.edu/ finance_pubs/8. For information on how to cite this item, please visithttp://lib.dr.iastate.edu/ howtocite.html.
This Book Chapter is brought to you for free and open access by the Finance at Iowa State University Digital Repository. It has been accepted for inclusion in Finance Publication by an authorized administrator of Iowa State University Digital Repository. For more information, please contact
An Examination of Financial Patterns
Using the Survey of Small
Business Finances
George W. Haynes1
Montana State University at Bozeman James R. Brown
Iowa State University
The substantial growth in the number of small businesses over the past decade has in-creased the demand for debt and equity capital by small business owners. These busi-nesses account for about 50 percent of private-sector output and employ more than half of private-sector workers over the past decade. Given small businesses’ significant role in innovation and economic growth, an understanding of trends in the types and sources of financing they use is important for policymaking, primarily because small businesses typically finance their businesses differently than larger businesses. In a comparison of the earlier Surveys of Small Business Finances (SSBF) conducted by the Federal Reserve with the latest SSBF (2003), Mach and Wolken (2006) suggest that non-depository insti-tutions have become more important to small business owners:
The incidence of credit lines and vehicle loans has increased, whereas the incidence of capital leases declined somewhat. Since the 1987 survey, small businesses have increasingly used non-depository institutions to obtain some of their financial services. However, despite the growth in the use of non-depository sources—from 25 percent of firms in 1987 to
1
Research performed under contract number SBAHQ-07-M-0381. The statements, findings, conclusions, and recommendations are those of the authors and do not necessarily reflect the views of the Office of Ad-vocacy, the U.S. Small Business Administration, or the U.S. government.
54 percent in 2003—commercial banks remained the dominant supplier of most financial services. (Page 187)
This study will describe financing patterns of small businesses in 2003 and exam-ine the changes in financing patterns of small busexam-iness borrowers over the past decade (1993–2003). In addition, the analysis of changes in financing patterns will examine the impact (if any) that the rise of non-traditional, non-commercial lending has had on the importance of internal finance for small firm growth.
1. Literature Review
While an extensive body of literature exists on the financing of large businesses, more limited literature exists on the financing of small businesses. Rich literature exists on capital structure in the business literature (Modigliani and Miller, 1958; Modigliani and Miller, 1963; Myers, 1984; Jensen and Meckling, 1976; and Myers and Majluf, 1984). According to Modigliani and Miller (1958), a firm’s capital structure does not matter in a perfect capital market environment because firm value is not affected. Modigliani and Miller (1963) suggested that, in the absence of capital market imperfections, the amount of debt in a firm’s capital structure would not affect firm value. Myers (1984) extended this analysis by presenting a static trade-off theory. This theory states that a firm will use debt in its capital structure up to the point where the tax benefit from an extra dollar of debt is equal to the cost that comes from the increased probability of financial distress.
Using agency theory, Jensen and Meckling (1976) argue that the probability dis-tribution of cash flows provided by a firm is not independent of its ownership structure and that this fact may be used to explain optimal leverage. The agency costs associated with both debt and equity will dictate the choice of an optimum capital structure that minimizes total agency costs. Myers and Majluf (1984) use this theory to suggest that a pecking order will exist in a firm’s design of its capital structure: internally generated capital will be employed first, followed by outside debt and finally external equity. Most of the original focus was on large publicly traded firms and the theories assume value- and profit-maximization as the only goals.
Although researchers have extended investigations of determinants of financial structure to small and privately held firms, little attention has been given to small busi-nesses. Aronson (1991) examined men- and women-owned businesses using the 1982 Census and found that women were more likely to rely on self-financing, including indi-vidual and family financing, than borrowing from others. A study by Chaganti, DeCarolis and Deeds (1996) supported this result by suggesting that women entrepreneurs were more likely than men entrepreneurs to seek equity financing from family and friends. Bates (1991) examined white- and black-owned businesses using the Census of Business
Owners and found that internal equity capital was especially important to black-owned businesses. Ang (1992) extended the use of agency theory to the small business literature. This research suggests that studies of financial structure should distinguish between small privately held firms and larger publicly traded firms. Although small privately held firms have more severe standard problems such as higher costs of agency conflicts and asym-metric information, they have many different complexities. These complexities include, but are not limited to, shorter expected life, presence of estate taxes, intergenerational transfer problems, and the prevalence of implicit contracts.
The aforementioned literature has provided the basis for describing and examin-ing the role of finance companies and the financial structure of small businesses usexamin-ing the 1993 and 1998 SSBF (Haynes, 2005; Haynes and Ou, 2003; Haynes, 2002). More recent work has examined the relationship between financial resources held by the family and business (Haynes, Onochie and Muske, 2007) and the importance of equity (external capital) and debt capital to small business borrowers (Ou and Haynes, 2006).
The literature discusses several reasons why small firms might face a high cost of external capital. Asymmetric information problems may be especially severe for smaller, younger firms, which can lead to both adverse selection and moral hazard, and potentially even to credit rationing (Stiglitz and Weiss, 1981). In addition, younger, smaller ventures often have difficulty obtaining debt because their returns are uncertain and highly vola-tile, and creditors do not share in firms’ returns (Stiglitz, 1985). Smaller firms also may possess limited collateral which is often necessary for obtaining debt finance, particularly for risky firms (Berger and Udell, 1990). Finally, external equity finance is likely even more expensive than debt for almost all small firms, due to both high floatation costs as-sociated with public issues (Lee, Lockhead, Ritter and Zhao, 1996) and the “lemons pre-mium” that any potential equity supplier may demand due to asymmetric information problems (Myers and Majluf, 1984). This literature is employed to generate the hypothe-ses for this study.
2. Hypotheses
This study is largely descriptive, where financing patterns are described using the 2003 SSBF. In addition, this descriptive study will examine changes in financing patterns over the past 10 years using the 1993, 1998 and 2003 SSBF. Utilizing the earlier work by Mach and Wolken (2006), the following hypotheses will be explored:
1. Commercial banks have become less important lenders for small business borrowers from 1993 to 2003;
2. Non-depository lenders, especially finance companies, have become more important lenders for small business borrowers from 1993 to 2003; and
3. Commercial banks and finance companies (and other non-depository lenders) are more likely to have a complementary relationship vis-a-vis small business borrowers in 2003 than 1993.
3. Empirical Considerations
Data
This study utilizes the 1993, 1998 and 2003 SSBF. The SSBF is the national sur-vey conducted by the Federal Reserve Board of Governors for information on small busi-nesses’ use of different financing sources.2 This study employs extensive information on each type of loan held by the small business, including the type of institution holding the loan, interest rate charged, loan amount and collateral and guarantee requirements. In ad-dition, the SSBF has critical information on the financial and non-financial characteristics of the firm, including extensive balance sheet and income statement information. The 1993 survey has 4,637 observations representing nearly 5 million small businesses; the 1998 survey has 3,561 observations representing over 5.3 million small businesses; and the 2003 survey has 4,240 observations representing 6.3 million small businesses. All analyses in this study utilize the population weights provided in the data set. All loan amounts were adjusted for inflation from 1993 to 2003 using the producer price index as reported by the U.S. Department of Labor (Bureau of Labor Statistics, 2008).
Models
This study describes the financing patterns for small businesses using the SSBF. This study parallels a set of summary tables created for the Small Business Administra-tion Office of Advocacy using the 1993 and 1998 SSBFs. The types of small businesses considered in this study include all firms, traditional borrowers, minority-owned busi-nesses (including specific tables on black- and Hispanic-owned busibusi-nesses), women-owned business, growth firms (sales increased from the previous year), younger firms (less than four years old) and firms with more than one owner organized as S corpora-tions. (See Appendix A for details).
2
See Mach and Wolken, “Financial Services Used by Small Businesses: Evidence from 2003 Survey” (Federal Reserve Bulletin, 2006).
In addition, this study will examine the importance of commercial banks and non-depository lenders (especially finance companies) from 1993 to 2003 using concatenated SSBF datasets for 1993 through 2003. The first hypothesis examines the importance of commercial banks from 1993 to 2003 and will employ the following linear regression specification:
CB = 0 + 1 (year_1993) + 2 (year_1998) + 3 (firm characteristics) + 4 (owner characteristics) + 5 (loan types) + i
where
CB = share of loans held by a commercial bank;
year_1993 = dummy variable for 1993 (reference year is 2003); year_1998 = dummy variable for 1998 (reference year is 2003);
firm characteristics = bankruptcy filings by the owner, natural log of number of employees (size), natural log of age, industrial classification, rural/urban location, legal organization;
owner characteristics = natural log of age, natural log of experience, gender and race of the majority owner; and,
loan types = dummy variables are included for line of credit, mortgage, vehicle, equipment, capital leases and other traditional loans. The dummy variable indi-cates that the firm holds a loan with a positive balance.
The second hypothesis examines the importance of finance companies from 1993 to 2003 and will employ the following linear regression specification:
FC = 0 + 1 (year_1993) + 2 (year_1998) + 3 (firm characteristics) + 4 (owner characteristics) + 5 (loan types) + i
where
FC = share of loans held by a finance company; and other variables are the same as above.
The third hypothesis examines the relationship between commercial banks and fi-nance companies from 1993 to 2003 and from 1998 to 2003. Two regression analyses are completed using the 1993 and 2003 data for the first run and 1998 and 2003 data for a second run. This linear regression specification is specified as follows:
log CB loans = 0 + 1(log FC loans) + 2 (year_2003) + 3 (log FC loans x year_2003)
where
log CB loans = log of commercial bank loans; log FC loans = log of finance company loans; year_2003 = dummy variable for 2003; and other variables are the same as above.
4. Results
This study utilizes the SSBF for three years (1993, 1998, and 2003) to examine who uses each type of loan and source of credit. This section examines the probability of holding a loan in 1993, 1998 and 2003, number of loans held, and the aggregate value of loans.
Table A reports the sample characteristics for the entire sample in columns 2 through 4 and for borrowers only in columns 5 through 7. The three installments of the SSBF utilized similar sampling frames, but the characteristics of the small businesses dif-fered substantially (Table A–columns 2 and 4) from 1993 to 2003 and from 1998 to 2003. Utilizing the population weights, the 2003 SSBF small businesses surveyed were some-what larger; more likely to be very young (less than four years old) or older (20 years or more) firms; more likely to be firms engaged in transportation and service industries and less likely to be engaged in mining/construction, wholesale trade or retail trade industries; more likely to be subchapter S corporations and less likely to be C corporations than the 1993 SSBF businesses surveyed. In addition, the owners of these firms are somewhat older, more experienced, and more likely to be woman- or minority-owned in 2003 than 1993. When considering only borrowers (Table A–columns 5 and 7), the same differ-ences across the two samples exist when comparing 1993 and 2003.
When comparing the 1998 and 2003 weighted samples (Table A–columns 3 and 4) the 2003 SSBF small businesses were slightly larger and older; more likely to be firms engaged in services and less likely to be firms engaged in manufacturing or wholesale trade; and less likely to be sole proprietorships or regular corporations and more likely to be partnerships or subchapter S corporations than the 1998 SSBF businesses surveyed. In addition, the owners of these firms were somewhat older and more experienced in 2003 than 1993. When comparing only borrowers (Table A–columns 6 and 7), the firms sam-pled in 2003 were somewhat older; more likely to engaged in the service industry and less likely to engaged in wholesale trade; more likely to be subchapter S corporations and less likely to be C corporations; and the owners were somewhat older, had more experi-ence and were more likely to owned by men than firms sampled in 1998 (Table A).
Table A Characteristics of the sample for 1993, 1998 and 2003 Characteristic 1993 All Firms 1998 2003 1993 Borrowers Only 1998 2003
Owner filed for bankruptcy in last 3 years
no 97.32 yes 2.68 Number of employees 0 38.75* 1 - 4 28.38 5 - 9 16.65 10 - 19 8.12* 20 - 99 7.08 99 - 499 1.01
Age of the firm
Less than 4 years 8.96*
4 - 9 34.25*
10 - 19 33.56*
20 or more 23.23*
Industrial classification
Mining and construction 14.18*
Manufacturing 8.06
Transportation 2.77*
Wholesale trade 8.46*
Retail trade 21.70*
Finance, insurance, real estate 7.09
Services 37.74* Rural location no 21.13 yes 78.87 Legal organization Sole proprietorship 43.21 Partnership 8.01 Corporation, subchapter s 20.33* Corporation, regular 28.44* Owner age Less than 25 0.16* 25 - 34 7.71* 35 - 44 28.73* 45 - 54 31.75* 55 - 64 20.74* 65 and older 10.90* 97.52 2.48 35.95* 29.71 17.62 8.50* 7.04 1.17 16.30 28.89 32.00* 22.81* 11.87 8.34* 3.72 7.15* 18.95 6.48 43.49* 20.11 79.89 49.35* 6.95* 23.87* 19.83* 0.24* 6.38 26.72* 32.82 22.96* 10.89* 97.58 2.42 33.38 29.93 18.00 10.10 7.61 0.99 14.89 27.77 28.55 28.79 11.80 7.12 3.76 5.88 18.42 7.20 45.81 20.63 79.37 44.54 8.70 31.02 15.75 1.03 5.78 20.67 34.00 25.55 12.96 97.20* 2.80 29.51* 28.30 19.62* 10.72* 10.35 1.50 10.05* 35.28* 33.65* 21.02* 15.50* 9.31 3.50* 8.82* 22.61* 7.09 33.17* 22.56 77.44 36.61 8.06 23.14* 32.18* 0.08* 8.93* 30.73* 33.10 19.47* 7.69* 97.60 2.40 23.75 29.41 22.54 11.65 10.79 1.85 14.78 30.20 33.14* 21.87* 14.27 9.00 4.32 7.71* 18.78 6.88 39.03* 21.60 78.40 40.68 7.96 28.21* 23.14* 0.21* 6.14 29.53* 34.32 22.49 7.32* 98.20 1.80 23.22 29.31 22.10 13.24 10.63 1.50 15.91 27.85 28.90 27.34 13.17 8.39 5.12 5.88 18.19 7.10 42.14 20.61 79.39 38.55 8.46 36.16 16.84 0.94 5.89 23.66 35.23 23.82 10.46
Table A Characteristics of the sample for 1993, 1998 and 2003 (continued) Characteristic 1993 All Firms 1998 2003 1993 Borrowers Only 1998 2003 Owner experience Less than 4 years 4 - 9 10 - 19 20 or more Owner gender Man Woman Owner race White Non-white
Commercial bank share 0
1% - 24% 25% - 49% 50% or more
Finance company share 0
1% - 24% 25% - 49% 50% or more
Commercial bank loan amount 0
$0 - $9,999 $10,000 - $99,999 $100,000 or more
Finance company loan amount 0 $0 - $9,999 $10,000 - $99,999 $100,000 or more 3.13* 16.33 36.00* 44.54* 79.39* 20.61* 92.52* 7.48 62.76* 4.56 5.44 27.24 87.63* 3.94* 1.87* 6.55* 62.76* 8.93* 18.52 9.79* 87.63* 4.70 6.25* 1.42* 6.98 17.26* 32.16* 43.59* 72.01 27.99 90.49 9.51 67.31 3.33 3.29* 26.07 86.80* 4.52* 1.80* 6.89* 67.31 6.05* 16.78 9.86* 86.80* 3.51* 8.09* 1.61 6.26 15.28 28.15 50.30 73.74 26.26 90.05 9.95 65.30 3.89 4.64 26.17 78.09 8.71 3.25 9.95 65.30 4.89 17.83 11.98 78.09 5.57 14.18 2.17 2.80* 16.50* 37.80* 42.90* 80.56* 19.44* 93.42* 6.58* 33.98* 8.13 10.37* 47.52 78.08* 7.02* 3.70* 11.20* 33.98* 15.84* 32.83 17.35* 78.08* 8.32* 11.08* 2.52* 5.30 16.30* 33.06* 45.33* 75.16* 24.84* 91.32 8.68 34.77 6.64 6.79* 51.79* 73.66* 9.01* 3.70* 13.63* 34.77 12.07* 33.48 19.68 73.66* 7.00* 16.14* 3.20 6.62 13.34 29.25 50.79 77.93 22.07 90.72 9.28 37.55 7.29 8.49 46.68 60.56 15.95 5.75 17.75 37.55 8.80 32.08 21.56 60.56 10.03 25.51 3.90 Number of observations
Note: * = alpha less or equal to 0.05; compare 1998 and 2003.
4,637 3,561 4,240 2,969 2,017
columns after 1993 compare 1993 and 2003; columns after 1998 2,651
While the percentage of small businesses utilizing commercial banks has de-clined, the percentage of small businesses utilizing finance companies has increased (Ta-ble A). A similar trend exists for borrowers, where small business borrowers utilizing commercial banks declined from 66 percent to 62.5 percent while the percentage of small business borrowers utilizing finance companies increased from 22 percent to 39 percent. Commercial banks were still the most important source of loans with over 46 percent of small business borrowers acquiring 50 percent or more of the value of their loans from commercial banks in 2003. Less than 18 percent of small business borrowers acquired 50 percent or more of the value of their loans from finance companies. In 2003, over 21 per-cent of all small business borrowers had a loan of $100,000 or more with a commercial bank while nearly 4 percent of all small business borrowers had a loan of $100,000 or more with a finance company.
As mentioned in the models section, this study is largely descriptive. While the analytical section of this paper focuses on commercial banks and finance companies, the descriptive section examines the proportion of small businesses using each type of loan and lender, number of loans, and aggregate value of loans held by each type of loan and lender. Tables B through G include the details of loans held by small firms for 1993, 1998, and 2003.
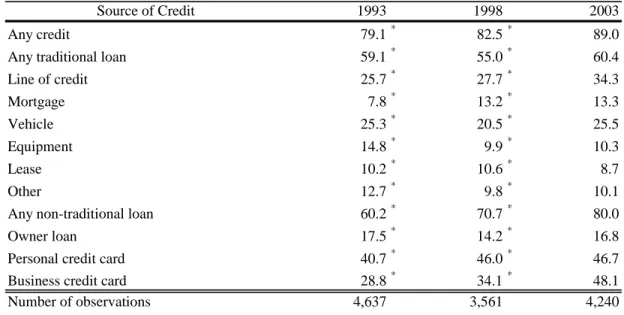
The percentage of small firms using any credit has increased from 79.1 percent in 1993 to 89.0 percent in 2003 (Table B). The use of traditional loans has remained nearly constant (59.1 percent in 1993 and 60.4 percent in 2003), however use of non-traditional loans has increased by one-third from 60.2 percent in 1993 to 80.0 percent in 2003.
Table B Percentage of all small firms using credit, by sources of credit, 1993 through 2003
Source of Credit 1993 1998 2003
Any credit
Any traditional loan Line of credit Mortgage Vehicle Equipment Lease Other
Any non-traditional loan Owner loan
Personal credit card Business credit card
79.1* 59.1* 25.7* 7.8* 25.3* 14.8* 10.2* 12.7* 60.2* 17.5* 40.7* 28.8* 82.5* 55.0* 27.7* 13.2* 20.5* 9.9* 10.6* 9.8* 70.7* 14.2* 46.0* 34.1* 89.0 60.4 34.3 13.3 25.5 10.3 8.7 10.1 80.0 16.8 46.7 48.1 Number of observations
Note: *=alpha less than or equal to 0.05.
The percentage of firms using traditional loans has increased for mortgages (6.5 percent in 1993 to 13.3 percent in 2003), but decreased or remained nearly the same for all other traditional loans. The percentage of firms using non-traditional loans has real-ized a large increase in business credit card use (28.8 percent in 1993 to 48.1 percent in 2003) with smaller increases realized in owner loans and personal credit cards.3
Table C shows the use of credit by depository and non-depository institutions and non-traditional credit suppliers. The use of depository institutions increased by just over 3 percent (from 44.9 percent in 1993 to 46.4 percent in 2003), while the use of non-depository institutions increased by 28 percent (from 20.7 percent in 1993 to 26.5 percent in 2003), and the use of non-traditional credit increased by nearly 33 percent (from 60.2 percent in 1993 to 80 percent in 2003). The use of commercial banks remained relatively constant at just over 40 percent, while the use of finance companies rose substantially, from 12.4 percent in 1993 to over 22 percent in 2003.
Table C Percentage of all small firms using credit, by suppliers of credit, 1993 through 2003
Suppliers 1993 1998 2003
Any Credit 79.1* 82.5* 89.0
Any Traditional Loan 59.1* 55.0* 60.4
Any Depository Institution 44.9* 42.0* 46.4
Credit Union 2.3* 2.3* 3.9
Thrift 4.2* 3.3* 5.5
Commercial Bank 40.6* 38.2* 41.0
Any Non-Depository Institution 20.7* 19.8* 26.5
Finance Company 12.4* 13.3* 22.1
Brokerage 0.4* 0.4* 0.7
Leasing 8.3* 6.8* 4.2
Other Non-depository 1.0* 1.5* 2.3
Any Non-Financial Institution 13.8* 9.6* 10.4
Family & Friends 8.6* 6.0* 6.2
Other Businesses 5.0* 3.0* 2.6
Government 0.6* 1.0* 1.3
Other 0.3* 0.2* 0.4
Unknown 0.0 0.2* 0.4
Any Non-Traditional Credit 60.2* 70.7* 80.0
Owner Loans 17.5* 14.2* 16.8
Personal Credit Cards 40.7* 46.0* 46.7
Business Credit Cards 28.8* 34.1* 48.1
Number of observations 4,637 3,561 4,240
Note: *=alpha less than or equal to 0.05.
3
More information is included for other subsamples in Appendix A. For further analysis of the likelihood of holding each type of loan from 1993 to 2003 please see Appendix B.
Table D reports the number of firms using from zero to more than three loans. While the proportion of firms with no loans has remained constant at around 40 percent, the proportion of firms with more than 3 loans has declined substantially, from over 12.5 percent in 1993 to less than 7.7 percent in 2003.
Table D Number of all small firms using credit, 1993 through 2003
Number of Loans 1993 1998 2003 (number of firms) None 2,041,263 2,502,274 2,492,470 1 1,243,286 1,303,333 1,763,756 2 697,395 679,942 1,027,015 3 377,726 311,682 532,666 More than 3 634,487 494,015 482,181 Number of observations 5,356 3,561 4,240
Table E examines the changes in aggregate value of each type of loan from 1993 through 2003 in constant 2003 dollars.In real terms, the amount of credit outstanding in traditional and non-traditional loans has increased by over 62 percent (from $869.1 bil-lion in 1993 to $1.4 tilbil-lion in 2003). The most important change has occurred with line of credit and mortgage loans. In 1993, line of credit loans comprised 37 percent of all credit, while mortgages comprised 22 percent of all credit. In 2003, line of credit loans com-prised just 28 percent, and mortgages comcom-prised 34.6 percent of all credit. The use of personal and business credit cards has been discussed widely in the popular press, how-ever these credit cards comprise less than 1 percent of all credit outstanding.
Table F shows the changes in aggregate value of loans held by each type of sup-plier from 1993 through 2003 in constant 2003 dollars. Small firms have a higher prob-ability of using a depository institution, and they held an 11.2 percent larger share of their total loans with depository institutions in 2003 than in1993 (51.3 percent in 1993 and 57.0 percent in 2003). The share of total loans held by depository institutions increased, led by commercial banks whose share increased by 6.7 percent. Non-depository institu-tions’ share of loans rose nearly 11 percent, with finance companies increasing their share by over 23 percent (11.5 percent in 1993 to 14.1 percent in 2003). The gains by deposi-tory and non-deposideposi-tory institutions were offset by a decrease of nearly 25 percent in the share of loans held by non-financial institutions. Loans from family and friends and other businesses decreased substantially, while the share of loans held by government programs increased substantially, from less than 1 percent to over 3 percent.
Table E Aggregate value and shares of all small firm debt, by sources of credit, 1993 through 2003
Source of Credit 1993 1998 2003
Any credit
Any traditional loan Line of credit Mortgage Vehicle Equipment Lease Other
Any non-traditional loan Owner loan
Credit cards (personal and business)
(x $1 million - constant 2003 dollars)
869,056 767,508 1,408,819 767,782 667,411 1,247,963 321,850 227,375 395,267 190,543 234,119 487,708 34,117 36,898 63,476 63,006 64,189 90,045 34,239 38,945 40,142 124,027 65,886 171,325 101,275 100,097 160,856 98,442 94,866 148,323 2,833 5,231 12,532
Shares of aggregate loan amounts
Source of Credit 1993 1998 2003
Any credit
Any traditional loan Line of credit Mortgage Vehicle Equipment Lease Other
Any non-traditional loan Owner loan
Credit cards (personal and business)
100.0 88.3 37.0 21.9 3.9 7.2 3.9 14.3 11.7 11.3 0.3 (percentages) 100.0 87.0 29.6 30.5 4.8 8.4 5.1 8.6 13.0 12.4 0.7 100.0 88.6 28.1 34.6 4.5 6.4 2.8 12.2 11.4 10.5 0.9 Number of observations 4,637 3,561 4,240
Table F Aggregate value of all small firm debt, by suppliers of credit, 1993 through 2003
Suppliers 1993 1998 2003
Any Credit
Any Traditional Loan Any Depository Institution Credit Union
Thrift
Commercial Bank
Any Non-Depository Institution Finance Company
Brokerage Leasing
Other Non-depository Any Non-Financial Institution Family & Friends
Other Businesses Government Other Unknown
Any Non-Traditional Credit Owner Loans
Credit cards (personal and business)
(x $1 million - constant 2003 dollars)
869,056 767,508 1,408,819 767,782 667,411 1,247,963 445,535 457,602 803,095 3,142 3,771 6,771 27,528 22,138 78,901 414,865 431,693 717,423 189,867 143,535 340,805 99,511 82,258 198,819 14,004 1,828 12,497 21,784 18,642 39,179 54,568 40,806 90,310 85,813 50,326 104,063 38,373 30,599 37,729 33,710 11,001 17,653 7,785 6,673 44,223 5,945 2,052 2,696 46,566 15,948 1,762 101,275 100,097 160,856 98,442 94,866 148,323 2,833 5,231 12,532
Shares of aggregate loan amounts
Suppliers 1993 1998 2003
Any Credit
Any Traditional Loan Any Depository Institution Credit Union
Thrift
Commercial Bank
Any Non-Depository Institution Finance Company
Brokerage Leasing
Other Non-depository Any Non-Financial Institution Family & Friends
Other Businesses Government Other Unknown
Any Non-Traditional Credit Owner Loans
Credit cards (personal and business)
100.0 88.3 51.3 0.4 3.2 47.7 21.8 11.5 1.6 2.5 6.3 9.9 4.4 3.9 0.9 0.7 5.4 11.7 11.3 0.3 (percentages) 100.0 87.0 59.6 0.5 2.9 56.2 18.7 10.7 0.2 2.4 5.3 6.6 4.0 1.4 0.9 0.3 2.1 13.0 12.4 0.7 100.0 88.6 57.0 0.5 5.6 50.9 24.2 14.1 0.9 2.8 6.4 7.4 2.7 1.3 3.1 0.2 0.1 11.4 10.5 0.9 Number of observations 4,637 3,561 4,240
Table G shows the share of traditional debt held by small firms from 1993 through 2003 by loan source and supplier. Commercial banks remain the dominant source of line of credit loans, with percentage credit lines held by commercial banks in-creasing from just over 70 percent in 1993 to nearly 80 percent in 2003. The share of credit lines held by finance companies has remained relatively constant (around 13 per-cent to 14 perper-cent) since 1993. All other lenders hold less than 2 perper-cent of total line of credit loans, except thrifts. Thrifts realized an increase in their share of line of credit loans, from just over 1 percent in 1993 to nearly 3.5 percent in 2003. Appendix A con-tains additional information on loan shares by source and supplier for each category of legal organization (Tables 1.7a through 1.7e.)
Leasing companies compete with commercial banks and finance companies for capital leases. Commercial banks saw their share of capital leases decline from nearly 30 percent in 1993 to under 7 percent in 2003. Finance companies saw their share of capital leases increase from nearly 19 percent in 1993 to over 22 percent in 2003. The most sub-stantial gain was realized by leasing companies, which saw their share increase from just over 36 percent in 1993 to nearly 66 percent in 2003.
Commercial banks, thrifts and finance companies have been the major players in the business mortgage market. Commercial banks have been the dominant player in the market, with over 50 percent of all business mortgages held by them since 1998, although commercial banks saw their share of business mortgages decline slightly over the past five years. Thrifts and finance companies realized a substantial gain in market share, with thrift shares increasing from 9.3 percent in 1993 to nearly 12 percent in 2003 and finance company shares increasing from 8 percent in 1993 to over 11 percent in 2003. Other lenders classified as “other non-depository institutions” played a major, yet declining, role in the business mortgage market, with their share declining from nearly 25 percent in 1993 to 16 percent in 2003.
Commercial banks and finance companies are dominant lenders in the vehicle loan market with shares exceeding 40 percent in 2003. Commercial banks held over 40 percent of the shares of vehicle loans since 1993. Their share was been relatively constant while finance companies saw their share increase from nearly 44 percent in 1993 to over 49 percent in 2003. Credit unions and thrifts were the only other institutions holding more than 2 percent of the market. Credit unions realized a twofold increase, from 2.4 percent in 1993 to 4.9 percent in 2003. Thrifts realized a nearly threefold increase, from 1.1 percent in 1993 to nearly 3 percent in 2003.
Table G_93 Share of aggregate value of traditional debt held by small firms, by source and supplier of credit, 1993
Source Line of credit Lease Mortgage Vehicle Equipment Other loans All Credit union
Savings and loan Commercial bank Finance company Brokerage Leasing Other non-depository Family Other business Government Other individual Not classified All 0.09 1.30 70.25 14.51 1.78 0.81 0.58 0.86 0.42 0.08 0.10 9.23 100.00 1.97 0.96 29.85 18.87 0.14 36.48 0.22 3.01 5.04 0.05 0.01 3.40 100.00 0.52 9.29 44.59 8.03 3.43 0.07 24.86 2.97 3.12 1.10 0.02 2.00 100.00 2.43 1.12 43.45 43.74 0.14 5.42 0.05 1.16 1.75 0.13 0.04 0.58 100.00 0.09 1.18 58.26 21.05 0.02 5.37 0.08 2.14 6.33 1.75 0.05 3.68 100.00 0.24 3.38 33.91 2.31 1.32 1.06 4.18 21.93 16.21 3.44 4.47 7.55 100.00 0.41 3.59 54.03 12.96 1.82 2.84 7.11 5.00 4.39 1.01 0.77 6.07 100.00 Number of Observations 4,637
Table G_98 Share of aggregate value of traditional debt held by small firms, by source and supplier of credit, 1998
Source Line of credit Lease Mortgage Vehicle Equipment Other loans All Credit union
Savings and loan Commercial bank Finance company Brokerage Leasing Other non-depository Family Other business Government Other individual Not classified All 0.15 1.00 86.60 9.74 0.31 0.05 0.16 0.00 0.15 0.20 0.05 1.60 100.00 0.28 0.59 27.06 18.15 0.94 39.30 0.07 0.99 10.32 0.06 0.06 2.18 100.00 0.72 7.69 57.36 8.46 0.09 0.03 17.06 3.86 0.30 1.24 0.75 2.45 100.00 3.39 1.23 49.83 39.65 0.03 2.08 0.11 0.85 0.31 0.00 0.11 2.42 100.00 0.22 0.11 59.05 26.44 0.07 3.65 0.04 0.39 1.62 1.59 0.00 6.82 100.00 0.37 1.70 51.09 2.49 0.75 0.08 0.65 31.27 7.16 3.47 0.26 0.71 100.00 0.57 3.32 64.68 12.32 0.27 2.79 6.11 4.58 1.64 1.00 0.32 2.39 100.00 Number of Observations 3,561
Table G_03 Share of aggregate value of traditional debt held by small firms, by source and supplier of credit, 2003
Supplier Line of credit Lease Mortgage
Source
Vehicle Equipment Other Total Credit union
Savings and loan Commercial bank Finance company Brokerage Leasing Other non-depository Family Other business Government Other individual Not classified All 0.10 3.49 79.81 13.36 1.04 0.39 0.31 0.07 0.27 1.14 0.00 0.01 100.00 0.00 0.82 6.72 22.58 0.11 65.93 0.04 0.20 2.83 0.02 0.39 0.37 100.00 0.32 11.78 53.07 11.10 1.09 0.00 16.03 1.71 0.16 4.23 0.26 0.24 100.00 4.90 2.93 40.45 49.36 0.06 0.67 0.08 0.26 1.06 0.04 0.01 0.18 100.00 0.33 4.27 47.62 28.87 0.84 11.46 0.31 2.34 3.08 0.59 0.10 0.20 100.00 0.82 0.95 41.94 14.87 1.29 0.25 6.14 15.61 6.56 10.83 0.68 0.06 100.00 0.54 6.32 57.49 15.93 1.00 3.14 7.24 3.02 1.41 3.54 0.22 0.14 100.00 Number of Observations 4,240
Prior to 2003, nearly 80 percent of the equipment loan market was held by com-mercial banks and finance companies, with comcom-mercial banks holding nearly 60 percent of the market and finance companies holding 20 to 25 percent of the market. Since 1998, the share of equipment loans has declined by nearly 20 percent for commercial banks (59.1 percent in 1998 and 47.6 percent in 2003) and increased threefold for leasing com-panies (3.7 percent in 1998 and 11.5 percent in 2003).
The other traditional loan category was dominated by commercial banks, finance companies, family, other businesses and government in 2003. Since 1993 the share of other traditional loans held by commercial banks, families/friends, and other businesses has fallen, while the share held by finance companies and government has increased.
Additional tables are available on the Office of Advocacy’s website (see Appen-dix A for details.) These show the probability of borrowing by loan source and supplier by selected firm characteristics (number of employees, gross sales, industrial classifica-tion and legal organizaclassifica-tion). They also highlight: all firms, tradiclassifica-tional borrowers, minor-ity-owned, black-owned, Hispanic-owned, woman-owned, fast growth (10 percent annual growth or more), young (less than four years old) and corporate (more than one owner).
The descriptive statistics discussed above have examined all types of loans for depository, non-depository and non-financial lenders. The largest share of small business lending over the last decade has been held by commercial banks and finance companies. The remaining analysis in this study examines changes in the shares of commercial bank and finance company lending from 1993 to 2003, and examines the relationship between commercial banks and finance companies by assessing whether they are complements or substitutes. This part of the study considers the actions of borrowers only.
For the average firm, the share of all loans held by commercial banks has de-creased by nearly 11 percent (42 percent in 1993 to 38 percent in 2003) since 1993, while the share of all loans held by finance companies has increased by 45 percent (11 percent in 1993 to 16 percent in 2003). The shares lost by the commercial banks appear to have been captured by finance companies.
Table H shows the changes in the shares of all loans held by commercial banks and finance companies from 1993 to 2003 and from 1998 to 2003 for several firm and owner characteristics. Those borrowers filing for bankruptcy in the past three years real-ized nearly a 30 percent decline in the share of loans held by commercial banks. The smallest businesses (0 employees), those hiring 20-99 employees and those in business 20 years of more realized a significant decline in the share of loans held by commercial banks from 1993 to 2003. Manufacturing businesses increased their share of loans held by commercial banks, while service businesses’ share decreased. Other significant de-clines in the share of commercial bank loans were seen by urban-based small businesses, sole proprietorships and partnerships, older owners, more experienced owners, men-owned businesses and non-minority businesses. A similar pattern exists when comparing the shares of loans held by commercial banks in 1998 and 2003.
Table
H Commercial Bank and Finance Company Shares by Business and Owners Borrower Characteristics for 1993, 1998 and 2003 Characteristic Commercial Bank 1993 1998 2003 Finance 1993 Company 1998 2003 All Borrowers
Owner filed for bankruptcy in last 3 years no yes Number of employees 0 1 - 4 5 - 9 10 - 19 20 - 99 99 - 499 Age of the firm Less than 4 years 4 - 9
10 - 19 20 or more
Industrial classification Mining and construction Manufacturing
Transportation Wholesale trade Retail trade
Finance, insurance, real estate Services Rural location no yes Legal organization Sole proprietorship Partnership Corporation, subchapter s Corporation, regular 0.42* 0.48* 0.35 0.47* 0.48 0.44 0.48 0.58* 0.60 0.39 0.44 0.51 0.53* 0.47 0.41* 0.44 0.57 0.48 0.53 0.47* 0.61* 0.44 0.48* 0.58* 0.45 0.47 0.43* 0.51* 0.36 0.46* 0.47 0.56* 0.53 0.55 0.66 0.41 0.46 0.56* 0.56* 0.58* 0.49 0.40 0.52 0.54* 0.49 0.48* 0.61* 0.48* 0.48* 0.61* 0.51* 0.51 0.38 0.46 0.25 0.37 0.47 0.42 0.53 0.52 0.62 0.39 0.42 0.48 0.49 0.45 0.52 0.36 0.52 0.48 0.47 0.42 0.50 0.44 0.43 0.46 0.45 0.50 0.11* 0.12* 0.17 0.12* 0.12* 0.12* 0.17 0.11* 0.11 0.14 0.13* 0.11* 0.11* 0.16* 0.13 0.22 0.11* 0.13 0.03* 0.11* 0.08* 0.13* 0.12* 0.08 0.12* 0.14* 0.12* 0.14* 0.23 0.17* 0.16 0.13* 0.12 0.11* 0.14 0.18 0.15* 0.12* 0.14* 0.18* 0.09* 0.22 0.15 0.11 0.09 0.16* 0.10* 0.15* 0.17* 0.10 0.13* 0.13* 0.16 0.19 0.34 0.27 0.18 0.17 0.13 0.18 0.15 0.16 0.19 0.21 0.19 0.26 0.13 0.29 0.17 0.12 0.13 0.22 0.19 0.19 0.23 0.12 0.18 0.18
Table H Commercial Bank and Finance Company Shares by Business and Owners Borrower Characteristics for 1993, 1998 and 2003 (continued)
Characteristic Commercial Bank 1993 1998 2003 Finance Company 1993 1998 2003 Owner age Less than 25 25 - 34 35 - 44 45 - 54 55 - 64 65 and older Owner experience Less than 4 years 4 - 9 10 - 19 20 or more Owner gender Man Woman Owner race White Non-white 0.00* 0.35 0.44 0.50* 0.54* 0.54 0.35 0.41 0.48* 0.52* 0.49* 0.44 0.49* 0.37* 0.39 0.43 0.46 0.54* 0.52* 0.55 0.42 0.42 0.52* 0.54* 0.52* 0.47 0.52* 0.41 0.46 0.39 0.42 0.46 0.47 0.48 0.45 0.45 0.43 0.46 0.46 0.41 0.45 0.48 0.02 0.17 0.13* 0.11* 0.10* 0.12* 0.13 0.12* 0.13* 0.11* 0.12* 0.12* 0.12* 0.13* 0.07 0.14 0.16* 0.13* 0.13* 0.17 0.23* 0.13 0.13* 0.15* 0.14* 0.14* 0.14* 0.15 0.11 0.15 0.21 0.19 0.19 0.21 0.13 0.18 0.19 0.21 0.19 0.20 0.19 0.20 Number of observations 2,969 # 2,017 2,651 2,969 2,017
Note: * = alpha less or equal to 0.05; columns after 1993 compare 1993 and 2003; columns after 1998 compare 1998 and 2003.
2,651
A nearly opposite pattern exists for finance companies. Borrowers who have filed for bankruptcy in the past three years saw their share of loans held by finance companies increase from 1993 to 2003. The share of loans held by finance companies increased for nearly all sizes and ages of small businesses. Finance companies seem to be especially interested in mining/construction, wholesale trade, finance/insurance/real estate (FIRE) and service businesses. Both rural and urban businesses and all types of legal organiza-tions (except partnerships), realized significant increases in the share of finance company loans. In addition, older, more experienced, men and women owners, and non-minority owners realized increases in the share of loans held by finance companies from 1993 to
2003. A similar pattern emerges when comparing the share of loans held by finance com-panies from 1998 to 2003.
Tables B through H focused on the loans by source and supplier. However, a more complete review of all liabilities is needed to assess the debt structure of these firms. Appendix A–Tables 1.8a through 9.9a review all liabilities held by small firms by asset and employment size categories.
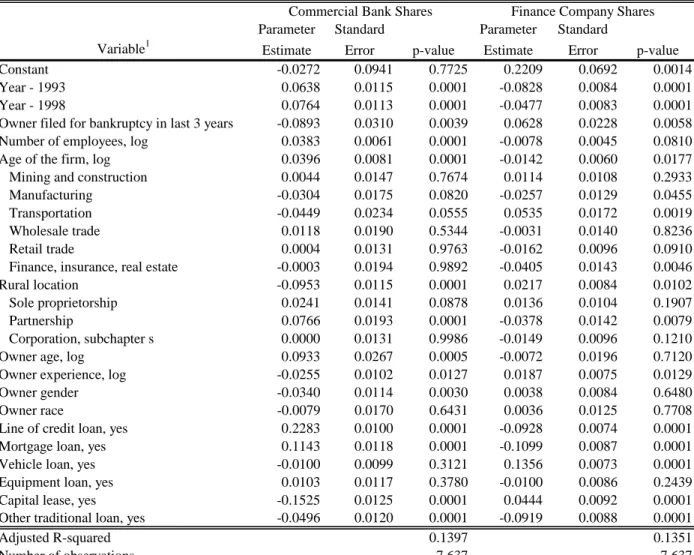
The multivariate analysis reported in Table I largely supports the bivariate analy-sis reported in Table H. After controlling for business and owner characteristics, com-mercial bank shares decreased significantly between 1993 and 2003 (and 1998 and 2003). Several of the control variables warrant further discussion. Owners filing for bankruptcy in the past three years, those living in rural areas, those owners with more experience, women-owned small business, and those holding capital leases or other traditional loans had a smaller share of commercial bank loans than other firms. Larger and older firms had a larger share of loans held by commercial banks. Partnerships had a larger share of loans with commercial banks than firms organized as C corporations. Older owners had a larger share of loans with commercial banks than younger owners. Those owners holding lines of credit and mortgage loans had a larger share of loans with commercial banks than other borrowers.
Table I Determinants of commercial bank and finance company shares of all loans (1993, 1998 and 2003)
Variable1
Commercial Bank Shares
Parameter Standard
Estimate Error p-value
Finance Company Shares
Parameter Standard
Estimate Error p-value
Constant Year - 1993 Year - 1998
Owner filed for bankruptcy in last 3 years Number of employees, log
Age of the firm, log Mining and construction Manufacturing
Transportation Wholesale trade Retail trade
Finance, insurance, real estate Rural location
Sole proprietorship Partnership
Corporation, subchapter s Owner age, log
Owner experience, log Owner gender Owner race
Line of credit loan, yes Mortgage loan, yes Vehicle loan, yes Equipment loan, yes Capital lease, yes Other traditional loan, yes
-0.0272 0.0638 0.0764 -0.0893 0.0383 0.0396 0.0044 -0.0304 -0.0449 0.0118 0.0004 -0.0003 -0.0953 0.0241 0.0766 0.0000 0.0933 -0.0255 -0.0340 -0.0079 0.2283 0.1143 -0.0100 0.0103 -0.1525 -0.0496 0.0941 0.0115 0.0113 0.0310 0.0061 0.0081 0.0147 0.0175 0.0234 0.0190 0.0131 0.0194 0.0115 0.0141 0.0193 0.0131 0.0267 0.0102 0.0114 0.0170 0.0100 0.0118 0.0099 0.0117 0.0125 0.0120 0.7725 0.0001 0.0001 0.0039 0.0001 0.0001 0.7674 0.0820 0.0555 0.5344 0.9763 0.9892 0.0001 0.0878 0.0001 0.9986 0.0005 0.0127 0.0030 0.6431 0.0001 0.0001 0.3121 0.3780 0.0001 0.0001 0.2209 -0.0828 -0.0477 0.0628 -0.0078 -0.0142 0.0114 -0.0257 0.0535 -0.0031 -0.0162 -0.0405 0.0217 0.0136 -0.0378 -0.0149 -0.0072 0.0187 0.0038 0.0036 -0.0928 -0.1099 0.1356 -0.0100 0.0444 -0.0919 0.0692 0.0084 0.0083 0.0228 0.0045 0.0060 0.0108 0.0129 0.0172 0.0140 0.0096 0.0143 0.0084 0.0104 0.0142 0.0096 0.0196 0.0075 0.0084 0.0125 0.0074 0.0087 0.0073 0.0086 0.0092 0.0088 0.0014 0.0001 0.0001 0.0058 0.0810 0.0177 0.2933 0.0455 0.0019 0.8236 0.0910 0.0046 0.0102 0.1907 0.0079 0.1210 0.7120 0.0129 0.6480 0.7708 0.0001 0.0001 0.0001 0.2439 0.0001 0.0001 Adjusted R-squared Number of observations
1 Reference groups are year 2003, service industry and regular corporation.
0.1397 7,637
0.1351 7,637
After controlling for business and owner characteristics, finance company shares increased significantly between 1993 and 2003 (and 1998 and 2003). Older firms held a smaller percentage of loans with finance companies than younger firms. Firms engaged in manufacturing or FIRE industries held a smaller percentage of loans with finance com-panies than firms engaged in service industries. Partnerships held a smaller percentage of loans with finance companies than regular corporations. Firms holding lines of credit, mortgage and other traditional loans held a smaller percentage of loans with finance companies than other firms. Owners filing for bankruptcy in the past three years had a larger share of finance company loans than other firms. Firms engaged in the transporta-tion industries held a larger percentage of loans with finance companies than firms en-gaged in the service industry. Firms located in rural areas and owners with more
experi-ence held a higher percentage of loans with finance companies than other firms. And fi-nally, firms holding vehicle loans and capital leases held a larger percentage of loans with finance companies than other borrowers.
The final analysis in this study examines the relationship between commercial banks and finance companies from 1993 to 2003 (Table J) and 1998 to 2003 (Table K).
Table J Determinants of commercial bank loan amounts (complements/substitutes), 1993 to 2003
1
Variable
Commercial Bank Amount
Parameter Standard
Estimate Error p-value
Constant
Finance company loan amount, log Year 2003
Interaction - finance company loan and year 2003 Owner filed for bankruptcy in last 3 years Number of employees, log
Age of the firm, log Mining and construction Manufacturing
Transportation Wholesale trade Retail trade
Finance, insurance, real estate Rural location
Sole proprietorship Partnership
Corporation, subchapter s Owner age, log
Owner experience, log Owner gender Owner race
Line of credit loan, yes Mortgage loan, yes Vehicle loan, yes Equipment loan, yes Capital lease, yes
Other traditional loan, yes
-2.5804 -0.3254 -0.2004 0.0336 -1.2556 0.9559 0.0917 -0.0775 -0.1540 0.6153 0.8126 0.2583 0.2818 -0.4263 -0.3873 0.4332 -0.0662 1.2571 -0.0385 -0.5014 0.0976 4.6468 3.1907 2.3057 1.5226 0.0902 1.1079 1.1643 0.0219 0.1451 0.0265 0.3923 0.0768 0.1025 0.1854 0.2205 0.2934 0.2407 0.1636 0.2449 0.1439 0.1773 0.2438 0.1643 0.3358 0.1295 0.1461 0.2156 0.1259 0.1528 0.1352 0.1472 0.1644 0.1514 0.0267 0.0001 0.1672 0.2044 0.0014 0.0001 0.3713 0.6758 0.4849 0.0360 0.0007 0.1145 0.2499 0.0031 0.0290 0.0756 0.6872 0.0002 0.7664 0.0006 0.6509 0.0001 0.0001 0.0001 0.0001 0.5834 0.0001 Adjusted R-squared Number of observations 1
Reference groups are year 2003, service industry and regular corporation.
0.3414 5,620
Table K Determinants of commercial bank loan amounts (complements/substitutes), 1998 to 2003
1
Variable
Commercial Bank Amount
Parameter Standard
Estimate Error p-value
Constant
Finance company loan amount, log Year 2003
Interaction - finance company loan and year 2003 Owner filed for bankruptcy in last 3 years Number of employees, log
Age of the firm, log Mining and construction Manufacturing
Transportation Wholesale trade Retail trade
Finance, insurance, real estate Rural location
Sole proprietorship Partnership
Corporation, subchapter s Owner age, log
Owner experience, log Owner gender
Owner race
Line of credit loan, yes Mortgage loan, yes Vehicle loan, yes Equipment loan, yes Capital lease, yes
Other traditional loan, yes
-0.9449 -0.3380 -0.1359 0.0327 -1.0003 0.9776 0.2291 0.4684 0.2334 0.3471 0.2279 0.4068 -0.0252 -0.3440 -0.6113 0.2945 -0.1820 0.6387 0.0514 -0.2258 0.1300 4.6985 3.0979 2.3887 1.5142 0.4398 1.0330 1.2876 0.0226 0.1558 0.0275 0.4477 0.0838 0.1095 0.2034 0.2401 0.3078 0.2695 0.1812 0.2643 0.1589 0.2016 0.2700 0.1838 0.3642 0.1361 0.1533 0.2231 0.1357 0.1525 0.1492 0.1675 0.1738 0.1679 0.4631 0.0001 0.3834 0.2346 0.0255 0.0001 0.0365 0.0213 0.3311 0.2594 0.3979 0.0248 0.9242 0.0305 0.0024 0.2754 0.3220 0.0795 0.7056 0.1410 0.5602 0.0001 0.0001 0.0001 0.0001 0.0114 0.0001 Adjusted R-squared Number of observations 1
Reference groups are year 2003, service industry and regular corporation.
0.3636 4,667
This analysis utilizes the log of total commercial bank and finance company loans to examine whether commercial bank and finance company loans are complements or substitutes. Increases in finance company loan amounts were associated with decreases in commercial bank loan amounts suggesting that commercial bank and finance company loans are substitutes, rather than complements in both regression runs (Tables J and K). When controlling for owner and business characteristics and loan types, the dollar amount of commercial bank loans was unchanged from 1993 to 2003 (Table J) and 1998 to 2003 (Table K).
Other control variables also warrant discussion in the analysis (Table J). Business owners with recent bankruptcy experience, those located in rural areas, sole proprietors and women-owned businesses held smaller loans with commercial banks in the regres-sion using data from 1993 and 2003 (Table J). Larger firms, those engaged in transporta-tion or wholesale trade and older owners held higher loan amounts with commercial banks. In addition, those holding all traditional loans, except capital leases, held higher loan amounts with commercial banks.
Other control variables also warrant further discussion in Table K. Business own-ers with recent bankruptcy experience, those located in rural areas, and sole proprietors held a smaller amount of their loans with commercial banks in the regression using data from 1998 and 2003. Larger firms, older firms and those engaged in mining/construction or retail trade held a larger amount of their loans with commercial banks. Those firms holding any traditional loan held a larger amount of their loans with commercial banks.
5. Conclusions
This descriptive study documents the dominance of commercial banks and the rise of fi-nance companies over the decade from 1993 to 2003 for small business borrowers. Commercial banks remained the dominant player in the market with over 40 percent of all firms holding at least one loan with a commercial bank. On average, small business borrowers held 42 percent of all loans with commercial banks in 2003. In addition, over 47 percent of aggregate small business loans were held by commercial banks in 2003. Finance companies were the second most significant player in the market, with over 22 percent of all firms holding at least one loan with a finance company. On average, small business borrowers held about 16 percent of all loans with finance companies in 2003. In addition, over 11 percent of the aggregate value of small business loans was held by fi-nance companies. More than 45 percent of all small businesses utilize business and per-sonal credit cards; however, credit card financing (that is, having an outstanding balance at the end of the month) comprised less than 1 percent of the aggregate value of small business loans.
A report prepared for the SBA five years ago (Haynes, 2005), drew the following conclusions:
The continued deregulation of commercial banks in interstate banking, as well as the relaxation of regulations on national banks and bank holding companies, has enabled commercial banks to consolidate and expand. As a result, banking assets have increased significantly during the past decade and have been concentrated in the hands of giant banks and especially bank holding companies. . . . While finance companies have successfully increased their market share of asset-backed
loans, they appeared to have made no progress in encroaching into the market for lines of credit. . . .Commercial banks have gained additional market share in line of credit lending, and have the potential to gain additional market share in asset-backed lending by forming finance company subsidiaries. While finance
companies appear to have gained some market share for equipment loans, there appears to be no evidence of finance company encroachment into the market share held by commercial banks. The most substantial decreases in market share were realized by leasing companies and other businesses loaning money to small businesses. (Haynes, 2005)
A similar situation exists for commercial banks and finance companies in 2003. The current research extends the 2004 study by more carefully examining the relationship between commercial banks and finance companies. The aggregate statistics suggest that commercial bank shares decreased from 42 percent to 38 percent, while finance company shares increased from 11 percent to 16 percent (Table H). This aggregate result is sup-ported by more rigorous analyses controlling for business, owner, and loan types. When considering the average shares held by commercial banks and finance companies for all small business borrowers, commercial bank shares decreased and finance company shares increased from 1993 to 2003 (Table I). Although no loan price information is util-ized in this study, this study does suggest that commercial banks and finance companies are substitute lending institutions (Tables J and K).
It is important for policymakers and agency administrators to understand this rela-tionship between commercial banks and finance companies more fully. Most importantly, the findings in this study show that, all else equal, firms borrowing more from finance companies will borrow less from commercial banks. This finding may suggest that firms with credit from one source find it more difficult to obtain credit from another source. This substitute relationship may exist because obtaining the initial credit is a negative signal about borrower quality or perhaps because finance companies provide mentoring and other services not provided by commercial banks. This critical relationship between commercial banks and finance companies warrants further review.
6. References
Ang, J. S. (1992). On the theory of finance for privately held firms, Journal of Small Business Finance, 1(3), 185-203.
Aronson, R. L. (1991). Self-Employment: A Labor Market Perspective. Ithaca, NY: ILR Press. Bates, T. (1991). Commercial bank financing of white- and black-owned small business start-ups.
Berger, A. N. and Udell, G. F. (1990). Collateral, loan quality, and bank risk, Journal of Mone-tary Economics, 25(1), 21-42.
Bureau of Labor Statistics (2008). Producer price index. http://data.bls.gov/PDQ/servlet/Survey OutletServlet.
Chaganti, R., DeCarolis, D., and Deeds, D. (1996). Predictors of capital structure in small ven-tures, Entrepreneurship Theory and Practice, 20, 7-18.
Haynes, G.W., Onochie, J. and Muske, G. (2007). Is what’s good for business, good for the fam-ily in famfam-ily business? Journal of Family and Economic Issues, 28(1), 395-409.
Haynes, G.W. (2005) Finance Companies and Small Business Borrowers: Evidence from the 1993 and 1998 Surveys of Small Business Finances, 2005. U.S. Small Business Admini-stration, Office of Advocacy: www.sba.gov/advo/research/rs255tot.pdf (report);
www.sba.gov/advo/research/rs255.pdf (research summary).
Haynes, G.W. and Ou C. (2003). Uses of Equity Capital by Small Firms: Findings from the Na-tional Survey of Small Business Finances. Working paper for the Small Business Ad-ministration, Office of Advocacy; http://www.sba.gov/advo/stats/wkp03co.pdf.
Haynes, G.W. (2002). Changes in the Financial Structure of Small Businesses from 1993 to 1998,
Monograph for the U.S. Small Business Administration, Office of Advocacy, Washing-ton, DC.
Jensen, M.C. and Meckling, W.H. (1976). Theory of firm–managerial behavior, agency costs and ownership structure, Journal of Financial Economics, 3(4), 305-360.
Lee, I., Lockhead, S., Ritter, J. and Zhao, Q. (1996). The costs of raising capital, Journal of Fi-nancial Research, 19(1), 59-74.
Mach, T. L., and Wolken, J.D. (2006). Financial services used by small businesses: Evidence from the 2003 Survey of Small Business Finances, Federal Reserve Bulletin, (October), 167-195.
Modigliani, F. and Miller M. (1958). The cost of capital, corporation finance and the theory of investment, The American Economic Review, 48(3), 261-297
Modigliani, F. and Miller M. (1963). Corporate income taxes and the cost of capital: A correc-tion, The American Economic Review, 53(3), 433-443.
Myers, S. C. (1984). The capital structure puzzle, Journal of Finance, 39(3), 575-592.
Myers, S. C. and Majluf, N. S. (1984). Corporate financing and investment decisions when firms have information that investors do not, Journal of Financial Economics, 13(2), 187-221. Ou, C. and Haynes, G.W. (2006). Acquisition of additional equity capital by small firms:
Find-ings from the National Survey of Small Business Finances, Small Business Economics Journal, 27(2-3), 157-168
Stiglitz, J. (1985). Credit markets and capital control, Journal of Money, Credit and Banking, 17(2), 133-52.
Stiglitz, J. E. and Weiss, A. (1981). Credit rationing in markets with imperfect information,
American Economic Review, 71(3), 393-410.
Appendix A: Contents of Online Statistical Addendum
A statistical addendum contains numerous data tables from the SSBF.
The tables mentioned in the report (Tables 1.1a through 9.9a) are located at: http://www.sba.gov/advo/stats/rssbf_98.xls.
Table A.1 enumerates the complete set of SSBF patterns tables. These were originally submitted on compact disk, and are now contained in a compressed file located at: http://www.sba.gov/advo/stats/tabssbf03.zip.These tables are numbered as follows:
Summary tables for the percentage of small firms using credit by sources of credit (Tables 1.1a through 9.1e);
Percentage of small firms using credit by suppliers of credit (Tables 1.2a through 9.2e);
Number of firms with 0, 1, 2, 3 or more than 3 types of loans (Tables 1.3a through 9.3a);
Aggregate value of all debt held by small firms by sources of credit (Tables 1.4a through 9.4e);
Aggregate value of all debt held by small firms by suppliers of credit (Tables 1.5a through 9.5e);
Share of aggregate value of all debt held by small firms by sources of credit (Tables 1.6a through 9.6a);
Proportion of small firms borrowing by sources and suppliers of credit (Tables 1.7a through 1.7e).
In addition, balance sheet information is available for all firms only as follows: Balance sheet information by asset size categories
(Tables 1.8a through 9.8a); and
Balance sheet information for all firms by employment size categories (Tables 1.9a through 9.9a).
Table A.1 Summary of Tables on Compact Disk using 2003 SSBF
All firms
Traditional
Borrowers Minority Black Hispanic Women Fast
Growth Younger
Corporate >1 owner
Percentage of small firms using credit 1.1a 2.1a 3.1a 4.1a 5.1a 6.1a 7.1a 8.1a 9.1a
by sources of credit 1.1b 2.1b 3.1b 4.1b 5.1b 6.1b 7.1b 8.1b
1.1c 2.1c 3.1c 4.1c 5.1c 6.1c 7.1c 8.1c
1.1d 2.1d 3.1d 4.1d 5.1d 6.1d 7.1d 8.1d 9.1d
1.1e 2.1e 3.1e 4.1e 5.1e 6.1e 7.1e 8.1e 9.1e
Percentage of small firms using credit 1.2a 2.2a 3.2a 4.2a 5.2a 6.2a 7.2a 8.2a 9.2a
by suppliers of credit 1.2b 2.2b 3.2b 4.2b 5.2b 6.2b 7.2b 8.2b
1.2c 2.2c 3.2c 4.2c 5.2c 6.2c 7.2c 8.2c
1.2d 2.2d 3.2d 4.2d 5.2d 6.2d 7.2d 8.2d 9.2d
1.2e 2.2e 3.2e 4.2e 5.2e 6.2e 7.2e 8.2e 9.2e
Number of small firms with 0, 1, 2, 3 1.3a 2.3a 3.3a 4.3a 5.3a 6.3a 7.3a 8.3a 9.3a
and more than 3 types of loans
Aggregate value of all debt held by 1.4a 2.4a 3.4a 4.4a 5.4a 6.4a 7.4a 8.4a 9.4a
small firms by sources of credit 1.4b 2.4b 3.4b 4.4b 5.4b 6.4b 7.4b 8.4b
1.4c 2.4c 3.4c 4.4c 5.4c 6.4c 7.4c 8.4c
1.4d 2.4d 3.4d 4.4d 5.4d 6.4d 7.4d 8.4d 9.4d
1.4e 2.4e 3.4e 4.4e 5.4e 6.4e 7.4e 8.4e 9.4e
Aggregate value of all debt held by 1.5a 2.5a 3.5a 4.5a 5.5a 6.5a 7.5a 8.5a 9.5a
small firms by suppliers of credit 1.5b 2.5b 3.5b 4.5b 5.5b 6.5b 7.5b 8.5b
1.5c 2.5c 3.5c 4.5c 5.5c 6.5c 7.5c 8.5c
1.5d 2.5d 3.5d 4.5d 5.5d 6.5d 7.5d 8.5d 9.5d
1.5e 2.5e 3.5e 4.5e 5.5e 6.5e 7.5e 8.5e 9.5e
Share of aggregate value of all debt 1.6a 2.6a 3.6a 4.6a 5.6a 6.6a 7.6a 8.6a 9.6a
held by small firms by sources of credit
Proportion of small businesses borrowing 1.7a by source and supplier of credit 1.7b 1.7c 1.7d 1.7e
Liability summary for small firms by 1.8a 2.8a 3.8a 4.8a 5.8a 6.8a 7.8a 8.8a 9.8a
asset categories
Liability summary for small firms by 1.9a 2.9a 3.9a 4.9a 5.9a 6.9a 7.9a 8.9a 9.9a
employment size categories
Appendix B: Regression Analysis of Borrowers, 1993-2003
This study has examined changed in financing patterns from 1993 through 2003. This appendix examines the likelihood that borrowers were more likely to hold a line of credit, mortgage, vehicle, equipment or other traditional loan or capital lease in 2003 than in ei-ther 1993 or 1998. The analysis for this appendix regresses the independent variables util-ized in Table 3 on each type of loan or capital lease.
This additional study suggests the following: (1) Borrowers are more likely to hold a line of credit loan in 2003 than either 1993 or 1998; (2) Borrowers are more likely to hold a mortgage loan in 2003 than in 1993 only; (3) Borrower are more likely to hold a vehicle loan in 2003 than 1998 only; (4) Borrowers are less likely to hold an equipment loan in 2003 than 1993 only; (5) Borrowers are less likely to hold a capital lease in 2003 than in either 1993 or 1998; and (6) Borrowers are less likely to hold an other traditional loan in 2003 than in 1993 only. Please refer to Table B.1.
Table B.1 Determinants of Holding a Traditional Loan (1993, 1998 and 2003) Variable Line of Credit Parameter Estimate p-value Mortgage Parameter Estimate p-value Vehicle Parameter Estimate p-value Equipment Parameter Estimate p-value Capital Lease Parameter Estimate p-value Other Parameter Estimate p-value Constant Year - 1993 Year - 1998
Owner filed for bankruptcy in last 3 years Number of employees, log
Age of the firm, log Mining and construction Manufacturing Transportation Wholesale trade Retail trade
Finance, insurance, real estate Rural location
Sole proprietorship Partnership
Corporation, subchapter s Owner age, log
Owner experience, log Owner gender Owner race 0.2016 -0.0821 -0.0610 -0.1783 0.0499 0.0244 0.0112 0.0736 -0.0677 0.2049 0.0433 -0.0703 -0.0051 -0.0564 -0.0347 -0.0120 0.0347 -0.0100 -0.0532 -0.0608 0.0663 0.0001 0.0001 0.0001 0.0001 0.0108 0.5121 0.0004 0.0143 0.0001 0.0046 0.0020 0.7049 0.0007 0.1269 0.4354 0.2691 0.4107 0.0001 0.0024 0.1180 -0.0915 0.0267 -0.0262 0.0283 -0.0010 -0.0221 -0.0142 -0.0597 0.0071 0.0357 0.2214 -0.0983 0.0922 0.1394 0.0468 -0.0086 0.0317 0.0366 0.0210 0.1996 0.0001 0.0168 0.3923 0.0001 0.8993 0.1230 0.4113 0.0100 0.7036 0.0054 0.0001 0.0001 0.0001 0.0001 0.0003 0.7447 0.0017 0.0012 0.2105 0.7506 -0.0232 -0.0530 0.0694 -0.0129 0.0642 0.2442 -0.0161 0.1364 0.0991 -0.0236 -0.0769 -0.0108 -0.0395 -0.0640 0.0089 -0.1130 0.0029 -0.0128 0.0511 0.0001 0.0896 0.0001 0.0621 0.0691 0.0001 0.0001 0.4436 0.0001 0.0001 0.1308 0.0009 0.4288 0.0194 0.0058 0.5715 0.0004 0.8168 0.3526 0.0121 0.4975 0.0758 0.0084 0.0082 0.0724 0.0025 -0.0203 0.0568 0.0060 -0.0656 -0.0754 -0.0652 -0.0661 -0.0039 -0.0118 -0.0289 -0.0973 0.0046 -0.0214 -0.0437 0.0001 0.0001 0.4542 0.7898 0.0001 0.7580 0.1586 0.0011 0.7975 0.0005 0.0001 0.0006 0.0001 0.7784 0.5374 0.0263 0.0002 0.6538 0.0588 0.0094 0.2409 0.0323 0.0548 -0.0040 0.0618 -0.0228 -0.1252 -0.0039 -0.0134 -0.0515 -0.0975 -0.0737 0.0397 -0.0419 -0.0314 -0.0216 -0.0246 -0.0039 -0.0141 -0.0158 0.0054 0.0023 0.0001 0.8886 0.0001 0.0025 0.0001 0.8094 0.5378 0.0034 0.0001 0.0001 0.0002 0.0014 0.0807 0.0767 0.3219 0.6826 0.1837 0.3159 0.6063 0.0368 0.0074 0.1027 0.0184 -0.0336 -0.0343 0.0347 0.0334 0.0418 0.0571 -0.0056 -0.0445 0.0196 -0.0370 -0.0067 -0.0960 0.0028 0.0072 0.0503 0.0001 0.0010 0.5079 0.0007 0.0016 0.0001 0.0160 0.0437 0.1470 0.0241 0.0001 0.7675 0.0001 0.1560 0.0508 0.6044 0.0002 0.7809 0.5219 0.0025 Adjusted R-squared Number of observations 0.0523 7,637 0.0610 7,637 0.0501 7,637 0.0482 7,637 0.0514 7,637 0.0220 7,637