Copyright © IEEE.
Citation for the published paper:
This material is posted here with permission of the IEEE. Such permission of the IEEE does
not in any way imply IEEE endorsement of any of BTH's products or services Internal or
personal use of this material is permitted. However, permission to reprint/republish this
material for advertising or promotional purposes or for creating new collective works for
resale or redistribution must be obtained from the IEEE by sending a blank email message to
pubs-permissions@ieee.org.
By choosing to view this document, you agree to all provisions of the copyright laws
protecting it.
2012
Using Bayes Network for Prediction of Type-2 Diabetes
Yang Guo, Guohua Bai, Yan Hu
7th International Conference for Internet Technology and Secured Transactions (ICITST)
Using Bayes Network for Prediction
of Type-2 Diabetes
Yang Guo School of computing Blekinge Institute of Technology
Karlskrona, Sweden xyg@bth.se
Guohua Bai School of computing Blekinge Institute of Technology
Karlskrona, Sweden gba@bth.se
Yan Hu School of computing Blekinge Institute of Technology
Karlskrona, Sweden yhx@bth.se
Abstract—Diabetes mellitus is a chronic disease and a major
public health challenge worldwide. Using data mining methods to aid people to predict diabetes has become a popular topic. In this paper, Bayes Network was proposed to predict patients with developing Type-2 diabetes. The dataset used is the Pima Indians Diabetes Data Set, which collects the information of patients with and without developing Type-2 diabetes. Weka software was used throughout this study. Accurate results have been obtained which proves using the proposed Bayes network to predict Type-2 diabetes is effective.
Keywords
—
Bayes Network; Prediction; Type-2 DiabetesI. INTRODUCTION
Healthcare information systems tend to capture data in databases for research and analysis in order to assist in making medical decisions. As a result, medical information systems in hospitals and medical institutions become larger and larger and the process of extracting useful information becomes more difficult. Traditional manual data analysis has become inefficient and methods for efficient computer based analysis are very needed. To this aim, many approaches to computerized data analysis have been considered and examined. Data mining represents a significant advance in the type of analytical tools. It has been proven that the benefits of introducing data mining into medical analysis are to increase diagnostic accuracy, to reduce costs and to save human resources [1].
Diabetes mellitus has become a major global public health problem in recent time. According to the International Diabetes Federation, there are currently 246 million diabetic people worldwide, and this number is expected to rise to 380 million by 2025[2]. Diabetes is a chronic disease in which body does not produce insulin or use it properly. This increase the risks of developing, kidney disease, blindness, nerve damage, blood vessel damage and contribute to heart disease [3]. There are two types of diabetes: one is type-1 diabetes-also called insulin dependent, which is usually diagnosed in children and juvenile; another is type-2 diabetes-which is often diagnosed in middle aged to elderly people. Patients with type-2 diabetes do not require insulin cure to remain alive, although up to 20% are treated with insulin to control blood glucose levels. It has been shown that 80% of type-2 diabetes complications can be prevented or delayed by early identification of people at risk [4]. Thus, it is important to develop medical diagnostic decision support systems that can
aid middle aged to elderly people in the self-diagnostic process at home.
The data set used in this paper is excerpted from the UCI Machine Learning Repository [5]. The original owner of this dataset is the National Institute of Diabetes and Digestive and Kidney Diseases. Several constraints were placed on the selection of this dataset from larger database, and all patients are females at least 21 years old of Pima Indian heritage.
II. RELATED WORK
Many researches have been conducted in the field of Prediction of Type-2 Diabetes. In [6] authors have constructed an artificial neural network model for diagnosis of diabetes, they used certain combination of preprocessing techniques to handle the missing values and compared the results of accuracy of the model for each technique, however the method of handling missing values presented in this paper wasn’t employed in that study. Authors in [7] have constructed association rules for classification of type -2 diabetic patients. They generated 10 association rules to identify whether the patient goes on to develop diabetes or not. Several of machine learning algorithms have been proposed in the context and have been successfully used in some parts. Bayesian networks are powerful tools for knowledge representation and inference under uncertainty, using Bayes Network as classifiers has been shown effective in some domain [8]. In this study, we will use Naïve Bayes Network to build a decision make system for middle aged to elderly people to do self-prediction of type-2 diabetes at home.
III.DATA PRE-PROCESSING
Most of the data sets used in data mining were not necessarily gathered with a specific goal in mind. Some of them may contain errors, outliers or missing values. In order to use those data sets in the data mining process, the data needs to undergo preprocessing, using data cleaning, discretization and data transformation [9]. It has been estimated that data preparation alone accounts for 60% of all the time and effort expanded in the entire data mining process [10].
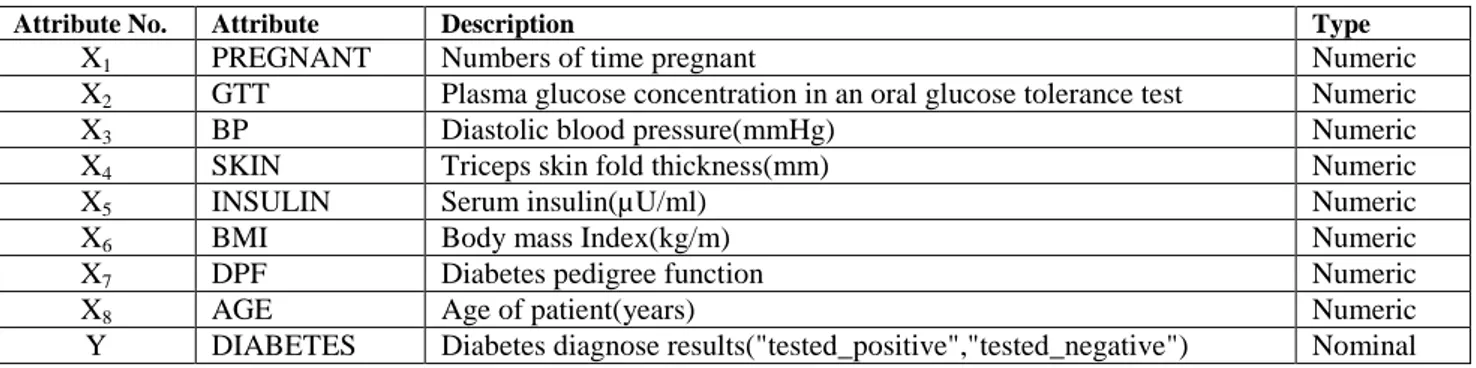
The dataset used in this study is "The Pima Indians Diabetes Dataset". There are 768 instances in this dataset, and all instances have 8 input attributes (from X1 to X8) and 1 output attribute(Y). TABLE I shows the attributes of this dataset.
TABLEI THE ATTRIBUTES OF PIMADATASET
Attribute No. Attribute Description Type
X1 PREGNANT Numbers of time pregnant Numeric
X2 GTT Plasma glucose concentration in an oral glucose tolerance test Numeric
X3 BP Diastolic blood pressure(mmHg) Numeric
X4 SKIN Triceps skin fold thickness(mm) Numeric
X5 INSULIN Serum insulin(µU/ml) Numeric
X6 BMI Body mass Index(kg/m) Numeric
X7 DPF Diabetes pedigree function Numeric
X8 AGE Age of patient(years) Numeric
Y DIABETES Diabetes diagnose results("tested_positive","tested_negative") Nominal
A. Data Normalization
First, we do brief statistical analysis of the dataset. TABLE II showed the Mean and Standard Deviation of each attribute. As can be seen from TABLE II, value range between the attributes is high.
TABLEII BEFORE NORMALIZATION
Attribute Number Mean Standard Deviation X1 3.8 3.4 X2 120.9 32.0 X3 69.1 19.4 X4 20.5 16.0 X5 79.8 115.2 X6 32.0 7.9 X7 0.5 0.3 X8 33.2 11.8
In this paper, we use the Min-Max normalization model to transform the attribute’s values to a new range, 0 to 1. The formula used to normalize attribute X is as follows:
Based on formula (1), normalization process is performed
on the data to overcome this problem and to get a better result, shown in TABLE III.
TABLEIII AFTER NORMALIZATION
Attribute Number Mean Standard Deviation X1 0.380 0.340 X2 0.120 0.032 X3 0.691 0.194 X4 0.205 0.160 X5 0.080 0.115 X6 0.320 0.079 X7 0.500 0.300 X8 0.332 0.118
B. Numerical data discretization
All of these attributes are numeric, in order to present the standard conditional probability tables of Bayes belief networks, discrete attributes is needed. First, make each attribute binary according to high values and low values, and then fit a numerical probability distribution for each node.
Weka software is a collection of machine learning algorithms for data mining tasks. It contains tools for data pre-processing, classification, regression, clustering, association rules, and visualization [11]. Frist, we use Weka’s ‘weka.filters.Discretize’ method to transform the attributes to binary variables. But the result is strange: For most attributes, one side of the attribute was a small percentage(less than 10%) of the samples; this is not useful because over 33% of the samples are positive. The reason is that Weka filter uses information gain, which often favors highly pure small splits.
As an alternative, in order to find the median value of each attribute and divide each attribute up 50/50(or as close as we could), The division of the values into several bins is a very common method for discretization, but usually more than 2 is used. After transformation, OVERWEIGHT, BMI and SKIN counts more closely, this is the point we can discard SKIN and BMI in this model.
IV.METHODOLOGY
A. Naïve Byes Basic Principle
Naïve Bayes classifier [12, 13] is a well-known type of classifiers, i.e., of programs that assign a class from a predefined set to an object or case under consideration based on the values of descriptive attributes. They do so using a probabilistic approach, i.e., they try to compute conditional class probabilities and then predict the most probable class. The basic principle of Naïve Byes is described as follows:
From a training set of patient data, marginal probabilities of symptoms P(si) and diseases P(dj), and conditional probabilities of symptoms on all diseases P(si|dj) are calculated by counting frequencies in the data. Given a set of symptoms (S≡{si}) for a patient, the posterior probability for each diagnosis for the patient is calculated as,
Since denominator is common in the computation of posterior probabilities for all diagnoses, it is dropped and a diagnostic score is computed for each diagnosis as,
Conditional probability of symptom for is,
Where is the number of patients in the dataset with disease and is the frequency count of patients with both and .
When Bayesian belief network is applied to the classification problem, one of the most effective classifier is the so-called Naive Bayesian classifier. When represented as a Bayes network, it has the simple structure proposed in Fig. 1. This classifier learns from observed data the conditional probability of each variable , given the class label S. Classification is then done by applying Bayes rule to compute the probability P(S | ,. . , ,) and then predicting the class with the highest posterior probability. This computation is feasible by making the strong assumption that the variables are conditionally independent given the value of the class S.
Fig. 1 Naive Bayes Classifier
B. Bayes Network Construction
Based on investigation of the knowledge of diabetes, we can create the Bayes network structure.
First, it is certain that diabetes can be caused by PREGNANT (number of times pregnant), AGE, and DPF (diabetes pedigree function) . An interesting part of the dataset is that it has two measures related to being overweight: SKIN (triceps skin fold thickness) and BMI (body mass index). These measurements don't cause overweight, instead, being overweight causes these measurements to be high. So we can assume that "overweight" a hidden variable in the network.
After further examination, skin fold thickness looked like very poor evidence for diabetes, so I used body mass index as the value of overweight. The GTT (plasma glucose concentration) and the INSULIN (serum insulin) measurements are both tests for diabetes, which means diabetes causing these.
For BP (blood pressure), there is some debate about whether diabetes is a cause of blood pressure. From looking up literature, no one mentioned blood pressure causing diabetes, so the causal link from diabetes to BP was drawn. However, all sorts of things cause blood pressure, including pregnancy, age, and overweight. To make the network presentable and just to illustrate a point or two, a link from overweight to blood pressure was drawn. Probably a couple others should be added.
Based on the analysis above, the Bayes network is built in Fig.2:
Fig. 2 Bayes Network
V. EXPERIMENTATION RESULTS AND ANALYSIS
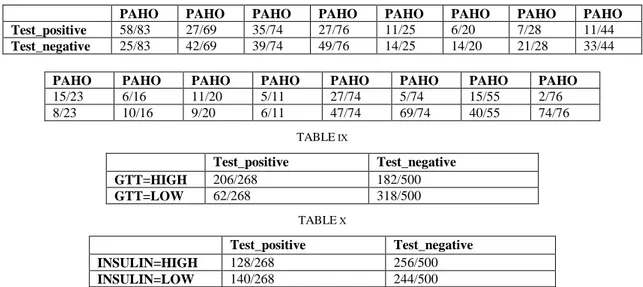
Based on the bayes network in Fig.2, we use weka to simulate the dataset and fill in the conditional probability tables. However, with only 768 samples, one should expect some inaccuracy especially for the diabetes table, which has 32 entries. TABLE IV - TABLE X showed all the Conditional Probability Tables and values:
TABLE IV PREGNANT=HIGH 419/768 PREGNANT=LOW 349/768 TABLE V AGE=HIGH 372/768 AGE=LOW 396/768 TABLE VI DPF=HIGH 384/768 DPF=LOW 384/768 TABLE VII OVERWEIGHT=HIGH 382/768 OVERWEIGHT=LOW 386/768
TABLE VIII
PAHO PAHO PAHO PAHO PAHO PAHO PAHO PAHO Test_positive 58/83 27/69 35/74 27/76 11/25 6/20 7/28 11/44
Test_negative 25/83 42/69 39/74 49/76 14/25 14/20 21/28 33/44
PAHO PAHO PAHO PAHO PAHO PAHO PAHO PAHO
15/23 6/16 11/20 5/11 27/74 5/74 15/55 2/76 8/23 10/16 9/20 6/11 47/74 69/74 40/55 74/76 TABLE IX Test_positive Test_negative GTT=HIGH 206/268 182/500 GTT=LOW 62/268 318/500 TABLE X Test_positive Test_negative INSULIN=HIGH 128/268 256/500 INSULIN=LOW 140/268 244/500
In this paper, leave-one-out method was used to evaluate the proposed naïve bayes network. It should be noted that some bias has been added because the samples was used to make some of my decisions about how to transform the samples and how to structure the network. But this should give some idea whether Bayes network might be useful for this domain.
After gathering all the probabilities from all the samples, we implement leave-one-out by looping over the sample again. For each sample, first the sample is subtracted from the counts, then the network is used to classify the sample, and finally the sample is added back into the counts.
By using leave-one-out evaluation, the accuracy of the proposed Bayes network and Weka’s naïve Bayes network are compared. TABLE XI showed the results comparing proposed Bayes network to naive Bayes:
TABLE XI ACCURACY OF THE MODEL
Method Accuracy
Porposed Byes Network 555/768=72.3%
Naïve Bayes Network 549/768=71.5%
From TABLE XI, the result of proposed Bayes network is more accurate than naïve Bayes network. The proposed Bayes belief network model is promising for this domain.
VI.CONCLUSION AND DISCUSSION
A. Conclusion
The discovery of knowledge from medical databases is important in order to make effective medical diagnosis. The aim of data mining is to extract knowledge from information stored in database and generate clear and understandable description of patterns. This study aimed at the discovery of a decision tree model for the diagnosis of type 2 diabetes. The dataset used was the Pima Indian diabetes dataset. Pre-processing was used to improve the quality of data. The techniques of pre-processing applied were attributes identification and selection, data normalization, and numerical
discretization. Next, classifier was applied to the modified dataset to construct the Naïve Bayes model. Finally weka was used to do simulation, and the accuracy of the resulting model was 72.3%.
B. Discussion
There are some limitations of this study. Firstly, considering the Pima Indian diabetes dataset, there might be other risk factors that the data collections did not consider. According to [12], other important factors include gestational diabetes, family history, metabolic syndrome, smoking, inactive lifestyles, certain dietary patterns etc. The proper prediction model would need more data gathering to make it more accurate. This can be achieved by collecting diabetes datasets from multiple sources, generating a model from each dataset. Secondly, in this study we only use Bayes network to predict diabetes. Considering of the uncertain factors of some diabetes attributes, in the future work, fuzzy set method will be introduced to improve Bayes Network to do prediction. Also, in order to find a best prediction model, other machine learning methods such as Neural Network will be tested to compare the predicting results.
REFERENCES
[1] Marjan Khajehei, Faried Etemady, "Data Mining and Medical
Research Studies," cimsim, pp.119-122, 2010 Second International Conference on Computational Intelligence, Modelling and Simulation, 2010
[2] International Diabetes Federation, Diabetes Atlas, 3rd ed. Brussels,
Belgium: International Diabetes Federation, 2007
[3] R. Bellazzi, “Telemedicine and diabetes management: Current
challenges and future research directions,” J. Diabetes Sci. Technol., vol. 2, no. 1, pp. 98–104, 2008
[4] J.C.Pickup, G. Williams,(Eds), Textbook of diabetes, Blackwell
Science, Oxford
[5] C L Blake, C J Merz. UCI repository of machine learning databases
University of California, Irvine, Department of Information and Computer Sciences. 1998
[6] Al Jarullah, A.A, Decision Tree Discovery for the Diagnosis of Type II
Diabetes. International Conference on Innovations in Information Technology (itt), 2011.
[7] Patil, B.M.; Joshi, R.C.; Toshniwal, D.; , "Association Rule for Classification of Type-2 Diabetic Patients," Machine Learning and Computing (ICMLC), 2010 Second International Conference on , vol., no., pp.330-334, 9-11 Feb. 2010
[8] Friedman N, Linial M, Nachman I, Pe'er D (2000) Using Bayesian
networks to analyze expression data. Journal of computational biology : a journal of computational molecular cell biology 7: 601-620.
[9] Larose, D. T. (2006) Data Mining Methods and Models, Hoboken:
John Wiley & Sons, Inc.
[10] Pyle, D. (1999) Data Preparation for Data Mining, San Francisco:
Morgan Kaufmann
[11] G. Holmes, A. Donkin, and I.H. Witten. Weka: A machine learning
workbench. In Proc Second Australia and New Zealand Conference on Intelligent Information Systems, Brisbane, Australia, 1994.
[12] P. Langley, W. Iba, and K. Thompson. An Analysis of Bayesian
Classifiers. Proc. 10th Nat. Con/. on Artificial Iritelliyence (AAAI’92, San Jose, CA, USA), 223-228. AAAI Press and MIT Press, Menlo Park and Cambridge, CA, USA 1992
[13] P. Langley and S. Sage. Iiiductiori of Selective Bayesian Classifiers. Proc. 10th Corif. u7r Wricertozrrty zrr Arlsjiciul Irrlelliyence (UAI’94, Seattle, WA, USA), 399-406. Morgan Kaufmarl, Sa11 Mateo, CA, USA 1994