PEDIATRIC ORIGINAL ARTICLE
Tackling childhood overweight: treating parents
exclusively is effective
E Jansen, S Mulkens and A Jansen
Department of Clinical Psychological Science, Faculty of Psychology and Neuroscience, Maastricht University, Maastricht,
The Netherlands
Objective: In general, treatment of childhood obesity focuses on treating the obese children. The results of child-directed treatments are disappointing in the long run. In the current study, it is tested whether a treatment aimed solely at obese children’s parents results in positive effects on the children’s weight status. In addition, potential predictors of treatment success are identified.
Methods:The parents of 98 overweight or obese children (aged 7–13 years) were randomly assigned to either the cognitive-behavioural group treatment (eight sessions) or the waiting-list control group.
Results:With respect to child body mass index (BMI) percentile, the parents’ treatment was successful in reducing overweight from pretreatment to posttreatment: BMI percentile decreased significantly by 2.4% in the treatment group, whereas there was no change in the waiting-list control group. There was no significant relapse at follow-up (3 months). Child BMI percentile did not decrease in the waiting-list control group. In addition, significant main effects of time were found for both groups with respect to eating psychopathology (decrease), self-esteem (increase) and negative thoughts (decrease). Finally, parental BMI decreased significantly only in the treatment group. Four predictors were identified with respect to treatment success, namely, lower socioeconomic status, younger age of the child, higher parental attendance and lower BMI percentile of the child before treatment.
Conclusions:The parents’ treatment had significant effects on child and parent BMI. Long-term endurance of these positive effects needs to be studied. Striking are the positive effects of time in the waiting-list control group for some psychological outcome measures. Obviously, waiting for treatment already affects psychological processes (but not behaviour) in the children. International Journal of Obesity(2011)35,501–509; doi:10.1038/ijo.2011.16; published online 1 March 2011
Keywords:childhood obesity; treatment; parents
Introduction
Childhood obesity and overweight are sizeable health threats. Among children, the prevalence of weight problems has increased to exceptional proportions.1 In the United States, about 17% of all children and adolescents are overweight, whereas an additional 16.5% are at the risk of becoming overweight.2 Currently, one out of seven Dutch children is overweight3 and 3% of the Dutch children are obese. These numbers are alarming in light of the grave consequences of obesity. As childhood overweight generally tracks into adulthood, and treatment for adults is hardly
effective on the long run, it is of major significance to challenge overweight early in life.4–6
At present, the most effective treatment is behaviour therapy, aimed at changing the eating and exercise patterns of the child, which also involves the child’s parents.7 In a meta-analytic review by Wilfley et al.,8 14 randomized controlled trials were reviewed. It was concluded that interventions aimed at changing eating habits and exercise patterns turn out to be efficacious in the short term. Effect sizes of these interventions were on an average 0.75 at the end of treatment. In addition, there is some evidence that these effects endure in the long term; the mean effect size at follow-up (mean¼15 months) was 0.60.8 Likewise, from a recent meta-analysis by Oude Luttikhuis et al.,9 it was concluded that combined behavioural–lifestyle interven-tions can result in significant and clinically relevant over-weight reduction in children. Although these findings show positive effects of weight-loss interventions in children,
Received 17 May 2010; revised 30 December 2010; accepted 16 January 2011; published online 1 March 2011
Correspondence: Dr E Jansen, Department of Clinical Psychological Science, Faculty of Psychology and Neuroscience, Maastricht University, P.O. Box 616, 6200 MD Maastricht, The Netherlands.
E-mail: [email protected]
there is still room for improvement. In the current study, the role of parents in the treatment of childhood obesity is emphasized. Parental behaviours are believed to play an important role in the development of children’s weight status (see, for example, ref. 10). They have an important role in stimulating healthy eating behaviours in their children. Parental modelling has a consistent influence on the child’s eating behaviour.11 Children, for example, imitate their parents in both food preferences and food avoidances.12 In addition, parents are responsible for purchasing foods and preparing meals. Furthermore, they can influence their children’s eating behaviour by both parenting style and specific feeding practices, for example, the use of restriction.
In the majority of weight-loss interventions parents are involved, although only indirectly (for example, attending education meetings about healthy food). Mostly, they are less involved than their children. In a treatment study, Mulkens et al.13 found evidence that the attendance of parents at the parental meetings (in which parents were informed about their children’s progress and taught how to support their children, how to cook healthy and how to promote exercise) predicted weight loss in children. Golan and Crow14 also emphasize that parents are key players in treating childhood overweight. They found that targeting parents exclusively by means of support and educational group sessions, resulted in greater weight loss (both in the short and the long term) than targeting children exclu-sively.15In addition, a parent-only treatment would also be favourable with respect to cost efficiency.16 There is only limited support for the efficacy of interventions targeting parents exclusively. Recent support was provided by a study by Westet al.17They found that a 12-week intervention for parents of 4- to 11-year-old children significantly reduced child body mass index (BMI) and weight-related behavioural problem. The intervention included nutrition strategies, physical-activity strategies and positive-parenting strategies. Although the outcomes of parent-focused treatments are positive so far, the evidence is not conclusive.
The aim of the current study is to investigate whether a treatment that aims at parents exclusively (by targeting eating and exercise behaviours, and supporting self-esteem of the child in a cognitive-behavioural manner) would be successful in reducing their children’s overweight. Such a treatment might lead to better results than treatments focusing on children, as parents play an important role in their children’s eating and exercising behaviours, and in promoting their self-esteem.
It is hypothesized that treating parents only will have a favourable effect on the child’s BMI in comparison with a waiting-list control group. In addition, it is hypothesized that the parents treatment will improve healthy eating behaviours, decrease eating psychopathology, increase the frequency of exercise, decrease negative thoughts and increase self-esteem in the children (as opposed to the waiting-list control group). Finally, the treatment is expected
to result in healthier BMIs of the parents and siblings as well. A second goal of the current study is to identify predictors of treatment success.
In a recent study by Moenset al.,18it was found that age of the child, baseline BMI and self-worth were significant predictors of treatment success 8 years after follow up. In the current study, it was hypothesized that a younger age of the child,19the absence of parental overweight,15,20higher BMI percentile of the child before treatment,19 higher socioeconomic status (SES),21higher motivation and greater parental attendance would positively influence treatment outcome.
Method
ParticipantsParticipants were the parents of 98 overweight or obese children (aged 7–13 years). They signed up for a training to help their child to attain a healthy weight. The mean age of their children was 9.72 years (s.d.¼1.6). Parents were recruited by different means: advertisements in local news-papers, posters in doctor’s practices and pharmacies, infor-mation leaflets at primary schools and finally, referral by general practitioners. Parents participated in the treatment voluntarily. To be included in the study, their children’s percentage of overweight had to be at least 130%.22 The children’s mean BMI percentile was 96.48 (s.d.¼3.13) (Children’s BMI-for-Age Calculator23).
From 63 families, both parents participated in the study. In addition, 35 single parent families took part in the study (24 mothers and 11 fathers). In total, 87 mothers (mean age¼40.31 years, s.d.¼5.16, range 29–50) and 74 fathers (mean age¼43.18 years, s.d.¼5.62, range 27–64) partici-pated. Of the mothers, 64.4% were overweight (mean BMI of all mothers¼27.99, s.d.¼5.83) and 83.3% of all fathers were overweight (mean BMI of all fathers¼29.74, s.d.¼5.41).
Design
Parents were randomly assigned to either the treatment group or the waiting-list control group. The treatment group immediately started the training after pretesting, whereas families in the waiting-list control group waited six months first. After the waiting period of six months, they were also offered the parent training. As only 9 of the 48 families in the waiting-list control group eventually decided to participate in the treatment after the waiting period, it was decided to include these 9 families in the treatment group, and to disregard their data from the waiting period. These nine families did not differ from the original treatment group or the control group. There were three main reasons for parents to withdraw from treatment: no more need for treatment (these parents reported lifestyle improvement), no time for treatment or intending to engage in another treatment program. In the treatment group, measurements were 502
scheduled before the start of treatment, after completing the treatment and three months posttreatment. In the waiting-list control group, the measurements were scheduled at the same time points as the treatment group.
The measurements took place at home. A psychologist guided the family through the different questionnaires, and assessed binge-eating and eating behaviours by means of an interview. If the psychologist had the impression that the child or other members of the family were emotionally affected by the questions, they were emotionally counselled. In practice, this was never necessary.
Treatment
The training entitled ‘Finger in the pie’ was a cognitive-behavioural treatment and was carried out according to a protocol, written by the first and the second authors (the second author being a cognitive-behavioural therapist). Treatment was provided in groups (parents of five to eight overweight children) and carried out by trained cognitive-behavioural therapists. Participants were offered eight 2-h (evening) sessions spread over 10 weeks. Treatment took place in one of three locations (a community health centre in Sittard, a university building in Maastricht and a community centre in Heerlen). The therapists were counter-balanced over the three locations. Each session addressed a different theme associated with childhood overweight (see also Table 1). The purpose was not purely to present information, but to teach parents to think of alternatives and possible solutions themselves. This way, future coping abilities were addressed. The following themes were included: creating realistic expectations concerning the development of their children’s weight status, modifying eating and exercising habits, knowledge on how parents can influence the behaviour of their children (for example, by modelling and by the use of control and rewards), informa-tion on the development of overweight, handling feelings of guilt, and recognizing and handling a child with low self-esteem. So, instead of purely focusing on nutrition and physical activity, a substantial part of the treatment was devoted to enhancing parenting tactics (for example, teach-ing parents to ignore undesirable behaviours and to reward desirable behaviours). This aspect of the treatment combined with extensively discussing parental control makes the current intervention distinguishing.
Of the two-hour sessions, the first hour was interactive (for example, discussions on provocative propositions were held). One of the main goals of this first hour was to identify wrong thought patterns and challenging these patterns as is done in cognitive therapy. The second hour of each session was more informative and practical by nature.
Measures
Weight parameters. Weight (kilograms) and height (metres) were measured and BMI percentile (Children’s BMI-for-Age Calculator23) was calculated for each child of the participating
parents, thus including the target children and their siblings. With respect to the parents, BMI was calculated.
Socioeconomic status. Before treatment, parents filled out a questionnaire with demographic items. SES was derived from Table 1 Overview of the parent treatment sessions
Session number and theme
Contents
S1 The part that Parents’ expectations and motivations
parents play Thought exploration: ‘parents are the ones to blame’ Rationale of the parent treatment
Training overview
Clarification of reward system Winding up/evaluation S2 Eating behaviour Experiences
Thought exploration: ‘breakfast is unnecessary’ Education: regularity
Thought exploration: ‘my child does not eat too much’
Education: amount and type of food Practical tips
Homework
Winding up/evaluation S3 Physical exercise Experiences
Thought exploration: ‘television makes you fat’ Education: physical exercise
Practical tips Homework
Winding up/evaluation S4 Parental control Experiences
Thought exploration: ‘parents should be strict’ Education: parental control
Practical tips Homework
Winding up/evaluation S5 Be in good spirit Experiences
Thought exploration: ‘thoughts and feelings do not matter!’
Education: self-esteem and bullying Practical tips
Homework
Winding up/evaluation S6 Food and party Experiences
Thought exploration: ‘on holidays my child can eat anything’
Education: parties and holidays Practical tips
Homework
Winding up/evaluation S7 Relapse Experiences
Thought exploration: ‘we will probably relapse after the training’
Education: relapse prevention + repetition Practical tips
Homework
Winding up/evaluation S8 Responsibility Experiences
Thought exploration: ‘my child can do it alone now!’ Education: responsibility + repetition
Practical tips Homework Evaluation training
family income. Family income was measured on a 5-point rating scale (1 representingo12 000 euros and 5 represent-ing438 000 euros). Scores ranged from 1 to 5, with a mean score of 3.90.
Eating psychopathology: Child Eating Disorder Examination Questionnaire. The Child Eating Disorder Examination Questionnaire (ChEDE-Q)24is based on the Eating Disorder Examination Questionnaire (EDE-Q)25for adults. It is a self-report questionnaire measuring the existence and frequency of eating-disorder psychopathology. The ChEDE-Q consists of four subscales: restraint, eating concern, shape concern and weight concern. Furthermore, the ChEDE-Q measures overeating (objective bulimic episodes, subjective bulimic episodes and objective overeating episodes) and methods of weight control (self-induced vomiting, laxative misuse, diuretic misuse and intense exercising). The ChEDE-Q consists of 30 items that are scored on a 7-point (0–6) rating scale. Higher scores indicate greater seriousness or frequency of the given feature. In the current study, Cronbach’saof the Q subscales ranged from 0.48 to 0.82. As the ChEDE-Q is not very reliable regarding the assessment of binge eating,26binge eating was assessed by means of an interview, as it is done in the ChEDE. The ChEDE-Q was filled out by the overweight child in the presence of a parent and a trained interviewer.
Eating behaviours. With respect to eating behaviours, two types of information were collected by interview before and after treatment, and at 3 month follow-up. First, the regularity of the children’s eating pattern was examined (for example: How many eating moments are there on a typical weekend day?). Scores for regularity range from 0 to 7, a higher score indicating a more regular eating pattern. Second, it was registered how many unhealthy food items (that is, ‘red’ food items according to the traffic light system, provided by The Netherlands Nutrition Centre, The Hague27) the children consumed per day. Therefore, the children were asked to recall every food and drink item they consumed the day before the measurement. In case that day was not representative for an average day, the children were asked to recall their consumption of an earlier day. One of their parents was present to add or correct information if necessary. The Netherlands Nutrition Centre composed a list of frequently consumed food items, and categorized them into three categories: green (healthiest food items, to be used preferably), orange (less healthy options, advised to consume moderately) and red (high in fat and/or sugar; to be eaten by exception).
Physical activity. Current physical activity was assessed by means of the Baecke Questionnaire,28which was filled out by the overweight child (in presence of a parent and the interviewer). This questionnaire consists of three compo-nents: work activity, sports activity and leisure activity. An index score for the three components is calculated, ranging
from 1 to 5, with higher index scores reflecting higher levels of activity. The Baecke Questionnaire was adapted for use with children by replacing ‘work activity’ with ‘school activity’ (including similar questions). The validity and test–retest reliability of the original Baecke Questionnaire are good.28
Self-esteem. Perceived competence was measured with the translated version of the Self-Perception Profile for Children:29 Competentie Belevings Schaal voor Kinderen (CBSK).30The overweight child filled out the questionnaire (in presence of a parent and the interviewer). The CBSK comprises six subscales (‘scholastic competence’, ‘social acceptance’, ‘athletic competence’, ‘physical appearance’, ‘behavioural conduct’ and ‘global self-worth’) each consist-ing of six items, formulated as opposite pairs. Each answer is scored between 1 (most competent) and 4 (least competent). For the current study we were particularly interested in the subscales ‘physical appearance’ and ‘global self-worth’. The CBSK has been validated for Dutch children.31
Negative thoughts. Negative thinking concerning weight and body issues was measured with the self-composed Heavy Thoughts Questionnaire, which was completed by the overweight child (in presence of a parent and the inter-viewer). This questionnaire maps the frequency of negative weight-related thoughts in overweight children. The ques-tionnaire comprises 20 items (for example ‘I am worthless because I am overweight’). Scores range from 1 (‘I never have this thought’) to 5 (‘I always have this thought’). In the current study, Crohnbach’sa¼0.88.
Knowledge test. By means of a knowledge test, a manipula-tion check was carried out to examine whether parents learned from the training. Before and after treatment, they completed a test consisting of 29 multiple-choice items (for example: ‘In what category (green, orange or red) does this food item belong: a boiled egg?’ or ‘How can you motivate your child to engage in physical activity?’), covering the subject matter of the training. For every correct answer 1 point was awarded, resulting in a maximum score of 29 points. In order to preclude a learning effect, two comparable versions of this knowledge test were con-structed. The order in which the tests were administered was balanced: half of the parents started with version A before treatment, the other half started with version B at before treatment.
Motivation. The motivation of the participating parents was assessed by the therapist. The therapists rated the parents’ active participation during the sessions, their performance on homework assignments and their general motivation. A motivation score was calculated by averaging the therapist ratings on these three questions, resulting in a score between 0 and 10. In the current sample, scores ranged from 3.25 to 10. The mean motivation score was 7.12 (s.d.¼1.38).
Statistical analysis
First, one-way analyses of variance on child BMI status, parental BMI (if BMI data from both parents were available, their average BMI was used in the analyses), sibling’s BMI, eating behaviour, physical activity, self esteem and cogni-tions were performed to test for pretreatment group differences. Then, a 2 (time: pretreatment vs post-treatment)"2 (group: treatment vs waiting-list control) analysis of variance on knowledge test scores was carried out as a manipulation check.
In order to analyse the effects of the parent treatment, 3 (Time: pretreatment vs posttreatment vs follow-up) " 2 (group: treatment vs waiting-list control) repeated measures analyses of variance were carried out for all outcome measures (BMI percentile child, BMI parent, BMI percentile siblings, ChEDE-Q subscales, eating behaviour, physical activity, self-esteem and cognitions). The results section is structured according to our hypotheses. For significant interactions, post-hoc analyses were conducted. Finally, to identify predictors of treatment success, a linear regression analysis was carried out. The dependent variable was treatment success (represented by decrease of child BMI percentile from pretreatment to 3 month follow-up). The hypothesized predictors (age, parental BMI before treatment, child BMI percentile before treatment, SES, motivation and parental attendance) were entered as predictors in the regression.
Missing data
The missing values at the follow-up meeting were replaced by the last observation carried forward. The missing in-between values (posttreatment) were replaced by the average of the values before treatment and at 3 month follow-up. In total, 98 families engaged in the study. 59 families started treatment. From these 59 families, 10 families did not finish treatment. (These families attended less than three of the eight sessions.) However, five of these families were willing to continue their participation in the posttreatment and follow-up measurements. In the waiting-list control group, 39 families participated in the first measurement session. Data of 34 of these families was available after three and six months.
Results
Data are provided in Table 2.
One-way analyses of variance showed no pretest group differences with respect to age, BMI values, eating behaviour, physical activity, self-esteem and cognitions.
Knowledge test manipulation check
With respect to the knowledge test, a significant interaction of time " group was found, F(2, 75)¼7.96, Po0.01.
As expected, paired sample t-tests showed that scores of parents in the treatment group on the knowledge test increased from pretreatment to posttreatment, t(1, 51)¼
3.56, Po0.01, whereas scores of parents in the waiting-list control group remained constant,t(1, 24)¼0.99,P¼0.33.
Hypothesis 1
BMI percentile of the overweight children will decrease over time in the treatment group, whereas it will remain constant or increase in the waiting-list control group.
The analyses showed a significant time " group interac-tion with respect to BMI percentile of the overweight children, F(2, 95)¼5.53, Po0.01. Post hoc paired sample
t-tests showed that BMI percentiles of children whose parents engaged in the treatment decreased significantly from pretreatment to posttreatment,t(1, 58)¼3.7,Po0.001, and from pretreatment to 3 month follow-up,t(1, 58)¼3.8,
Po0.001. No significant differences were found between posttreatment and 3-month follow-up. Similar post-hoc
analyses for the waiting-list control group showed no significant differences in child BMI percentile. See also Figure 1.
Hypothesis 2. The parent treatment will decrease eating psychopathology, improve healthy eating behaviours, increase exercise, decrease negative thoughts and increase self-esteem in the overweight children of the trained parents, as opposed to overweight children of parents in the waiting-list control group.
With respect to eating psychopathology, main effects of time were found for all four subscales of the ChEDE-Q: children reported less eating concerns, less weight concerns and less shape concerns over time, regardless of whether their parents received the training or not. In addition, a significant time " group effect was found on the restraint scale scores of the ChEDE-Q, F(2, 90)¼6.74,Po0.01. Tests of within subject contrasts show an interaction, F(1, 90)¼
10.45, Po0.01. Post hoc paired sample t-tests showed that restraint in children whose parents engaged in the treatment increased significantly from pretreatment to posttreatment,
t(1, 54)¼3.3, Po0.01, and decreased significantly from posttreatment to 3 month follow-up, t(1, 55)¼3.9,
Po0.001. No significant differences were found between pretreatment and follow-up. Similarpost-hocanalyses for the waiting-list control group showed no significant differences in restraint.
With respect to healthy eating behaviours (regularity and the consumption of unhealthy food items) and physical activity, no significant effects were found.
Concerning self-esteem, a main effect of time was found on the ‘physical appearance’ scale, F(2, 63)¼5.02,Po0.05.
Post hoc paired sample t-tests in all children showed significant increases in physical appearance self-esteem from pretreatment to posttreatment,t(1, 64)¼3.27,Po0.01, and
from pretreatment to 3 month follow-up, t(1, 64)¼2.68,
Po0.01.
Finally, with respect to negative thoughts, a main effect of time was found, F(2, 71)¼6.26, Po0.01. Post-hoc paired-sample t-tests in all children showed significant decreases of negative thoughts from pretreatment to posttreatment,
t(1, 72)¼2.86,Po0.01, and from pretreatment to 3 month follow-up,t(1, 72)¼2.79,Po0.01.
Hypothesis 3. Parents and siblings in the treatment group show healthier BMIs over time than parents and siblings in the waiting-list control group.
Regarding the BMIs of family members, a significant time"group effect was found in parental BMI, F(2, 96)¼
3.50, Po0.05. Post hoc paired sample t-tests showed that parents in the treatment group showed a decrease in BMI from pretreatment to posttreatment,t(1, 58)¼2.75,Po0.01. No significant differences were found from posttreatment to 3 month up or from pretreatment to 3 month follow-up. Similarpost-hocanalyses for the waiting-list control group showed no significant differences in parent BMI.
With respect to siblings, no significant effects were found.
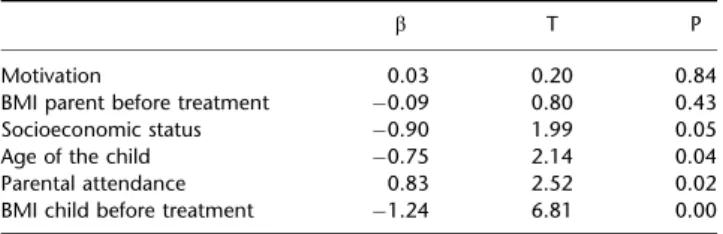
Hypothesis 4. Lower age of the child, lower parental BMI, less severe overweight of the child, higher SES, higher motivation and higher parental attendance are expected to positively influence treatment outcome.
All six potential predictors of treatment success were entered in a linear regression analyses (backward method). After excluding the non-significant variables, four significant predictors of treatment success remained in the final regression model (Table 3). The strongest predictor of treatment success was BMI percentile of the child. However, contrary to what was expected, the lower the child’s pretreatment BMI percentile, the better the treatment Table 2 Means and statistics before and after treatment and at follow-up
Treatment group (N¼59) Waiting-list control group (N¼39) Main effect time
Main effect group
Time "group interaction Pretreatment Posttreatment 3 Month
follow-up
0 months 3 Months 6 Months
M (s.d.) M (s.d.) M (s.d.) M (s.d.) M (s.d.) M (s.d.) F [Z2
p] F [Z2p] F [Z2p]
BMI percentile child 96.8 (2.93) 94.5 (6.52) 94.7 (6.58) 95.9 (3.38) 96.0 (3.64) 95.7 (3.90) 6.58 (0.11)** 0.30 (0.00) 5.53 (0.09)** EDEQ Restraint 0.62 (0.67) 1.09 (1.09) 0.58 (0.69) 0.83 (0.94) 0.71 (0.74) 0.72 (0.74) 4.06 (0.04)* 0.02 (0.00) 6.74 (0.07)** Eating concerns 0.45 (0.41) 0.40 (0.52) 0.27 (0.39) 0.66 (0.82) 0.67 (0.80) 0.52 (0.68) 3.67 (0.04)* 5.79 (0.06)* 0.12 (0.00) Weight concerns 1.67 (0.84) 1.41 (1.07) 1.38 (0.95) 1.46 (1.11) 1.28 (1.20) 1.21 (1.13) 5.81 (0.06)** 0.72 (0.01) 0.09 (0.00) Shape concerns 1.26 (0.96) 1.04 (1.19) 0.97 (0.89) 1.07 (0.97) 1.08 (1.09) 0.92 (1.01) 3.12 (0.03)* 0.13 (0.00) 0.88 (0.01) Eating behaviour Regularity 5.67 (0.94) 5.65 (1.06) 5.65 (0.80) 5.49 (0.95) 5.80 (0.69) 5.21 (0.90) 2.44 (0.04) 0.47 (0.01) 2.45 (0.04) Unhealthy items 6.84 (2.81) 5.77 (2.95) 6.03 (3.22) 7.08 (2.40) 6.76 (2.16) 6.52 (2.53) 2.92 (0.03) 1.70 (0.02) 0.67 (0.01) Physical activity 9.16 (1.25) 9.16 (1.18) 9.16 (1.20) 8.92 (1.28) 8.76 (1.12) 8.68 (1.27) 0.99 (0.01) 2.53 (0.03) 0.97 (0.01) Self esteem Physical appearance 14.87 (4.52) 15.87 (5.04) 15.98 (5.25) 15.16 (4.34) 16.11 (4.69) 15.74 (4.72) 5.02 (0.07)* 0.01 (0.00) 0.38 (0.01) Global self-worth 18.43 (4.14) 18.79 (4.20) 19.02 (4.86) 19.79 (4.02) 20.26 (4.23) 20.16 (4.14) 2.35 (0.04) 1.33 (0.02) 0.25 (0.00) Negative thoughts 43.9 (13.55) 41.8 (14.53) 41.1 (14.66) 44.6 (14.42) 41.8 (14.74) 40.8 (15.99) 6.26 (0.08)** 0.00 (0.00) 0.16 (0.00) BMI parents 28.30 (4.53) 28.01 (4.53) 28.13 (4.58) 29.35 (6.33) 29.43 (6.22) 29.49 (6.24) 1.04 (0.01) 1.38 (0.01) 3.50 (0.04)*
BMI percentile siblings 73.8 (24.30) 71.6 (24.63) 73.1 (24.17) 69.4 (23.40) 68.8 (22.16) 69.1 (22.21) 0.77 (0.01) 0.43 (0.01) 0.29 (0.00) Knowledge test 15.1 (2.50) 17.1 (3.69) 15.3 (1.89) 14.8 (2.02) 3.06 (0.04) 4.02 (0.05)* 7.96 (0.10)**
Leisure activity score 3.18 (0.59) 3.35 (0.51) 3.38 (0.55) 3.24 (0.57) 3.23 (0.56) 3.20 (0.64) 1.98 (0.02) 0.56 (0.01) 3.31 (0.04)* *P-valueo0.05.**P-valueo0.01.
Figure 1 BMI percentile from pretreatment to follow-up.
success. In addition, parental attendance predicted treat-ment success in the hypothesized way (more parental attendance leads to more BMI loss). Also, age of the child predicted treatment success as expected; younger children showed larger BMI percentile decreases. Finally, SES con-tributed to treatment success, however, not in the expected direction: lower income families took more advantages of the treatment than higher income families.
Discussion
In the present study, the effects of a treatment targeting parents of overweight children were examined. To this end, a parental treatment group was compared with a waiting-list control group. With respect to the effects of the parents treatment, it was found that BMI percentile of the over-weight children in the treatment group decreased signifi-cantly compared with children in the waiting-list control group. At 3 month follow-up no significant relapse occurred. Even though the decrease in BMI percentile seems clinically modest, the fact that an eight-session parent treat-mentFwithout treating the kidsFresults in significant weight loss in their overweight children is very promising. In addition, the effect size of BMI change in the overweight children is medium to large (Cohen’s f¼0.31). This is comparable to the mean effect size reported in the meta-analyses of Wilfley et al.8 More specifically, 22% of the children of parents in the treatment group that were overweight pretreatment were no longer overweight post treatment. In addition, 8.7% of the children who were obese before treatment became overweight post treatment.
Besides affecting the child’s weight status, BMI of the participating parents also decreased significantly from pre-treatment to postpre-treatment. The finding that the whole family profits from the intervention is valuable. A third treatment effect was found with respect to the restraint subscale of the ChEDE-Q. Children in the treatment group reported increased levels of restraint after treatment. Clearly, the parents were able to induce a functional restraint in their kids that helped them to decrease weight. In line with earlier findings of Sticeet al.,32the increased restraint did not lead to an increase in eating disorder symptoms like
concerns and increased intake of unhealthy foods. Increased restraint was related to decreased concerns and less unhealthy food intake. Although restraint levels decreased to baseline levels at follow-up, BMI and concerns and unhealthy food intake did not increase. Striking is the finding that main effects of time were found for most psychological measurements. In both treatment and wait-ing-list control groups, concerns about eating, weight and shape decreased, self-esteem improved and negative think-ing diminished. Apparently, waitthink-ing for overweight treat-ment by itself, already seems to affect one’s thinking about the problems. The prospect of dealing with the overweight might lead the children to trivialize their concerns with respect to their overweight or postpone their worries. Perhaps these results can also be explained by repetition of the questions.
Unfortunately, no significant effects of treatment were found with regard to actual (self-reported) eating behaviour or on actual (self-reported) physical activity. A possible explanation for the absence of effects on eating regularity is the possibility of ceiling effects. That is, pretreatment scores were already high: on average almost 6 where the maximum was 7. Another explanation might be the way we measured both, that is, by self-reports. Although actual behaviour might have changed, people might have judged their behaviour as better or healthier but less realistic before treatment and more realistic after treatmentFending up at the same levels.
Inconsistent with the expectations, general physical activity did not increase in the treatment group. In this study, physical activity was self-reported with the Baecke questionnaire. Besides the common difficulties with self-report measurements, a specific feature of the used ques-tionnaire might also have distorted the results. As described earlier, the physical activity score is composed by school activity, sports activity and leisure activity. As school activity and sports activity are pretty stable throughout the year, only leisure activity could be increased. Leisure activity would have to increase substantially in order to significantly affect the general physical activity score. This explanation for the results was testedpost hoc. Indeed, a time " group interaction was found with respect to leisure activity (see also Table 2). However, for future research, it is recommended to include a more objective method of registering physical activity, for example, by using an accelerometer.33
With respect to the knowledge test results, a remark should be made. Even though the test distinguished groups significantly (which means that the ‘manipulation’, that is the treatment, indeed increased knowledge in the treatment group), the posttreatment scores in the treatment group are not very high: on average parents scored 59% of the questions correctly versus 52% pretreatment. On the one hand these data represent a learning effect, on the other hand these numbers illustrate that (also after treatment) parents still have a lot of ground to cover.
Table 3 Regression coefficients of potential predictors of treatment success
b T P
Motivation 0.03 0.20 0.84 BMI parent before treatment #0.09 0.80 0.43 Socioeconomic status #0.90 1.99 0.05 Age of the child #0.75 2.14 0.04 Parental attendance 0.83 2.52 0.02 BMI child before treatment #1.24 6.81 0.00
In general, the effects of parent treatment are very promising. The relatively short intervention led to very useful results. Furthermore, an intervention that focuses on parents exclusively is, compared with the common ‘child-and parent-focused interventions’, cost-reducing, as fewer treatment sessions are required. With respect to the (cost) effectiveness of a parent treatment, we can join the point of view described in the work of Golan and Crow;14if parent sessions alone yield the same effects as a combination of both child and parent sessions, this means that fewer sessions are needed to reach the same goal, thus resulting in a less-expensive treatment.
A second goal of the study was to identify potential predictors of treatment success. No effects were found with respect to motivation and parental BMI. Contrary to our expectations, lower SES was associated with greater treatment success. Other studies have found exactly the opposite: higher SES being associated with greater treatment success.21,34,35 Perhaps, the treatment evaluated in the current study was particularly easily accessible and not pedantic by nature. Further research is necessary to find out from what components in treatment different SES groups profit.
In addition to SES, age of the overweight child was a significant predictor; the younger the child was at the start of treatment, the larger the BMI decrease. It seems obvious that the younger the child, the more influence parents have on the eating and exercise habits of the child. As the child becomes older, parents are no longer their most important role models: peers take over that role.36
Furthermore parental attendance predicted treatment success in the expected direction: the more the sessions were attended, the better the treatment success. Total attendance of the families that completed treatment was high: on average, parents attended 6.49 sessions (s.d.¼1.42). The fact that more attendance leads to greater BMI decrease is a very logical finding. Finally, BMI percentile of the overweight child before treatment was the strongest med-iator of treatment success: the lower the BMI percentile at the start of treatment, the larger the decrease in BMI percentile. On the one hand this is unexpected, as children with higher BMI percentiles at start have more room for improvement. Whereas on the other hand, this finding might implicate that the kind of treatment that was evaluated in the current study (relatively short and not very intense) works best for children that are not morbidly obese yet. Possible, the more severe cases will profit more from a longer enduring and more intensive form of treatment. Future research is needed to determine which families particularly benefit from a treatment that focuses on parents exclusively.
Conflict of interest
The authors declare no conflict of interest.
References
1 Dietz WH, Robinson TN. Overweight children and adolescents. N Engl J Med2005;352: 2100–2109.
2 Ogden CL, Carroll MD, Curtin LR, McDowell MA, Tabak CJ, Flegal KM. Prevalence of overweight and obesity in the United States, 1999–2004.JAMA2006;195: 1549–1555.
3 Hurk K, van den Dommelen Pvan Wilde JA, de Verkerk PH, Buuren S, van Hirasing RA 2006. Prevalentie van overgewicht en obesitas bijjeugdigen 4-15 jaar in de periode 2002–2004. TNO-rapport KvL/JPB/2006.010, Leiden: TNO kwaliteit van leven. 4 Whitaker RC, Wright JA, Pepe MS, Seidel KD, Dietz WH.
Predicting obesity in young adulthood from childhood and parental obesity.N Engl J Med1997;337: 869–873.
5 Clarke WR, Lauer RM. Does childhood obesity track into adulthood?Crit Rev Food Sci Nutr1993;33: 423–430.
6 Serdula MK, Ivery D, Coates RJ, Freedman DS, Williamson DF, Byers T. Do obese children become obese adults? A review of the literature.Prev Med1993;22: 167–177.
7 Epstein LH, Valoski A, Wing RR, McCurley J. Ten-year outcomes of behavioral family-based treatment for childhood obesity. Health Psychol1994;13: 373–383.
8 Wilfley DE, Tibbs TL, Van Buren DJ, Reach KP, Walker MS, Epstein LH. Lifestyle interventions in the treatment of childhood over-weight: a meta-analytic review of randomized controlled trials. Health Psychol2007;26: 521–532.
9 Oude Luttikhuis H, Baur L, Jansen H, Shrewsbury VA, O’Mally C, Stolk RP et al. Interventions for treating obesity in children. Cochrane Database Syst Rev2009; (21), CD001872.
10 Birch LL, Fisher JA. Appetite and eating behavior in children. Pediatr Clin North Am1995;42: 931–953.
11 Brown R, Ogden J. Children’s eating attitudes and behaviour: a study of the modeling and control theories of parental influence.Health Educ Res2004;19: 261–271.
12 Guidetti M, Cavazza N. Structure of the relationship between parents’ and children’s food preferences and avoidances: an explorative study.Appetite2008;50: 83–90.
13 Mulkens S, Jansen E, Jansen A. Prevention of obesity in adulthood: short term effects of behavioural versus cognitive behavioural therapy for seriously overweight children. Poster session presented at the Annual Meeting of the Eating Disorder Research Society, Amsterdam 2004.
14 Golan M, Crow S. Parents are key players in the prevention and treatment of weight-related problems.Nutr Rev2004;62: 39–50. 15 Golan M, Crow S. Targeting parents exclusively in the treatment of childhood obesity: long term results.Obes Res2004;12: 357–361. 16 Golan M, Kaufman V, Shahar DR. Childhood obesity treatment:
targeting parents exclusively v. parents and children.Br J Nutr 2006;95: 1008–1015.
17 West F, Sanders MR, Cleghorn GJ, Davies PSW. Randomised clinical trial of a family-based lifestyle intervention for childhood obesity involving parents as the exclusive agents of change.Behav Res Ther2010;48: 1170–1179.
18 Moens E, Braet C, van Winckel M. An 8-year follow up of treated obese children: Children’s, process and parental predictors of treatment success.Behav Res Ther2010;48: 626–633.
19 Braet C. Patient characteristics as predictors of weight loss after an obesity treatment for children.Obesity2006;14: 148–155. 20 Wrotniak BH, Epstein LH, Paluch RA, Roemmich JN. Parent
weight change as a predictor of child weight change in family-based behavioral obesity treatment. Arch Pediatr Adolesc Med 2004;158: 342–347.
21 Epstein LH, Wing RR. Behavioural treatment of childhood obesity.Psychol Bull1987;101: 331–342.
22 Van Wieringen JC. Bijlage 3: Gewicht-lengtenormen.Tijdschrift voor Sociale Geneeskunde1985;63: 99–100.
23 USDA/ARS Children’s Nutrition Research Center. (n.d.). Children’s BMI-percentile-for-age calculator. Retrieved 28 March 2010, from http://www.kidsnutrition.org/bodycomp/bmiz2.html.
24 Decaluwe´ V. Child Eating Disorder Examination-Questionnaire. Dutch translation and adaptation of the Eating Disorder Examination-Questionnaire, authored by CG Fairburn and SJ Beglin, unpublished manuscript 1999.
25 Fairburn CG, Beglin SJ. Assessment of eating disorders: interview or self-report questionnaire?Int J Eat Disord1994;16: 363–370. 26 Decaluwe´ V, Braet C. Assessment of eating disorder
psycho-pathology in obese children and adolescents: interview versus self-report questionnaire.Behav Res Ther2004;42: 799–811. 27 The Netherlands Nutrition Centre, The Hague (n.d.). Keuzetabel
producten. Retrieved February 24, 2008 from http://www. voedingscentrum.nl/EtenEnGezondheid/Gezond+eten/Keuzetabel/. 28 Baecke JA, Burema J, Frijters JE. A short questionnaire for the measurement of habitual physical activity in epidemiological studies.Am J Clin Nutr1982;36: 936–942.
29 Harter S. Manual for the Self-perception Profile for Children. University of Denver: Denver, CO, 1985.
30 Veerman JW.De Competentiebelevingsschaal Voor Kinderen, CBSK. Een Experimentele Handleiding [Competence perception scale for children. Manual]. Paedologisch Instituut: Duivendrecht, 1989.
31 Van Dongen-Melman JEWM, Koot HM, Verhulst FC. Cross cultural validation of Harter’s self-perception profile for children in a Dutch sample.Educ Psychol Meas1993;53: 739–753. 32 Stice E, Martinez EE, Presnell K, Groesz LM. Relation of successful
dietary restriction to change in bulimic symptoms: a prospective study of adolescent girls.Health Psychol2006;25: 274–281. 33 Bonomi AG, Plasqui G, Goris AHC, Westerterp KR. Improving
assessment of daily energy expenditure by identifying types of physical activity with a single accelerometer.J Appl Physiol2009; 107: 655–661.
34 Langna¨se K, Asbeck I, Mast M, Mu¨ller MJ. Influence of socio-economic status on long-term effect of family-based obesity treatment intervention in prepubertal overweight children. Health Educ2004;104: 336–343.
35 Mu¨ller MJ, Danielzik S, Pust S. School- and family-based interventions to prevent overweight in children. Proc Nutr Soc 2005;64: 249–254.
36 Shroff H, Thompson JK. The tripartite influence model of body image and eating disturbance: a replication with adolescent girls. Body Image2006;3: 17–23.