According to the Standards for Educational and Psychological Testing (American Educational Research Association [AERA], American Psychological Association [APA], & National Council of Measurement in Education [NCME], 1999), validity is the most essential matter to take into account when developing and evaluating tests. Organizations like the International Test Commission (ITC) or the European Federation of Psychologists’ Associations (EFPA) also emphasize the importance of validity, which refers to the degree to which evidence and theory support the interpretations of test scores required by the proposed uses of tests. As Cronbach and Meehl (1955) stated, one does not validate a test, but only a principle for making inferences.
Depending on the kind of interpretations to be made with tests scores, norm-referenced and criterion-referenced interpretations are usually differentiated. The former enables the interpretation of an examinee`s score compared to that of other examinees, whereas
the latter allows users to interpret examinee test performance in relation to well-defi ned domains of content and/or behaviors. Thus, the primary purpose of criterion-referenced interpretations is not to determine the rank ordering of examinees, as is the case with norm-referenced interpretations, but rather to determine the placement of examinees in a set of ordered performance standards (Hambleton, 2001, 2003).
As Hambleton (2003) suggested, perhaps the most diffi cult steps for criterion-referenced interpretations are to set performance standards and to establish cut scores that fi nally allow separating examinees into such standards. According to Cizek and Bunch (2007), standard setting is the appropriate sequence of a prescribed, rational system of rules or procedures resulting in the assignment of cut scores to differentiate between two or more performance standards. This is why the AERA, APA and NCME (1999) stated that the validity of test interpretations sometimes hinges on the cut scores.
In this study, a new IRT-based standard setting method is proposed and applied to eCat-Listening in order to interpret its scores in relation to the Common European Framework of Reference for Languages.
ISSN 0214 - 9915 CODEN PSOTEG Copyright © 2013 Psicothema www.psicothema.com
A new IRT-based standard setting method: Application to eCat-Listening
Pablo Eduardo García, Francisco José Abad, Julio Olea and David Aguado
Universidad Autónoma de Madrid
Abstract
Resumen
Background: Criterion-referenced interpretations of tests are highly necessary, which usually involves the diffi cult task of establishing cut scores. Contrasting with other Item Response Theory (IRT)-based standard setting methods, a non-judgmental approach is proposed in this study, in which Item Characteristic Curve (ICC) transformations lead to the fi nal cut scores. Method: eCat-Listening, a computerized adaptive test for the evaluation of English Listening, was administered to 1,576 participants, and the proposed standard setting method was applied to classify them into the performance standards of the Common European Framework of Reference for Languages (CEFR). Results: The results showed a classifi cation closely related to relevant external measures of the English language domain, according to the CEFR. Conclusions: It is concluded that the proposed method is a practical and valid standard setting alternative for IRT-based tests interpretations.
Keywords: Standard setting, item response theory, computerized adaptive testing, criterion-referenced testing.
Un nuevo método de standard setting basado en la TRI: aplicación a eCat-Listening. Antecedentes: las interpretaciones de los tests referidas a criterio son muy necesarias, lo cual normalmente implica la difícil tarea de establecer puntos de corte. En contraste con otros métodos de standard setting basados en la Teoría de la Respuesta al Ítem (TRI), en este estudio se propone una aproximación no basada en juicios, en que transformaciones de las Curvas Características de los Ítems (CCIs) dan lugar a los puntos de corte fi nales. Método: se administró eCat-Listening, un test adaptativo informatizado de evaluación de la comprensión oral del inglés, a 1.576 participantes y se aplicó el método de standard setting propuesto para clasifi carles en los estándares de ejecución del Marco Común Europeo de Referencia para las lenguas (MCER). Resultados:
los resultados mostraron una clasifi cación estrechamente relacionada con variables externas relevantes sobre dominio del inglés, de acuerdo con el MCER. Conclusiones: se concluye que el método de standard setting propuesto es una alternativa práctica y válida para las interpretaciones de tests basados en TRI.
Palabras clave: standard setting, teoría de la respuesta al ítem, tests adaptativos informatizados, tests referidos a criterio.
Psicothema 2013, Vol. 25, No. 2, 238-244
doi: 10.7334/psicothema2012.147
Received: May 24, 2012 • Accepted: September 14, 2012 Corresponding author: Julio Olea
Facultad de Psicología Universidad Autónoma de Madrid 28049 Madrid (Spain)
eCat-Listening
eCat-Listening (Olea, Abad, Ponsoda, Barrada, & Aguado, 2011) is a computerized adaptive test for the evaluation of English Listening. Although, in its initial version, only norm-referenced interpretations were provided (estimation of trait-level and percentile ranks), it would be highly desirable to incorporate criterion-referenced interpretations. The test is usually applied in educational assessments and recruitment processes. In both cases, a criterion-referenced interpretation would provide information about the listening skills mastered by a person. For example, in a recruitment process, a norm-referenced interpretation might not be enough, because the highest scores do not guarantee the required skills.
eCat-Listening presents good psychometric properties (Olea et al., 2011): the bank is unidimensional, the items are satisfactorily fi tted to the 3-parameter logistic model, and an accurate estimation of the trait level is obtained. A simulation study proved the adaptive administration to be effi cient with a length of 20 items and a maximum exposure rate of .40.
Common European Framework of Reference for Languages (CEFR)
The Council of Europe published the Common European Framework of Reference for Languages (CEFR) in 2001, intended to provide objective criteria for describing language profi ciency and thus facilitate the mutual recognition of qualifi cations gained in different contexts. It establishes six levels of language profi ciency, labeled A1, A2, B1, B2, C1 and C2 (A: Basic User; B: Independent User; C: Profi cient User). It includes a global scale and specifi cs for written/ oral comprehension and written/oral production. The performance standards for oral comprehension are shown in Table 1.
In the last few years, many countries (inside and outside Europe) have accepted the CEFR, so they have had to relate their own exams to the Framework. The Council of Europe has made efforts to make this task easier and to guarantee rigorous procedures. The Council fi nally published a manual that includes several standard setting methods applied to the CEFR (Council of Europe, 2009).
Standard setting methods
According to North and Jones (2009), it is useful to classify standard setting methods into two groups: those that make use
of the Item Response Theory (IRT) and those that do not. The latter can also be classifi ed into examinee-centered methods (i.e.,
Contrasting Groups, Borderline Group, Body of Work) and test-centered methods (i.e., Tucker-Angoff, Nedelsky, Basket).
Concerning IRT-based methods, their principal advantage is that they allow the cut scores to be determined once on the item bank scale, rather than repeatedly for each new form of the test. This is due to the useful parameter invariance property of IRT.
Two IRT-based methods that have become popular in the last few years are the Bookmark Method (Mitzel, Lewis, Patz, & Green, 2001) and the Item-DescriptorMatching Method (Ferrara, Perie, & Johnson, 2002).
In the Bookmark Method, for every performance standard, the experts must decide, for each item, whether a person who reaches that standard masters the item or not. Mastery is defi ned in probabilistic terms, so the person that masters an item will give the correct response with a rather high probability. The exact defi nition of “rather high probability”, denoted as Response Probability (RP), is in principle arbitrary, but it should involve a profound refl ection about mastery and about the implications of classifying examinees in different performance standards. The Bookmark authors employ a RP of .67, although they recognize that alternative values, as .50 or .80, could be employed as well (Mitzel et al., 2001). In the Item-Descriptor Matching Method, experts must decide to which performance standard the knowledge, skills, and cognitive processes required to respond successfully to an item are most closely matched. In both IRT-based methods, items are fi rst calibrated and then presented to the experts in order of diffi culty, which facilitates their task. In spite of this operative advantage, the success of these methods seems to depend quite critically on the close relation between item diffi culty and the performance standards to which they belong. “Ideally, one would say that an item that only requires abilities and skills described at A2 is easier than an item developed for B1. This, however, might be too simplistic a view for a sound theory on item diffi culty” (Council of Europe, 2009, p. 75).
Proposed method
Contrasting with the IRT-based preceding methods, the one proposed here does not require the judgment of experts to set the cut scores. The method reaches the fi nal cut scores by performing
Table 1
CEFR Performance Standards: Listening comprehension (Council of Europe, 2001)
Label Description
A1 Can follow speech which is very slow and carefully articulated, with long pauses for him/her to assimilate meaning
A2 Can understand phrases and expressions related to areas of most immediate priority (e.g. very basic personal and family information, shopping, local geography, employment) provided speech is clearly and slowly articulated
B1 Can understand the main points of clear standard speech on familiar matters regularly encountered in work, school, leisure etc., including short narratives B2
Can understand the main ideas of propositionally and linguistically complex speech on both concrete and abstract topics delivered in a standard dialect, including technical discussions in his/her fi eld of specialization
Can follow extended speech and complex lines of argument provided the topic is reasonably familiar, and the direction of the talk is sign-posted by explicit markers
C1
Can understand enough to follow extended speech on abstract and complex topics beyond his/her own fi eld, though he/she may need to confi rm occasional details, especially if the accent is unfamiliar
Can recognize a wide range of idiomatic expressions and colloquialisms, appreciating register shifts
Can follow extended speech even when it is not clearly structured and when relationships are only implied and not signaled explicitly C2 Has no diffi culty in understanding any kind of spoken language, whether live or broadcast, delivered at fast native speed
ICC transformations that summarize item families’ responses. To classify one person in a performance standard, the method considers not only the probability of a correct response to the items of such standard, but also of the less demanding standards. The method involves the following steps:
1. Criterion-based item bank construction:
A panel of experts constructs the item bank. According to the abilities and skills each item requires, they generate k item families corresponding to k well-defi ned performance standards by which test scores might be interpreted and examinees classifi ed. The bank must represent all the standards well, so the families must be composed of a similar number of items.
For eCat-Listening, six item families must be developed corresponding to each CEFR performance standard. These families are denoted here as kA1, kA2, kB1, kB2, kC1andkC2.
2. Item bank calibration - ICC estimations:
All items are calibrated, and ICCs estimated. In IRT, the ICC represents the probability of a correct response to the item as a function of a person trait, denoted by θ. According to the 3-parameter logistic model (normal metric), for item j, this is:
Pj()=cj+
( )
1cj 11+e1.7aj
( )
bj (1)The meanings of the parameters are:
– cj pseudo-guessing parameter: it represents the probability of a correct response for people whose trait level is extremely low.
– bj diffi culty parameter: it indicates the ICC location in the abscissa axis (the more diffi cult the item is, the more to the right is the ICC), θ and bj are in the same metric. For
=bj,Pj()= 1+cj
( )
2
– aj discrimination parameter: it is directly related to the ICC slope in θ= bj.
3. Averaged-ICC calculation for every item family:
The averaged-ICC for an item family represents the averaged probability of a correct response to an item classifi ed in that family as a function of θ. For a family k made up of Jkitems,it is denoted by APk and obtained by calculating (for each θ value) the arithmetic mean of Pj(θ): APk()= Pj() j=1 Jk Jk (2)
Thus, for each item family k, APk may be interpreted as the ICC of the prototypical item of that family. For example, APkA2
indicates the probability of a correct response to the prototypical
item of kA2 as a function of θ. There are six APks to be calculated with eCat-Listening.
4. Jointaveraged-ICC calculation for every item family:
The Joint Averaged-ICC for an item family (e.g., kB1) represents the joint probability (as a function of θ) of a correct response to the prototypical item of that family (the individual probability of which is represented by APk) and to the prototypical items of each one of the less demanding item families (kA2 and kA1, in this case).
For a k family, it is represented as JAPk. Based on the local independence property of IRT, it is obtained multiplying (for each θ value) the averaged-ICCs(APks) of the item families involved:
JAPk()= APk' k'=1
k
()
(3)
There are six JAPks to be calculated with eCat-Listening. They are used to obtain the cut scores.
5. Choosing the cut scores by determining the Response Probability (RP). Validity analyses with external criteria:
Given the Joint Averaged-ICC for one item family(JAPk), the expected probability for a person who has just barely achieved the corresponding performance standard (i.e., borderline person) must be decided. That expected probability is denoted by RP, in a similar way this term is used in standard setting literature.
Once the RP has been decided, the cut score for each performance standard (denoted byθps) is that which leads to that probability in the corresponding JAPk, so:
JAPk(θps)= RP
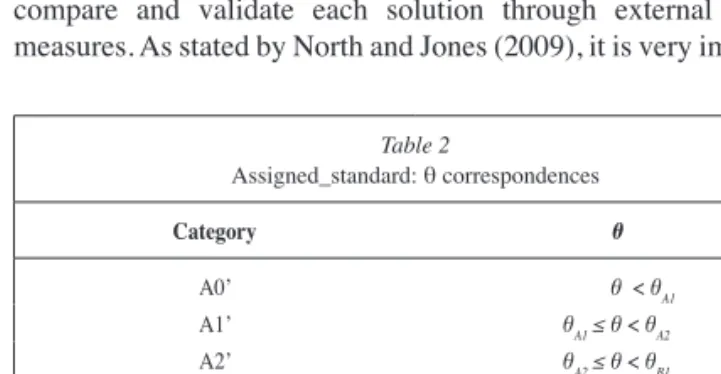
Cut scores for eCat-Listening are θA1, θA2, θB1, θB2, θC1, and θC2. They lead to an ordinal variable named Assigned_Standard, with seven levels, called: A0’—for people who do not reach θA1 — A1’, A2’, B1’, B2’, and C1’, C2’(see Table 2).
Although there is no strict rationale to choose a particular value for RP, the choice one makes has defi nite consequences on the standards that will be found. There would be infi nite cut score solutions for infi nite possible RP values.
Here, we propose, fi rstly, to obtain three cut score solutions corresponding to the RP values of .50, .67 and .80, and then, to compare and validate each solution through external criteria measures. As stated by North and Jones (2009), it is very important
Table 2 Assigned_standard: θ correspondences Category θ A0’ θ < θA1 A1’ θA1≤θ < θA2 A2’ θA2≤θ < θB1 B1’ θB1≤θ < θB2 B2’ θB2≤θ < θC1 C1’ θC1≤θ < θC2 C2’ θ≥θC2
for external criteria to be integrated into the standard setting procedure, because “the more that it can be integrated into the project, the greater the chances of an effective outcome” (p. 18). According to Hambleton (2003), validity assessment might focus on the relationship between classifi cations made on the basis of the standard setting conducted and classifi cations or on performance ratings provided externally to the test (e.g., teacher ratings or job performance ratings).
Method
Participants
Two experts in English philology, with the collaboration of three experts in psychometrics, developed and classifi ed an initial item bank for eCat-Listening (227 items), according to the CEFR performance standards for listening comprehension.
One hundred and two items were administered to a sample of 1,576 people, mainly participants in selection processes. Six hundred and thirty-fi ve of them were students from the Escuela Ofi cial de Idiomas (EOI; Offi cial School of Languages).
Instruments
eCat-Listening. Three subtests were elaborated, each one with 42 items: 12 as the anchor test and 30 specifi c items. Subtests were elaborated to properly represent the six CEFR performance standards. The total sample of 1,576 people was divided into three subsamples (n1= 592, n2= 605, n3= 379 for each subtest).
Criteria measures. In order to perform validity analyses, eCat-Grammar (Olea, Abad, Ponsoda, & Ximénez, 2004), which is a computerized adaptive test for the assessment of written English, and a self-report questionnaire about English knowledge and studies were administered. In the questionnaire, the participants informed about: (a) the type of school where they had attended their middle studies (bilingual-English or others), (b) their perceived mastery in English (Reading, Writing and Oral_ perceived_mastery), and (c) their training in English (primary
and secondary education, academies —Years_in_academy—,
family, stays in Anglo-Saxon countries, and others). Lastly, the EOI students informed about the grade they were registered in at that school (EOI_grade: “Básico” 1, “Básico” 2, “Intermedio” 1, “Intermedio” 2, “Avanzado” 1, “Avanzado” 2) and their educational level (Educational_level: no studies, primary studies, secondary studies, university studies).
Data analysis
ICCs were estimated with the Bayesian marginal maximum-likelihood procedure, as implemented in MULTILOG 7.0 (Thissen, Chen, & Bock, 2003). Averaged–ICCs for the six item families were calculated by [2]. Lastly, JointAveraged–ICCs were calculated by [3].
Cut scores (θA1, θA2, θB1, θB2, θC1, and θC2) were obtained by using
RPs of .50, .67, and .80. Each solution led to a different ordinal variable. They were named Assigned_Standard_.50, Assigned_ Standard_.67, and Assigned_Standard_.80 (corresponding to RPs
of .50, .67 and .80, respectively). They were related to the criteria measures in order to decide which solution was more valid. The following analyses were performed with SPSS Statistics 19:
Firstly, stepwise multiple linear regression was performed in order to determine which variables were signifi cant predictors of θ before being discretized.
Secondly, signifi cant predictors from the linear regression were included as predictors of Assigned_Standard in an ordinal regression. Pseudo-R2 statistics were calculated in order to assess and compare the intensity of the relation between predictors and each Assigned_Standard variable.
Lastly, contingency tables were obtained to analyze the relationship between each Assigned_Standard and the variables
Oral_perceived_mastery and EOI_grade, the two variables with the highest standardized coeffi cients in the linear regression, aftereCat-Grammar, and which provide correct English mastery classifi cations. The EOI_grade is actually a very useful variable because the EOI relates its grades to the CEFR performance standards. Due to nonsignifi cant differences in θ between adjacent grades (Olea et al., 2011), the original EOI grades “Básico” 1 and 2, “Intermedio” 1 and 2, and “Avanzado” 1 and 2 were grouped, respectively, into Basic, Intermediate and Advanced. According to the EOI equivalences between its grades and the CEFR performance standards (EOI, 2011), those mainly expected standards achieved by students in each grade are: A0’, A1’ and A2’, in Basic; A2’ and B1’, in Intermediate; B1’ and B2’, in Advanced. Contingency tables were interpreted according to these expected values.
Results
Joint averaged-ICC calculation
ICCs were estimated for the defi nitive bank of 95 items (specifi c criteria for selecting items can be consulted in Olea et al., 2011).
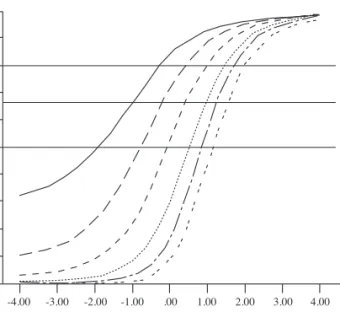
Averaged-ICCs (APks) obtained for each family k are shown in Figure 1.
As shown in Figure 1, kA1 and kA2 curves overlap, as do curves kB2 and kC1. This is probably due to disordinality, which refers to the fact that a panelist may have a different perception of item diffi culty or demand than is indicated by its empirical characteristics (Pant, Rupp, Tiffi n-Richards, & Köller, 2009).
Pr obability 1.00 .90 .80 .70 .60 .50 .40 .30 .20 .10 .00 -4.00 -3.00 -2.00 -1.00 .00 1.00 2.00 3.00 4.00 Theta kA1 kA2 kB1 kB2 kC1 kC2
JointAveraged-ICCs(JAPks) calculated for each family k are shown in Figure 2.
As logical, there is no overlapping between JAPks.
Cut scores are shown in Table 3, according to RPs of .50, .67 and .80. In order to assess how harsh each solution is, the APk value (Figure 1) for each standard cut score is also included (in brackets).
By analyzing the APk values, it can be observed that the RP of .80 led to very harsh cut scores. For example, classifi cation of θ in A2 (i.e., θA2= .35) involves a probability of a correct response of .90 to the prototypical item of the corresponding item family. This really does not seem meaningful for the borderline person. Upper standard cut scores also led to probabilities of .90 or higher in the corresponding APks. For this reason, the RP of .80was discarded.
Validity analyses with external criteria
In the multiple linear regression of θ on criteria measures, the ANOVA was statistically signifi cant (F5, 629= 194.74, p<.0005). The coeffi cient of determination R2 was .61. Table 4 shows the regression coeffi cients for the resulting fi ve signifi cant predictors from criteria variables.
The signifi cant predictors shown in Table 4 were those used for ordinal regression. McFadden statistics corresponding to DVs
Assigned_Standard_.50 and Assigned_Standard_.67 were very similar (.272 and .277, respectively) and, therefore, inconclusive for selecting the cut score solution.
Tables 5 and 6 present the contingency tables Oral_perceived_ mastery × Assigned_Standard_.50 and Oral_perceived_mastery ×
Assigned_Standard_.67.
Many of the values from Table 5 were expected. Almost 70% of the people who said they spoke/understood English as well as Spanish were classifi ed as C2’ or C1’. Most of the people who said they could not speak English were classifi ed as A0’ or A1’. Most of people who said they could speak/understand English well were classifi ed as B2’ or higher, etc.
However, the results shown in Table 6 were unexpected. Half of the people who said they spoke/understood English as well as Spanish were classifi ed as B1’ or lower. More than 70% of the people who said they could speak/understand English with diffi culty in diverse social contexts were classifi ed lower B1’, etc.
Tables 7 and 8 present the contingency tables EOI_grade
× Assigned_Standard_.50 and EOI_grade × Assigned_ Standard_.67.
Most of the values from Table 7 were expected. More than 90% of the Basic students were classifi ed as A0’, A1’ or A2’. Nearly 70% of Intermediate students were classifi ed as A2’ or B1’. And more than 60% of Advanced students were classifi ed as B1’ or B2’.
On the other hand, the values from Table 8 were unexpected. The majority of the Intermediate students were classifi ed as A0’ or A1’. And half of the Advanced students were classifi ed as A2’ or lower.
In conclusion, individual analyses allowed choosing the cut scores corresponding to RP= .50 (see Table 3) as the best solution of those contrasted.
Discussion
In order to guarantee the validity of psychological and educational testing, criterion-referenced interpretations of scores are necessary. Nevertheless, as Elosua (2012) has shown, most of the manuals of widely used tests still propose only normative interpretations.
Fortunately, criterion-referenced testing is becoming widespread in some fi elds. That is the case with language-profi ciency assessments, where it is especially relevant to determine what examinees know or can do in relation to well-defi ned performance standards, like those provided by the CEFR, rather than in relation to other persons. Actually, the CEFR has increasing infl uence on language testing organizations and stakeholders worldwide that
Pr obability 1.00 .90 .80 .70 .60 .50 .40 .30 .20 .10 .00 -4.00 -3.00 -2.00 -1.00 .00 1.00 2.00 3.00 4.00 Theta kA1 kA2 kB1 kB2 kC1 kC2
Figure 2. Joint averaged-ICCs for the six item families. Three parallel lines are drawn at probabilities of .50, .67 and .80
Table 3
Cut Scores for RPs of .50, .67 and .80
Cut score RP θA1 θA2 θB1 θB2 θC1 θC2 .50 -1.93(.50) (.70)-.81 (.72)-.10 (.72).50 (.80).81 (.79)1.12 .67 -1.03 (.67) -.22 (.82) .39 (.82) .94 (.83) 1.22 (.89) 1.52 (.87) .80 -.33 (.80) .35 (.90) .92 (.90) 1.40 (.91) 1.65 (.94) 1.96 (.93)
Note: APk value for each standard cut score is shown in brackets. As logical, it is equal to RP in θA1
Table 4
Standardized Coeffi cients of Linear Regression. DV: θ
Variable Beta p eCat-Grammar .52 <.0005 EOI_grade .16 <.0005 Oral_perceived_mastery .15 <.0005 Educational_level .12 <.0005 Years_in_academy .08 .001
seek to align their exams to that Frame for reasons of transparency and coherence (Taylor & Jones, 2006). According to Tannenbaum and Wylie (2008), by relating test scores to the CEFR, an operational bridge is built between psychometrically sound, standardized assessments of language competencies and meaningful CEFR-based classifi cations of such competencies. Prestigious English-language test providers like Cambridge or Educational Testing Service (ETS) actually try to align their exams to the Frame.
Relating a language-profi ciency test to the CEFR involves establishing cut scores that allow classifying examinees according to the Frame. There are many standard setting methods to establish cut scores, and there is no agreement in the fi eld about which is the best one, which probably depends on the features and objectives of the testing involved. In any event, regardless of which method is chosen, it must be based on non-arbitrary, explicit, and clearly documented criteria (AERA, APA, & NCME, 1999; Cizek & Bunch, 2007). Furthermore, some external criteria might be integrated into the procedure with the aim of validating the interpretations and classifi cations that the cut scores lead to.
The current study has proposed a new IRT-based standard setting procedure that, compared to other available methods, does not require experts judgments to obtain the fi nal cut scores. The method involves working with ICC transformations to obtain possible cut score solutions and performing validity analyses to compare them and choose the best one. In the case of eCat-Listening, defi nitive cut scores led to an ordinal variable that was signifi cantly and highly related to external measures of the English-language domain, according to the CEFR.
In spite of this successful application to eCat-Listening, it is important to realize that item bank development is critical for this method. So the better the test developers classify the items into the performance standards, the better the method works. A highly diffi cult task that, contrasted with other IRT-based methods, cannot be facilitated by item diffi culty information or feedback.
Some refl ection about the way the method summarizes item family ICCs should be made also. In spite of the successful application of the method to eCat-Listening, by obtaining the Table 5
Contingency table: Oral_perceived_mastery × Assigned_Standard_.50
Assigned_Standard_.50
Description A0’ A1’ A2’ B1’ B2’ C1’ C2’
Cannot speak/understand English 33.3% 37.5% 16.7% 8.3% 0% 0% 4.2%
Only easy conversations 4% 38.7% 40% 13% 2.7% 1.3% .3%
In several contexts, but with diffi culty 1.5% 11.7% 28.2% 34.4% 14.3% 6.8% 3.2%
Well 0% 1.1% 5.9% 24.6% 19.8% 18.4% 30.2%
As well as Spanish 0% 0% 1.3% 15.6% 15.6% 23.4% 44.2%
Note: Percentages by row. They are in boldface if corrected standardized residuals are greater than +1.96
Table 6
Contingency table: Oral_perceived_mastery × Assigned_Standard_.67
Assigned_Standard_.67
Description A0’ A1’ A2’ B1’ B2’ C1’ C2’
Cannot speak/understand English 62.5% 25% 8.3% 0% 0% 4.2% 0%
Only easy conversations 31.3% 45% 18.7% 3.3% 1.3% 0% .3%
In several contexts, but with diffi culty 8.3% 28.4% 34.2% 22.9% 3.8% 1.3% 1.1%
Well .8% 4.5% 18.2% 37.2% 15.6% 11.7% 12%
As well as Spanish 0% 1.3% 10.4% 37.7% 13% 23.4% 14.3%
Note: Percentages by row. They are in boldface if corrected standardized residuals are greater than +1.96.
Table 7
Contingency table: EOI_grade × Assigned_Standard_.50
Assigned_Standard_.50
Grade A0’ A1’ A2’ B1’ B2’ C1’ C2’
Basic 6% 43.2% 42.6% 5.5% 2.2% 0% 0.5%
Intermediate .7% 20.6% 35% 34.4% 8.7% 2.9% .7%
Advanced 0% 1.7% 14.3% 39.4% 22.3% 12% 10.3%
Note: Percentages by row. They are in boldface if corrected standardized residuals are greater than +1.96
Table 8
Contingency table: EOI_grade × Assigned_Standard_.67
Assigned_Standard_.67
Grade A0’ A1’ A2’ B1’ B2’ C1’ C2’
Basic 33.9% 53.6% 9.8% 2.2% 0% 0% .5%
Intermediate 13% 39.4% 29.6% 16.2% 1.1% .4% .4%
Advanced 1.1% 8% 40.6% 34.9% 6.3% 4.6% 4.6%
Note: Percentages by row. They are in boldface if corrected standardized residuals are greater than +1.96.
arithmetic mean of individual probabilities some of the averaged curves were overlapping. Although it was thought to be explained by the phenomenon known as disordinality, it would be interesting to contrast other existing procedures to summarize data from item families. For instance, Sinharay, Johnson, and Williamson (2003) introduced the concept of family expected response function
(FERF), which summarizes ICCs via a Bayesian hierarchical model. Further investigation is suggested to analyze the advantages
and disadvantages of incorporating this or other procedures into the standard setting method proposed here.
Acknowledgements
This research was partly supported by two grants from the Spanish Ministerio de Educación y Ciencia (projects PSI2008-01685 and PSI2009-10341) and by the UAM-IIC Chair Psychometric Models and Applications.
References
American Educational Research Association, American Psychological Association, & National Council on Measurement in Education (1999).
Standards for educational and psychological testing. Washington, DC: American Psychological Association.
Cizek, G.J., & Bunch, M.B. (2007). Standard setting. A guide to establishing and evaluating performance standards on tests. London: Sage. Council of Europe (2001). Common European Framework of Reference
for Languages: Learning, teaching, assessment. London: Cambridge University Press.
Council of Europe (2009). Relating language examinations to the Common European Framework of Reference for Languages. Learning, teaching, assessment: A manual. Retrieved from http://www.coe.int/t/dg4/ linguistic/manuel1_en.asp.
Cronbach, L.J., & Meehl, P. (1955). Construct validity in psychological tests. Psychological Bulletin, 52, 281-302.
Elosua, P. (2012). Tests publicados en España: usos, costumbres y asignaturas pendientes [Tests published in Spain: Uses, customs and unresolved matters]. Papeles del Psicólogo, 33(1), 12-21.
EOI (2011, October 29). Grades [institutional information]. Retrieved from http://www.eoipalma.com/index.php?option=com_content&task=view &id=171&Itemid=88.
Ferrara, S., Perie, M., & Johnson, E. (2002): Matching the judgmental task with standard setting panelist expertise: The item-descriptor (ID) matching procedure. Washington, DC: American Institutes for Research.
Hambleton, R.K. (2001). Setting performance standards on educational assestments and criteria for evaluating the process. In G. Cizek (Ed.),
Setting performance standards: Concepts, methods and perspectives
(pp. 89-116). Mahwah, NJ: Erlbaum.
Hambleton, R.K. (2003). Criterion-referenced testing: Methods and procedures. In R. Fernández-Ballesteros (Ed.), Encyclopedia of psychological assessment (pp. 280-283). London: Sage.
Mitzel, H.C., Lewis, D.M., Patz, R.J., & Green, D.R. (2001). The bookmark procedure: Psychological perspectives. In G.J. Cizek (Ed.), Setting performance standards: Concepts, methods and perspectives (pp. 249-281). Mahwah, NJ: Erlbaum.
North, B., & Jones, N. (2009). Maintaining standards across languages, contexts and administrations by exploiting teacher judgment and IRT scaling. Retrieved from Council of Europe website: http://www.coe. int/t/dg4/linguistic/manuel1_en.asp.
Olea, J., Abad, F.J., Ponsoda, V., Barrada, J.R., & Aguado, D. (2011). eCat-Listening: Design and psychometric properties of a computerized adaptive test on English Listening. Psicothema, 23(4), 803-808. Olea, J., Abad, F.J., Ponsoda, V., & Ximénez, M.C. (2004). Un test adaptativo
informatizado para evaluar el conocimiento del inglés escrito: diseño y comprobaciones psicométricas [A computerized adaptive test for the assessment of written English: Design and psychometric properties].
Psicothema, 16(3), 519-525.
Pant, H.A., Rupp, A.A., Tiffi n-Richards, S.P., & Köller, O. (2009). Validity issues in standard-setting studies. Studies in Educational Evaluation,
35, 95-101.
Sinharay, S., Johnson, M.S., & Williamson, D.M. (2003). Calibrating item families and summarizing the results using family expected response functions. Journal of Educational and Behavioral Statistics, 28(4), 295-313.
Tannenbaum, R.J., & Wylie, E.C. (2008). Linking English-language test scores onto the Common European Framework of Reference: An application of standard-setting methodology (TOEFL iBT Research Report-06). Princeton, NJ: ETS.
Taylor, L., & Jones, N. (2006). Cambridge ESOL exams and the Common European Framework of Reference (CEFR). Research Notes, 24, 2-5. Thissen, D., Chen, W.H., & Bock, R.D. (2003). Multilog (version
7) [Computer software]. Lincolnwood, IL: Scientifi c Software International.