Semantically Assisted Loop Closure in SLAM Using NDT Histograms
Anestis Zaganidis
Alexandros Zerntev
Tom Duckett
Grzegorz Cielniak
Abstract— Precise knowledge of pose is of great importance for reliable operation of mobile robots in outdoor environments. Simultaneous localization and mapping (SLAM) is the online construction of a map during exploration of an environment. One of the components of SLAM is loop closure detection, identifying that the same location has been visited and is present on the existing map, and localizing against it. We have shown in previous work that using semantics from a deep segmentation network in conjunction with the Normal Distributions Transform (NDT) point cloud registration im-proves the robustness, speed and accuracy of lidar odometry. In this work we extend the method for loop closure detection, using the labels already available from local registration into NDT Histograms, and we present a SLAM pipeline based on Semantic assisted NDT and PointNet++. We experimentally demonstrate on sequences from the KITTI benchmark that the map descriptor we propose outperforms NDT Histograms without semantics, and we validate its use on a SLAM task.
I. INTRODUCTION
Simultaneous localization and mapping (SLAM), the on-line construction of a map and the localization within it, remains a challenging problem, especially for outdoor en-vironments with low structure and when the pose has 6 degrees of freedom, such as when a robot is moving on uneven natural terrain. To achieve reliability in SLAM, it is crucial to identify places that have been visited before and are present in the map in order to bound the drift caused by dead reckoning, a procedure known as loop closure detection. Of particular benefit is the use of 3d laser scanners (lidar), which are less prone to environmental conditions and changes in illumination compared to visible light sensors, provide a direct 3d representation without further processing and offer 360 degrees field of view; significant advantages for robust and safe operation. For loop closure detection, however, the current generation of lidars provide sparse readings only (point clouds) and commonly used vision-based methods are not directly applicable, for example, for the matching of key points.
The Normal Distributions Transform (NDT) [1], [2] is a compact representation of point clouds that is also used as a map representation. It reduces the point cloud into a set of normal distributions, each centered in a cell of a voxel grid. We have shown in our previous work that the inclusion of semantic information in NDT can improve registration, i.e.
All authors are with the Lincoln Centre for Autonomous Systems (LCAS), University of Lincoln, UK. Corresponding author Anestis [email protected]
This work has received funding from the European Unions Horizon 2020 research and innovation programme under grant agreement No 732737 (ILIAD).
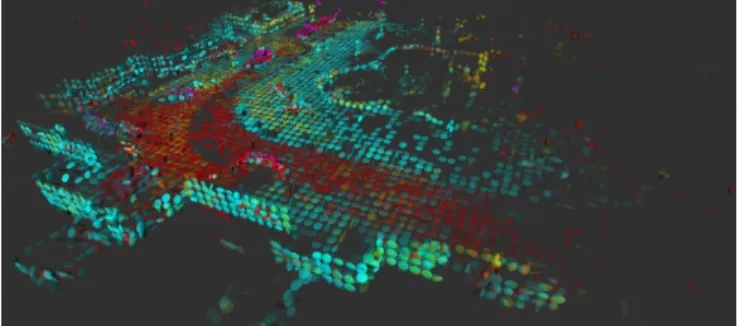
Fig. 1. A map instance as visible by the system at pose (-150,210) of KITTI sequence00. The colors represent classes, and the opacity the occupancy value of the cells.
the alignment of point clouds, thus improving the accuracy, robustness and speed of dead reckoning, even in cases of low point cloud overlap and severe initial registration and translation error [3], [4]. The resulting method, Semantic assisted NDT (SE-NDT) used PointNet [5], a deep network trained for the task of semantic segmentation, as the source of semantic labels. In this work, we apply the same concept to NDT Histograms [6], a method for global registration and loop closure detection, and present a complete Semantic SLAM solution, based on SE-NDT and PointNet++ [7]. Contributions of this work include:
1) a new method for semantic assisted loop closure for SLAM, based on NDT Histograms,
2) exploitation of a single deep semantic segmentation network for both registration and loop closure, and 3) experimental validation of the method on a standard
SLAM dataset, which demonstrates superior perfor-mance compared to the standard version of loop clo-sure based on non-semantic NDT Histogram descrip-tors.
The paper is structured as follows. First, we present re-lated work in global registration and mapping for point-cloud-based SLAM. In Section III we present the proposed SLAM pipeline and introduce our map descriptor. Section IV presents the methodology of the experiments and the results, and Section V concludes the paper and suggests directions for future work.
II. RELATED WORK
Global registration and loop closure detection methods can be categorized into local-region-based and scan-based.
Fast Global Registration [8] is a method for global registration, which could have application in loop closure detection. It makes use of Fast Point Feature Histograms [9],
a local region descriptor, to find correspondences in feature space that are further filtered to reduce incorrect matches.
Another local feature method is the interest point descrip-tor for robust map matching (IRON) [10], a local keypoint descriptor calculated over an NDT map. The authors note increased robustness with lower computing time than FPFH. They do not use the descriptor for loop closure, but for Monte Carlo localization and also evaluate the one-shot matching on a pre-built map.
Other methods make use of scan descriptors for the problem of global registration. LocNet [11] uses hand-crafted point cloud features that are then compared using a siamese neural network that compresses the features into the encoded representation. The features rely on the property of rotational lidar to generate concentric rings of points, and operate on each ring independently.
Multiview 2D Projection (M2DP) [12] is another method that applies to the entire scan. The cloud is projected into different 2D planes, and a histogram of the points is constructed according to their distance and angle from the origin. The final descriptor comprises the two largest vectors of the factorized matrix of accumulated histograms.
The Normal Distributions Transform Histogram [6] is a scene descriptor evaluated over an NDT map. It encodes information about the shapes and orientations of the normal distributions over varying ranges from the sensor. It has been used both for loop closure and place categorization [13].
Regarding mapping and map representations, Segment mapping using data-driven descriptors (SegMap) is an al-gorithm that segments the scene incrementally as the robot moves, and then passes the segments onto a deep learned descriptor to extract a signature per segment [14], [15]. The map comprises the set of descriptors and their locations, which can be used for global localization, reconstruction of the segments, and as an input to a supervised classifier to ex-tract semantics. The method relies on an external registration algorithm to maintain the lidar odometry. The segmentation pre-processing removes the ground points, which might not be desirable in some applications, such as those requiring full 6d mapping or analysis of traversible terrain.
On mapping using NDT, the authors of [16] propose a SLAM system that uses occupancy mapping, tracks dynamic cells, and represents the path as a pose graph. There is no active global registration, and loop closures are checked based on the pose uncertainty, matching the current map to all possible candidates that are likely to overlap.
In this work we use a local map descriptor, with the readings of multiple scans fused together into one NDT. The descriptor encodes both geometric and semantic information about the environment, and a single source of semantics is used to improve both lidar odometry and loop closure detection.
III. METHODOLOGY
We present a mapping system based on the Seman-tic assisted Normal Distributions Transform. The mapping
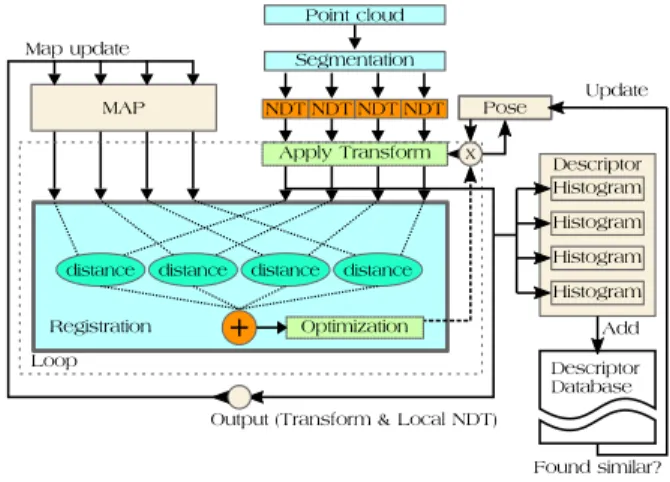
Point cloud Segmentation NDT NDT NDT NDT
Registration
distance distance distance distance
Optimization Apply Transform
Loop MAP
Output (Transform & Local NDT) Map update x Pose Descriptor Histogram Histogram Histogram Histogram Descriptor Database Add Found similar? Update
Fig. 2. The block diagram of the proposed semantic SLAM pipeline. TABLE I
POINTNET++ NETWORKHYPER-PARAMETERS
Type Value Type Value Type Value Sampling 1024 Grouping 32 Pntnet Conv 64,64 Sampling 512 Grouping 8 Pntnet Conv 256,128 Sampling 256 Grouping 8 Pntnet Conv 512,256 Sampling 128 Grouping 4 Pntnet Conv 512 Sampling 64 Grouping 4 Pntnet Conv 512 Dropout 0.75 Feat. Prop 512 Feat. Prop 256 Feat. Prop 128 Feat. Prop 64 Feat. Prop 64
Conv 1d 32 Relu Conv 1d 8
*(Read row-wise.)
pipeline is visualized in Figure 2 and can be summarized in the following steps:
• semantic segmentation of the cloud; • registration, lidar odometry;
• map update;
• construction of map descriptor;
• loop close to the node with most similar descriptor. In the present state, the pipeline does not contain any relaxation/pose graph optimization, which would be the next step to improve localization precision and map quality. The focus of the paper is instead on the demonstration of the proposed map descriptor for loop closure.
A. Semantic Segmentation
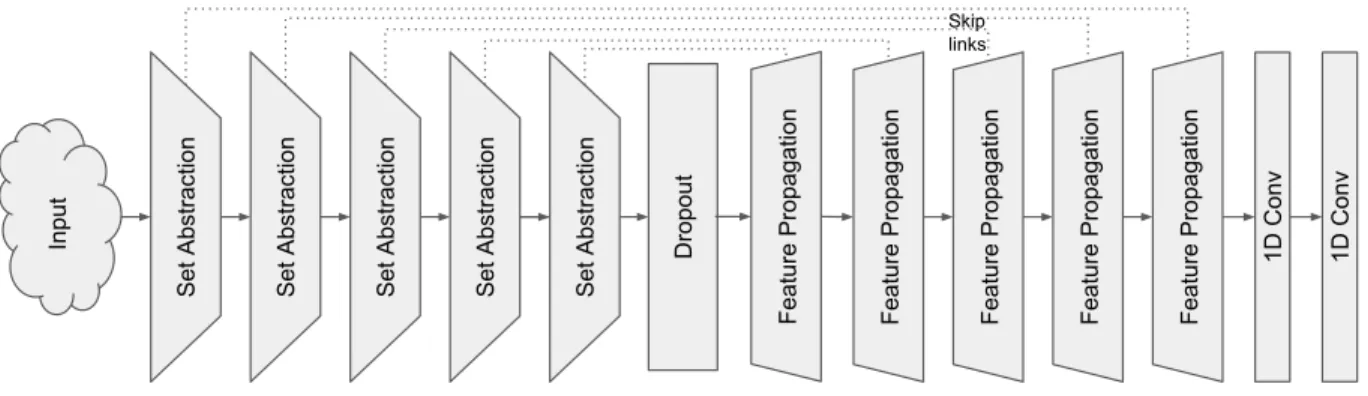
Each lidar scan acquired is processed by a deep neural network and segmented into 8 classes. In contrast to [4], where PointNet was used for the semantic segmentation, we use PointNet++ [7] that processes the cloud hierarchi-cally. Therefore the cloud does not need to be segmented into blocks before processing. An artificial dataset with 8 semantic categories is used to train the network, sampled from Semantic3d.net [17] to emulate a 64-beam lidar. For details of the training strategy and the artificial dataset see [4]. We also use a simpler model and, with a compromise in classification accuracy, the processing time is lowered significantly, from 0.8 to 0.07 seconds per cloud. The hyper-parameters of the model can be found in Table I, and the architecture in Figure 3.
Set Abstraction Set Abstraction Set Abstraction Set Abstraction
Input Dropout
Feature Propagation Feature Propagation Feature Propagation Feature Propagation
Skip links
Set Abstraction
Feature Propagation
1D Conv 1D Conv
Fig. 3. PointNet++ architecture used for semantic segmentation.
B. Scan registration
To obtain the alignment between two clouds we use a registration method that is constrained by the segmenta-tion of the clouds, Semantic assisted Normal Distribusegmenta-tions Transform (SE-NDT) [3]. SE-NDT is an extension of the 3D Normal Distributions Transform [2], [18]. Instead of operating directly on the point cloud, the method applies a voxel grid on the cloud, and fits a set of normal distributions to the points of each segment, one distribution per voxel per segment. To register two NDTs, the objective is to estimate the transformation that minimizes the L2 distance between the distribution sets. Only correspondences that belong to the same semantic label are considered.
In this work, we apply two steps of registration. The cloud is first registered to the previous cloud, and then the transform is used as an initial estimate to register it to the global map. We found that local registration had higher translation accuracy, and registration to the global map had higher accuracy in rotation, when the scene contained low geometric structure. This combination resulted in increased robustness in our odometry tests.
C. Map representation.
The map is based on NDT Occupancy Maps [19], and has similarities to [20], as it uses submaps, centered on the nodes of a pose-graph. Those approaches use local maps that partially overlap, and when the robot moves outside a predefined range a new map is loaded. We follow a different approach that could be described as a scrolling map. When the robot moves and a cell is no longer within the visible range, it is unloaded and stored, then a new cell is initialized in the area currently visible by the sensor. The occupancy of the cells is continuously updated while they are within the reach of the sensor. The cells are associated to the node that initialized them. If the robot crosses the same path again, it will create new cells associated to the new nodes, and will not load the previous map instances, so that each consecutive pass will create cells that overlap with the previous ones. The stored map is loaded only in the event of a loop closure. Currently we do not employ any method to constrain the number of cells. For that purpose, the NDT cells from different nodes can be fused, as in [21]. In contrast
to the prior work, we maintain an NDT-OM for each one of the classes.
D. Loop closure
As the robot moves, the pose error will accumulate. Loop closure detection is the recognition of a previously visited location that aims to bound the pose error. To identify such an event, we use a map descriptor that extends the 3D-NDT Historgam by incorporating semantic information.
1) 3D-NDT Histograms: The NDT Histogram descriptor, originally proposed in [6], encodes the appearance of a scan as a histogram of the orientations of the normal distributions. Each distribution in an NDT can be classified as planar, linear or spherical according to the eigenvalues of its covariance. Assuming the eigenvalues λ1 ≥ λ2 ≥ λ3, the distribution is classified as linear if λ1 λ2 ≈ λ3, as planar if
λ1 ≈ λ2 λ3 and as spherical if λ1 ≈ λ2 ≈ λ3. The planar distributions are then binned according to the orientation of their normals, and the spherical distributions according to their distance from the origin. Only one bin is used for linear distributions. The final descriptor consists of three histograms, for different ranges of distance. In [6] the histogram is then rotated according to the principal directions in order for the descriptor to have rotational invariance, aligning the principal direction to the Z-axis.
Our method is based on [22], where the authors proposed the alignment of histograms during comparison instead of computing rotation invariant histograms. Instead of only counting the frequency of the bins, this method also estimates the mean of the normals for each bin in order to obtain more precise results.
In order to match two histograms F,G, the method first finds the top n dominant bins. The average directions for each of the dominant bins are then estimated as D1 =
{d1
1. . .d1n} andD2 ={d21. . .d2n}. Next, the method com-putes all possible permutations between pairs of directions d1
a,d1b from D1 and d2a,d2b from D2. Each pair defines a
plane by its cross product, and a closed-form solution exists for the rotation that alignsd1
a×d1b tod 2
a×d2b. The resulting rotation matrix is applied to h1, and the rotation matrix that minimizes its distance to h2 is selected as the correct rotation. The distance measure used is the Euclidean norm,
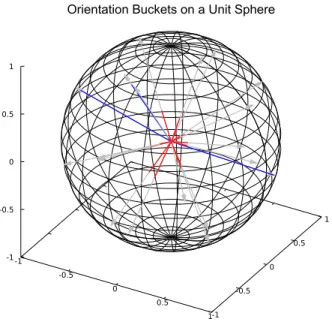
-1 -0.5 0 0.5 1-1 -0.5 0 0.5 1 -1 -0.5 0 0.5 1
Orientation Buckets on a Unit Sphere
Fig. 4. Step of the calculation of histogram bins. Splitting of planar distributions into buckets depending on their orientation. The three dominant directions in blue.
the rotation R to the histogram. Figure 4 visualizes the splitting of the planar distributions into bins depending on their orientation.
2) Semantic NDT Histograms: We extend NDT His-tograms by incorporating an additional dimension, with the assumption that it will increase the descriptor’s specificity, leading to higher identification accuracy in loop closure. Low specificity on NDT Histograms occurs when the normals of the components are uniformly distributed, for example, when the scene is predominantly occupied by convex or concave objects larger than the resolution of the voxel grid. After the transformation of the segmented cloud to SE-NDT, three NDT Histograms are constructed per class, for different distance ranges from the origin. The shape of the resulting descriptor is 3×Nclasses ×(Nsphere+Nplane+ 1). For the alignment of the descriptors we use the approach of [22]. The average directions of the planar bins, required by the matching algorithm, are jointly estimated for all the classes. In contrast to NDT Histograms, we use the Kullback-Leibler divergence to measure the similarity of descriptors. The measure is defined as
DKL(P||Q) =− X x∈X P(x)log Q(x) P(x) . (1)
It represents the cross entropy of the two distributions, reduced by the entropy of the reference distribution. This is the measure we want to minimize, since we want the distributions to have high similarity (low cross entropy), and also for the distributions to be highly discriminative, i.e. to have low similarity to the uniform distribution (low entropy). We found that this metric outperformed Euclidean distance
on all tested configurations of the SE descriptor, as shown in the experiments.
3) Application in loop closure detection: A Semantic Histogram of an NDT descriptor is estimated for the resulting global map, centered at the current sensor location and considering only cells within a defined range. We include a filtering step to retain only descriptors which are highly discriminative. We calculate the entropy of the histogram descriptor, i.e. the similarity to a uniform distribution, and we only keep the descriptor with the lowest entropy for each path segment of a set length. Histograms close to uniform distributions would not have such distinct dominant direc-tions, affecting their matching performance, and would also increase the likelihood of selecting cluttered scenes, instead of ones with prominent structural and semantic features. The descriptor and the pose are the nodes in the pose-graph.
Loop closures are searched on every iteration, by search-ing a radius around the current pose proportional to the accumulated uncertainty of the registration since the last loop closure. The covariance estimate from [22] is used, which is calculated using the estimated variance of the sensor measurement and the Hessian and partial derivative with respect to the sensor measurements of the Jacobian of the registration function. For every pose with a NDT Histogram descriptor within this radius, we calculate the histogram similarity by means of KL-divergence, and if it is less than a defined threshold, a registration is attempted between the old map and the current map.
We perform further filtering to reduce incorrect predictions in the case of a descriptor with high false positive rate. The loop closure is accepted only if:
• the value of the NDT score functionfd2dis below a set threshold, and
• the resulting transformation is within the calculated uncertainty interval.
If these conditions are not met, the candidate node is erased from the graph, as it is likely that the descriptor does not have sufficient discriminative power for that environment. Filtering was not applied in the experiments, unless stated.
IV. EXPERIMENTS
We evaluate the proposed semantic NDT histograms against the NDT histograms presented in [22], using se-quences of the publicly available KITTI dataset for lidar odometry [23]. The experiments are divided into two parts. The evaluation of the proposed descriptor for the task of place recognition in Section IV-A is done using sequence
00of the KITTI dataset. We show precision-recall plots for different configurations of the descriptor, and compare KL-divergence and Euclidean distance as measures of similarity. The mapping method is validated in Section IV-B, where we run the proposed algorithm on sequences00and08. Table II presents the parameters that were used for the validation of the methods.
0.1 1 10 100 1000 20 40 60 80 100 120 140 160 180
Pose distance (meters).
Pose series difference.
0 0.01 0.02 0.03 0.04 0.05 0.06 0.07 0.08 0.09 Histogram similarity
Fig. 5. NDT Histogram Similarity for each pair of point clouds and their corresponding pose and sequential distance.
0.1 1 10 100 1000 20 40 60 80 100 120 140 160 180
Pose distance (meters).
Pose series difference.
0.18 0.19 0.2 0.21 0.22 0.23 0.24 0.25 0.26 0.27 Histogram similarity
Fig. 6. SE-NDT Histogram Similarity for each pair of point clouds and their corresponding pose and sequential distance.
A. Descriptor evaluation.
To demonstrate the performance in place recognition, we first run the algorithms for the entire sequence 00 of the dataset, in order to get the maps, poses and histograms, as described in Section III-D.3. For every possible pair of nodes, we plot on the horizontal axis the distance between nodes according to their sequence of construction, i.e. node ID, and on the vertical axis the L2 distance between the poses. The color of the data points represents the distance of the maps in the histogram space. Points that approach the horizontal axis, other than at node distance 0, are therefore potential loop closure points, since they symbolize a location that is revisited after a period of time. The ideal algorithm would give very low values when the distance in space is small, and very high otherwise. However, due to environment aliasing (the similarity of scenes, for example, due to common elements in the length of one street) we expect some false positives. For better visibility, we have thresholded the values of similarity, at0.09for Histograms, see Figure 5, and0.27for Semantic Histograms, see Figure 6. We also present the results for the Semantic Histograms in the form of a similarity matrix and ground truth matrix in Figure 11.
We notice that the Semantic Histograms give significantly
0 5 10 15 20 25 0 100 200 300 400 500 600 700 Cor rect loop r ecognitions.
Incorrect loop recognitions.
NDT Histograms loop closure recognition comparison Semantic, 60 bins Semantic, 40 bins Semantic, 20 bins No sem, 60 bins No sem, 20 bins
Fig. 7. True positives and false positives with varying similarity threshold. Tested on different bin sizes (the same bin count for both planar and spherical in this set of experiments).
0 0.1 0.2 0.3 0.4 0.5 0.6 0.7 0.8 0.9 1 0 0.1 0.2 0.3 0.4 0.5 0.6 0.7 0.8 0.9 1 P recision Recall SE-Loop, KL, 121 bins SE-Loop, KL, 81 bins SE-Loop, KL, 41 bins SE-Loop, KL, 26 bins SE-Loop, L2, 26 bins SE-Loop, L2, 121 bins NDT-HIST, L2, 26 bins NDT-HIST, KL 121 bins
Fig. 8. Precision Recall for different parameters including loop closure descriptors, similarity metric and bin count.
-100 0 100 200 300 400 500 -300 -200 -100 0 100 200 300 Y (meter) X (meter) KITTI 00 Start Ground truth Open loop SE-Loop, 60 bins Loop closure
Fig. 9. Estimated path for KITTI sequence 00. SE-Loop is the proposed se-mantic NDT histogram, and Open loop is the pose calculated by registration without loop closure.
-50 0 50 100 150 200 250 300 350 400 -400 -300 -200 -100 0 100 200 300 400 500 Y (meter) X (meter) Start Ground truth Open loop SE-Loop, 60 bins Loop closure
Fig. 10. Estimated path for KITTI sequence 08. SE-Loop is the proposed semantic NDT histogram, and Open loop is the pose calculated by regis-tration without loop closure.
Ground truth(distance <10m) SE-Loop (t<0.22)
Fig. 11. Ground truth matrix and similarity matrix for Semantic His-tograms. Node numbers on horizontal and vertical axis (173 nodes).
fewer false positives. Specifically, they can identify 6 true positives with zero false positives, while NDT Histograms always give a higher rate of false positives. With the thresh-old of similarity set at 0.09, the plain NDT Histograms correctly recognized 6 loop closures, and gave 261 false pos-itives. For the semantic NDT Histograms, with a similarity threshold of 0.27, 11 loop closures are identified correctly, and the number of false positives is 9. We experimented with different numbers of bins for the NDT Histograms (tested 9,20,40,60 planar, and 5,9,20,40,60 spherical), with no significant difference in the results, as demonstrated in Figure 7 and Figure 8.
The existence of false positives means that the perfor-mance of both methods in global registration is expected to be low. However, if the estimated uncertainty is taken into consideration, then Semantic Histograms can be used for loop closure detection. This is exploited in the SLAM application to search for similar scans only within a radius defined by the accumulated uncertainty of the odometry since the last loop closure.
In Figure 8 the precision-recall curves of different con-figurations show that for a wide range of configuration pa-rameters our method outperforms the NDT Histograms. We also note that KL-divergence outperformed the normalized Euclidean distance that is used in [6] for our descriptor.
TABLE II PARAMETERS&RESULTS
Parameter name SE-NDT Histograms NDT Histograms NDT Resolutions 4.0 m,0.8 m 4.0 m,0.8 m Similarity threshold 0.27 0.09 Map size 80 m 80 m Node spacing 10 m 10 m Correct predictions 11 6 Incorrect predictions 9 261
B. Loop closure validation.
In Figure 9 and Figure 10 we present the path of sequences
00 and 08 as estimated by our algorithm. The NDT His-tograms without semantics were not adequate for the task, and the high rate of false positives resulted in very poor performance in the SLAM task. We do not employ any pose graph optimization, so the path is not corrected between two loop closures, and the KITTI benchmark numerical results do not reflect the improvement. No incorrect predictions were given by our method. As expected, our method followed more closely the true path than the open loop. Towards the end of sequence 00, approximately at (-70,-40), we notice a significant divergence of the path. Investigating the source, we saw that registration did not perform well on the final segment, and coincides with an underestimation of the registration uncertainty, so the loop was recognized but not closed as it was outside the uncertainty radius. The loop corresponding to this point is the rightmost correctly recognized loop from Figure 6. On sequence08, the loop at (110,290) was not identified, possibly due to the brevity of the overlap and the filtering of nodes. While using the loop closure filtering rules, we were able to increase the similarity threshold to 0.35 and still get zero false positives with the Semantic NDT Histograms.
The validation experiments show that the method is ap-plicable in large-scale environments, and can perform loop closures when the paths have high overlap. The addition of an Inertia Measurement Unit (IMU) on the pipeline can potentially benefit the registration with the use of the measurement to rectify the point clouds by compensating for the egomotion. However, since the method is resilient to the initial registration error, the most significant limiting factor for the pose accuracy is the resolution of the map.
Our method, including the classifier, was executed in real time, at 10Hz, on an Intel i7 and an NVidia 1080Ti, and is fully integrated into ROS [24].
V. CONCLUSIONS ANDFUTUREWORK
This work presents a localization and mapping approach based on the Semantic Assisted Normal Distributions Trans-form. The proposed method uses per point semantics, as provided by PointNet++, and we propose an extension of the NDT Histograms of normals that utilizes the semantic labels to estimate the similarity between maps and identify loop closures. In contrast to the original NDT Histograms
where the Euclidean distance is used to compare the scene descriptors, in our work we formulate the distance as the minimization of the KL divergence to account for descriptors that might have high similarity but are not very descriptive, i.e. carry low information.
The overhead of the classifier is kept low by reusing for loop closure detection the same labels as for point cloud registration. The entire semantic mapping pipeline can execute in real-time due to the efficiency of the NDT representation and the use of the PoinNet++ classifier. We also propose a filtering method of the graph, where a node is only inserted for the scenes that maximize the discriminative power of the descriptor, measured by its entropy, or the amount of information that it encodes. In the search for loop closure candidates, the algorithm only considers nodes that are within the uncertainty radius, which is calculated based on the accumulated uncertainty of the previous registrations. With the use of this filtering, the number of false-positive loop closure detections is reduced significantly. We use a graph structure for the representation of the map, where instead of maintaining one map for all the operating envi-ronment the map is incrementally grown with each explored area, and the cells are associated with the first node in the pose graph that they were visible. With this technique, cells in the map can overlap between different crosses of the same path. Due to the representation of the path as a pose-graph any pose-graph optimizer can be applied to the final result.
We evaluate the improvement over the non-semantic ver-sion of NDT Histograms and demonstrate the performance of the complete system on the KITTI dataset. Future work will include fusion of the maps to constrain the size of the map, investigation of how the shape of the objects in the scene affect the performance of the descriptor, integration of a pose graph optimizer and investigation of more flexible approaches to handle cells that contain dynamic objects. This work extends the available toolset for NDT-based mapping and the system is integrated into ROS. The source code and the trained PointNet++ model is released1.
REFERENCES
[1] P. Biber and W. Strasser, “The normal distributions transform: a new approach to laser scan matching,” inProc. IEEE/RSJ Int. Conf. Intelligent Robots and Syst., vol. 3, Oct 2003, pp. 2743–2748. [2] M. Magnusson, A. Lilienthal, and T. Duckett, “Scan registration
for autonomous mining vehicles using 3D-NDT,” J. Field Robotics, vol. 24, no. 10, pp. 803–827, 2007.
[3] A. Zaganidis, M. Magnusson, T. Duckett, and G. Cielniak, “Semantic-assisted 3d normal distributions transform for scan registration in environments with limited structure,” in2017 IEEE/RSJ Int. Conf. on Intelligent Robots and Syst. IEEE, 2017.
[4] A. Zaganidis, L. Sun, T. Duckett, and G. Cielniak, “Integrating deep semantic segmentation into 3-d point cloud registration,”IEEE Robotics and Automation Letters, vol. 3, no. 4, pp. 2942–2949, Oct 2018.
[5] C. R. Qi, H. Su, K. Mo, and L. J. Guibas, “Pointnet: Deep learning on point sets for 3d classification and segmentation,”Proc. Computer Vision and Pattern Recognition (CVPR), IEEE, vol. 1, no. 2, p. 4, 2017.
1https://github.com/azaganidis/se-ndt
[6] M. Magnusson, H. Andreasson, A. N¨uchter, and A. J. Lilienthal, “Automatic appearance-based loop detection from three-dimensional laser data using the normal distributions transform,”J. Field Robotics, vol. 26, no. 11-12, pp. 892–914, Nov 2009.
[7] C. R. Qi, L. Yi, H. Su, and L. J. Guibas, “Pointnet++: Deep hierarchi-cal feature learning on point sets in a metric space,” inAdvances in Neural Information Processing Systems 30, I. Guyon, U. V. Luxburg, S. Bengio, H. Wallach, R. Fergus, S. Vishwanathan, and R. Garnett, Eds. Curran Associates, Inc., 2017, pp. 5099–5108.
[8] Q.-Y. Zhou, J. Park, and V. Koltun, “Fast global registration,” in
European Conference on Computer Vision. Springer, 2016, pp. 766– 782.
[9] R. B. Rusu, N. Blodow, and M. Beetz, “Fast point feature histograms (FPFH) for 3d registration,” in2009 IEEE Int. Conf. on Robotics and Automation, May 2009, pp. 3212–3217.
[10] T. Schmiedel, E. Einhorn, and H. M. Gross, “IRON: A fast interest point descriptor for robust NDT-map matching and its application to robot localization,” inProc. IEEE/RSJ Int. Conf. Intelligent Robots and Syst., Sept 2015, pp. 3144–3151.
[11] H. Yin, L. Tang, X. Ding, Y. Wang, and R. Xiong, “Locnet: Global localization in 3d point clouds for mobile vehicles,” in 2018 IEEE Intelligent Vehicles Symposium (IV), June 2018, pp. 728–733. [12] L. He, X. Wang, and H. Zhang, “M2dp: A novel 3d point cloud
descriptor and its application in loop closure detection,” in 2016 IEEE/RSJ International Conference on Intelligent Robots and Systems (IROS). IEEE, 2016, pp. 231–237.
[13] M. Magnusson, T. P. Kucner, S. G. Shahbandi, H. Andreasson, and A. J. Lilienthal, “Semi-supervised 3d place categorisation by descriptor clustering,” in2017 IEEE/RSJ International Conference on Intelligent Robots and Systems (IROS), Sep. 2017, pp. 620–625.
[14] R. Dub´e, A. Cramariuc, D. Dugas, J. Nieto, R. Siegwart, and C. Ca-dena, “SegMap: 3d segment mapping using data-driven descriptors,” inRobotics: Science and Systems (RSS), 2018.
[15] R. Dub´e, D. Dugas, E. Stumm, J. Nieto, R. Siegwart, and C. Cadena, “Segmatch: Segment based place recognition in 3d point clouds,” in
IEEE International Conference on Robotics and Automation (ICRA). IEEE, 2017, pp. 5266–5272.
[16] E. Einhorn and H. M. Gross, “Generic NDT mapping in dynamic environments and its application for lifelong SLAM,”Robotics and Autonomous Syst., vol. 69, pp. 28–39, 2015.
[17] T. Hackel, N. Savinov, L. Ladicky, J. D. Wegner, K. Schindler, and M. Pollefeys, “Semantic3d.net: A new large-scale point cloud classification benchmark,”ISPRS Annals of Photogrammetry, Remote Sensing and Spatial Information Sciences, vol. IV-1/W1, 04 2017. [18] T. Stoyanov, M. Magnusson, and A. J. Lilienthal, “Point set
registra-tion through minimizaregistra-tion of the L2 distance between 3D-NDT mod-els,” inProc. IEEE Int. Conf. Robotics and Automation, Minnesota, USA, 2012, pp. 5196–5201.
[19] J. Saarinen, H. Andreasson, T. Stoyanov, J. Ala-Luhtala, and A. J. Lilienthal, “Normal Distributions Transform Occupancy Maps: Appli-cation to large-scale online 3D mapping,” inProc. IEEE Int. Conf. Robotics and Automation, 2013, pp. 2233–2238.
[20] D. Adolfsson, S. Lowry, and H. Andreasson, “Improving localisation accuracy using submaps in warehouses,” in IEEE/RSJ Int. Conf. on Intelligent Robots and Systems (IROS), Workshop on Robotics for Logistics in Warehouses and Environments Shared with Humans, Madrid, Spain, October 5, 2018, 2018.
[21] H. Hong, H. Yu, and B. Lee, “Regeneration of normal distributions transform for target lattice based on fusion of truncated gaussian components,” IEEE Robotics and Automation Letters, vol. 4, no. 2, pp. 684–691, April 2019.
[22] T. D. Stoyanov, M. Magnusson, H. Andreasson, and a. Lilienthal, “Fast and Accurate Scan Registration through Minimization of the Distance between Compact 3D NDT Representations,”Int. J. Robotics Research, pp. 1–17, 2012.
[23] A. Geiger, P. Lenz, and R. Urtasun, “Are we ready for autonomous driving? the KITTI vision benchmark suite,” in Proc. IEEE Conf. Comput. Vision and Pattern Recognition, 2012, pp. 3354–3361. [24] M. Quigley, K. Conley, B. Gerkey, J. Faust, T. Foote, J. Leibs,
R. Wheeler, and A. Y. Ng, “Ros: an open-source robot operating system,” inICRA workshop on open source software, vol. 3, no. 3.2. Kobe, Japan, 2009, p. 5.