Final – November 2010
National Needs Analysis:
Life Cycle Costing Data and Tools For
Water Sensitive Urban Design Assets
Prepared for:
WSUD Program,
Sydney Metropolitan Catchment Management Authority.
Prepared by:
André Taylor, Shaun Leinster and Robin Allison.
Document Control Sheet
Report title: National Needs Analysis: Life Cycle Costing Data and Tools For Water Sensitive Urban Design Assets.
Suggested reference: Taylor, A., Leinster, S., and Allison, R. (2010). National Needs Analysis: Life Cycle Costing Data and Tools For Water Sensitive Urban Design Assets. Report for the WSUD Program, Sydney Metropolitan Catchment Management Authority, Sydney. André Taylor Consulting, New South Wales.
Version: Final.
Author(s): Dr André Taylor (André Taylor Consulting), Mr Shaun Leinster (DesignFlow) and Dr Robin Allison (DesignFlow).
Review process: A draft was circulated to industry practitioners in Sydney, Melbourne, Adelaide, Brisbane and Perth for comment in October 2010 via the WSUD Program (Sydney Metropolitan Catchment Management Authority).
Approved by: André Taylor.
Signed:
Date: 9 November 2010.
File name: Final LCC report (9 November 2010).
Distribution: 1 e-copy to Ms Kate Black, WSUD Program, Sydney Metropolitan Catchment Management Authority, Sydney.
Table of Contents
Page
Executive Summary ... iii
1. Introduction ... 1
1.1. Objectives and desired outcomes ... 1
1.2. Target audience of this report ... 1
1.3. Scope and terminology ... 1
1.4. Structure of this report ... 3
2. Background ... 4
2.1. Why the project was undertaken ... 4
2.2. Linkage to a national life cycle costing project ... 4
3. Methodology ... 6
3.1. Overview of the approach ... 6
3.2. Feedback from participants on the workshops ... 7
4. Findings ... 10
4.1. The process of WSUD asset delivery ... 10
4.2. The key stakeholders ... 10
4.3. Drivers and opportunities for change ... 12
4.4. Types of WSUD assets for which LCC data are needed ... 13
4.5. Specific LCC data needs ... 16
4.6. Possible LCC tools to assist practitioners ... 22
4.7. The relative importance of building costing capacity ... 24
4.8. Summary framework ... 26
5. Recommendations ... 29
6. Revised project plan ... 32
Executive Summary
In order to make sound, holistic decisions regarding water sensitive urban design (WSUD) assets, Australian practitioners need access to financial, social and ecological information. Such information includes the likely cost of WSUD assets. This report presents the findings of a national needs analysis that:
Mapped the process that involves the design, construction and maintenance of WSUD assets1.
Identified key stakeholders involved in each stage of this process.
Identified stakeholder needs for life cycle cost (LCC) information and estimation tools.
Prioritised stakeholder needs and benchmarked these priorities against other WSUD-related
capacity building initiatives.
Used the findings of the needs analysis to recommend a set of tasks that would gather LCC
information and build an estimation tool to meet high priority needs of key stakeholders.
The needs analysis involved a series of workshops in Sydney, Melbourne, Adelaide, Perth and Brisbane. These workshops involved a diverse group of industry practitioners who planned, designed, assessed, constructed and maintained WSUD assets (e.g. bioretention systems and stormwater recycling systems). Each workshop involved a series of open questions, group discussions, the completion of worksheets by small groups and an anonymous survey. Feedback from participants on the workshops was strongly positive. On average, participants thought the workshops successfully met their objectives, were well designed and facilitated, and were valuable. Strengths of the workshops included the diversity of participants and the interactive small-group work. Opportunities for improvement included providing more time for discussion.
A two-page summary of the major findings of the need analysis is provided in Figure 6 (see Section 4.8). Findings included:
The process of WSUD asset delivery typically includes three primary stages (i.e. design and
planning, construction and establishment, and maintenance and asset management), as well as 15 secondary stages (see Section 4.1).
A surprisingly diverse range of practitioners are involved in this process and need some LCC
information (see Section 4.2), from strategic planners to maintenance service providers.
Practitioners commonly make decisions regarding 19 different types of WSUD asset (see
Section 4.4). At a national level, there is greatest demand for LCC information regarding rain gardens / bioretention basins, stormwater reuse systems (at scales greater than the lot scale), and constructed wetlands. Some cities also have site-specific costing needs (e.g. the need for costing information relating to swales in Perth).
Whilst the large number and diversity of practitioners with a need for LCC information creates
complexity, there are three broad groups of shareholders with different needs:
1) Technical design specialists (e.g. teams preparing conceptual designs): They require reasonable estimates of all cost elements (e.g. construction and different types of maintenance costs) and the LCC, as well as performance information for WSUD assets (e.g. pollutant removal efficiencies). They use this information to examine „cost-performance relationships‟, using modelling tools like MUSIC. Cost estimates need to allow for a limited number of factors that strongly affect cost (e.g. size, context and service level). In this report, these estimates are called “WSUD cost estimates” (see Section 4.5).
2) High-level decision-makers / planners (e.g. strategic planners): They also need “WSUD cost estimates”, but need to be able to access this information directly (e.g. via a downloadable database) rather than through specialist modelling software. They also need good information about how these costs are spread over time for planning purposes.
1
3) Detailed design, construction and maintenance professionals (e.g. designers, construction project managers and maintenance coordinators): They require more detailed estimates of capital and maintenance costs. Specifically, these elements need to be broken down into typical lists of unit rates / „bills of quantities‟. They also need to be able to access this
information directly. In this report, these estimates are called “WSUD construction rates
estimates” and “WSUD maintenance rates estimates” (see Section 4.5).
Seven possible cost estimation „tools‟ were identified by practitioners (see Section 4.6). This report has recommended one (i.e. a downloadable database linked to a national website) as it is flexible enough to service the vast majority of stakeholders with a need for LCC information. This tool would draw on real costing information across Australia to generate:
o “WSUD cost estimates” (i.e. estimates that could be quickly generated by users such as
conceptual designers and strategic planners). Such estimates would be in a similar form to those currently available via the MUSIC software, but updated and covering a broader range of assets. These estimates would also allow for a range of local factors that can significantly affect cost (e.g. geographic location, development context and service level).
o “WSUD construction rates estimates” (i.e. typical lists of construction items for each
WSUD asset type, and rates for WSUD-specific items that are not currently available in documents like „Rawlinson‟s Australian Construction Handbook‟).
o “WSUD maintenance rates estimates” (i.e. typical lists of maintenance activities and their
frequencies, unit rates, human resource requirements and equipment requirements). These rates would also be linked to a range of factors such as asset size, development context, level of service, geographic location, vegetation type, planting density, etc. The tool would initially be built to provide estimates for asset types with the greatest need (e.g. rain gardens). It would be designed to allow users to enter locally-derived cost information if they did not want to use default values. It would also capture this local information, so future developers of the tool could easily access it (i.e. by simply requesting practitioners to send them a digital copy of the database). A guideline / manual would also be provided that explains how to use the tool, the basis for the estimates, the algorithms embedded in the tool, caveats, limitations and resources for further information. A description of this tool is provided in Sections 4.6a) and 5.
An anonymous survey of workshop participants found that, on average, there was a very strong
need for LCC tools and investment in the development of such tools. In addition, practitioners believed such tools were important for good decision-making and helped to deliver more sustainable solutions. On average, participant ratings for these questions were around 8 on the relevant 1-9 Likert scales (i.e. around 88%). Participants were also asked to indicate the extent to which investing in the development of such tools represents a relatively high capacity building priority. The average participant rating for this question was around 7 on the relevant 1-9 Likert scale (i.e. around 75%).
Recommendations (Section 5) and a project plan (Section 6) have been provided to describe how the findings of the needs analysis could now be used to improve decision making with respect to WSUD assets in Australia. There are some relatively simple steps that can be taken in the short term to make progress, such as establishing a national website to provide WSUD practitioners with easy access to the best available costing information. In the medium to long term, however, the task of building a new, national LCC estimation tool to meet the needs of WSUD practitioners is more challenging. A critical step is to engage a major project sponsor to help provide resources needed to build the proposed LCC tool and to become the long-term „owner‟ of the tool.
1. Introduction
1.1. Objectives and desired outcomes
This report presents the findings of a national needs analysis that aimed to:
Map the process that involves the design, approval, construction and maintenance of water
sensitive urban design (WSUD) assets.
Identify key stakeholders involved in each stage of the process.
Identify stakeholder needs for life cycle cost (LCC) data and estimation tools.
Prioritise stakeholder needs and benchmark these priorities against other WSUD-related
capacity building initiatives.
The report also uses the findings of the needs analysis to recommend a set of tasks that would gather LCC information and build the tools necessary to meet high priority needs of key stakeholders.
Outcomes from this work include a deeper understanding of the key stakeholders who are making decisions regarding WSUD assets in Australia and their specific needs for costing information and estimation tools. Another outcome is a revised „project plan‟ (Section 6) to help guide a national WSUD life cycle costing project (see Section 2.2).
1.2. Target audience of this report
This report has been written for three audiences. First, it has been prepared for the Steering Group of a national project that aims to provide WSUD practitioners with better costing information and estimation tools in order to make more informed decisions regarding WSUD assets. This group was initiated by the WSUD Program (Sydney Metropolitan Catchment Management Association) at a workshop in November 2009. This group currently includes several WSUD capacity building programs, industry representatives (e.g. the City of Sydney), eWater Pty Ltd, and specialist consulting businesses.
Second, it aims to provide potential funding organisations (e.g. government agencies) with detailed information regarding the needs of stakeholders for specific types of LCC information and tools, the tasks needed to address these needs, and the approximate cost of undertaking these tasks. In short, it provides an information base that could be used during future funding requests and grant applications.
Third, it provides broad guidance to people who may, in the future, be asked to deliver the tasks needed to fill critical knowledge gaps with respect to LCC information and build new cost estimation tools.
1.3. Scope and terminology
Due to budget limitations, the scope of the needs analysis was restricted to the stormwater treatment
and recycling component of WSUD. As such, it focussed on costing needs commonly associated with assets such as rain gardens / bioretention systems, stormwater harvesting systems and constructed wetlands. In addition, the project‟s budget allowed face-to-face consultation with WSUD practitioners to occur in five capital cities (i.e. Sydney, Melbourne, Adelaide, Perth and Brisbane). The identified needs therefore reflect the views of practitioners in these cities.
It is also acknowledged that decisions involving WSUD assets are informed by many inputs, which include costs. Increasingly, decisions are made using triple-bottom-line assessment frameworks where the social, ecological and financial pros and cons of various water management options are
considered (see Taylor, 2005). The focus of the needs analysis, however, was limited to stakeholder
needs regarding the various financial costs of common WSUD assets. Consequently, the new LCC
cost estimation tool that is recommended in this report (see Section 5) would only help practitioners
with one component of a triple-bottom-line assessment process. That is, the financial costs
associated with constructing, maintaining and replacing / decommissioning WSUD assets.
Water sensitive urban design
The following definition of WSUD was adopted throughout the project: WSUD is a planning and design approach that addresses the impacts of urban development on the hydrological cycle and aquatic ecosystem health. It aims to:
minimise the impact on existing natural features and ecological processes in and around
waterways (e.g. through the reduction of pollutants entering waterways);
minimise the impact on the natural hydrologic behaviour of catchments;
protect the quality of surface and ground waters;
minimise the demand on the reticulated water supply system;
incorporate the collection, treatment and/or reuse of runoff, including roof water and other forms
of stormwater / runoff;
reduce runoff volumes and peak flows from urban development;
re-use treated effluent and minimise wastewater generation;
increase social amenity in urban areas through multi-purpose greenspace, landscaping and
integrating water into the landscape;
add value to urban developments while minimising development costs (e.g. drainage
infrastructure costs);
account for the nexus between water use and wider social and environmental issues (e.g.
global warming); and
harmonise water cycle practices across and within the institutions responsible for waterway
health, flood management, pollution prevention and protection of social amenity. (Modified from: Water by Design [2009].)
In the context of stormwater management, the primary aim of WSUD is to:
treat stormwater to remove pollutants;
manage stormwater hydrology to protect downstream aquatic ecosystems; and
reuse stormwater (including roof water) to reduce the demand on the reticulated water supply
system.
Life cycle costing terms
The needs analysis sought to be consistent with respect to the terms used to describe different types of costs. Firstly, life cycle costing was defined as a “process to determine the sum of all expenses associated with a product or project, including acquisition, installation, operation, maintenance, refurbishment, discarding and disposal costs” (Australian Standards, 1999, p. 4) .
The life cycle cost (LCC) of an asset is the sum of all discounted costs over an asset‟s life (similar to a „net present value‟). These costs are typically broken down into the following „cost elements‟:
Total acquisition cost (TAC) / capital: This typically includes all design costs, project
Typical annual maintenance (TAM) cost / routine maintenance: This includes frequent maintenance activities, such as mowing a grassed swale. These maintenance costs may be elevated in the first few years of vegetated WSUD assets, such as constructed wetlands.
Renewal and adaptation cost (RC) / corrective maintenance: This includes infrequent
maintenance activities, such as replacing the media in a bioretention system and replanting it. Practitioners also need to know the frequency that this cost is likely to be incurred.
Decommissioning cost (DC) / disposal cost: This is the cost of removing the asset and returning
the site to its original condition. It may be incurred for some stormwater treatment / reuse assets (e.g. gross pollutant traps or assets that cannot be maintained).
In addition, to undertake life cycle costing, practitioners need to know a „real discount rate‟ (so costs that are incurred in the future can be discounted back to a „base date‟) and the „life cycle / span‟ (LC) of various WSUD assets (see Taylor, 2003).
1.4. Structure of this report
The next section of this report describes the background to the needs analysis and how it is connected to a national project to help WSUD practitioners to gain access to better LCC information and tools in order to improve decision-making. The report then describes the methodology used for the needs analysis and summarises feedback from practitioners on the workshops that were completed in each city. It then presents key findings with a summary presented in Section 4.8. These findings reflect the views of leading practitioners in five cities. Consequently, the report highlights national stakeholder needs as well as those that were significant within particular cities / regions. A set of recommendations is then presented which responds to the key findings. Finally, a revised version of the draft project plan that was prepared following a planning workshop in November 2009 (see Taylor, 2010) is provided. This plan describes the tasks that could be undertaken to continue the process of improving the costing information and tools that are available to WSUD practitioners across Australia.
2. Background
2.1. Why the project was undertaken
Research at the national and regional level across Australia over the last decade has consistently identified that inadequate LCC information and tools are significant barriers to the adoption of WSUD (see Lloyd , 2001; Lloyd et al., 2002; Colmar Brunton, 2005; Taylor & Fletcher, 2007; Wong, 2001). Some attempts have been made to overcome this barrier (see Taylor, 2010), such as the inclusion of
a LCC module in versions 3 and 4 of the MUSIC model (see www.toolkit.net.au), and the collation of
real costs associated with WSUD assets in various cities. These attempts, however, have not:
Fully identified the different needs of stakeholders who are involved in the design, approval, construction, operation and maintenance aspects of WSUD assets.
Provided all of these stakeholders with easily accessible, reliable, up-to-date LCC data and
estimation tools that meet their specific needs. For example, the LCC module in MUSIC currently uses costing data that was gathered from around Australia in 2003-4. At that time, reliable costing data was sparse, and since then the design of many WSUD assets has evolved. In addition, MUSIC is typically used in the conceptual design phase of the process that delivers on-ground WSUD assets, so this tool is not often used by construction, maintenance, planning or asset management professionals.
Previous projects involving the collection and analysis of LCC data has found that this work can be time-consuming and limited by poor record-keeping in relation to the various costs of WSUD assets. As such, future attempts to gather costing information should learn from these experiences and identify the most cost-effective ways of collecting data. To do this, detailed knowledge is needed of: the various stakeholders who need LCC information; and their specific needs for information and estimation tools. This is the primary purpose of the national needs analysis.
2.2. Linkage to a national life cycle costing project
On 23 November 2009, a workshop was convened by the „WSUD Program‟ capacity building program (Sydney Metropolitan Catchment Management Authority) that involved representatives from the Victorian „Clearwater‟ program, the Queensland „Water by Design‟ program, the eWater CRC, Landcom and the City of Sydney, as well as specialist consultants. The primary aims of this workshop were to:
Consider and critically review options to address this barrier to the adoption of WSUD from a national perspective.
Design an initiative with a national focus that would provide stakeholders with the LCC
information and tools they need to make critical decisions about WSUD assets.
Build a draft „project plan‟ for this initiative that defines the necessary tasks, timeframes and resources, as well as clarifying who is responsible for delivering funded tasks.
Pool resources to begin work on the initiative.
The workshop produced a draft project plan (see Taylor, 2010), and funds were secured to begin Task 1 (the needs analysis). The following stakeholder groups provided funding for this task:
The „WSUD Program‟, Sydney Metropolitan Catchment Management Authority.
The „Clearwater‟ capacity building program, Victoria.
The „New Waterways‟ capacity building program, Western Australia.
The „Water by Design‟ capacity building program, Queensland.
The South Australian government, via the South Australian Murray-Darling Basin Natural
At the November 2009 workshop, it was agreed that the project partners („Steering Group‟) would meet again after that needs analysis task was complete. The Sydney Metropolitan Catchment Management Authority agreed to convene this meeting. Its purpose would be to “review the outcomes of the needs analysis, review available funding and revise the project plan” (Taylor, 20010, p. 3).
3. Methodology
3.1. Overview of the approach
The needs analysis involved five steps. First, a series of five workshops were planned and designed to gather information from a diverse group of WSUD practitioners in Sydney, Melbourne, Adelaide, Perth and Brisbane. The primary aim of these workshops was to identify the LCC data and tools that are needed to make decisions regarding WSUD assets. More specifically, they aimed to:
Identify and reach agreement on the stages that WSUD assets typically move through, from
conceptual design to ongoing maintenance.
Identify the groups of practitioners who need costing data for WSUD assets during each stage.
Characterise the WSUD LCC data needs within each stage (i.e. the type of data that will satisfy
key practitioners and the form such data needs to be in).
Understand the „tools‟ that could be developed to address identified costing needs (e.g.
spreadsheets and models to help estimate costs).
A critical element of the workshop design was ensuring a diverse range of practitioners were involved. Specifically, each workshop sought to engage one or two experienced practitioners from each of the following stakeholder categories:
People who undertake planning / policy activities in relation to WSUD assets.
People who design WSUD assets.
People who undertake development assessment activities for WSUD assets.
People who construct WSUD assets or manage the construction process.
People who plan and/or undertake maintenance activities for WSUD assets.
People who undertake asset management activities for WSUD assets (e.g. strategic asset
planning).
The first workshop in Sydney was used to trial and refine the process of gathering the necessary information from WSUD practitioners. As such, it was four hours long, whilst the remaining workshops were only three hours long. The workshops were kept as short as possible to enable the participation of busy people and reduce the project‟s overall cost.
The workshop‟s design enabled interaction between the participants, discussion as one group (typically around 10 participants) and discussion within small groups (typically around three to five participants). The core of the workshops involved small group work. Groups where formed to represent major stages in the WSUD asset delivery process (e.g. design and planning; construction and establishment; and maintenance and asset management). These groups worked through a series of worksheets to discuss and document their views on a range of questions relating directly to the aims of the workshop.
Second, invitations were prepared for each workshop and the local host organisation (i.e. the organisations helping to fund the project) invited suitable participants. Each host organisation was provided with a description of the „ideal participants‟ to assist the invitation process.
Third, the workshops were facilitated by members of the consulting team (i.e. Dr Robin Allison and Shaun Leinster from DesignFlow, and Grahame Collier from T Issues Consultancy). The primary product from each workshop was a set of completed worksheets from each small group. Feedback from participants was also gathered after each workshop using paper-based and on-line feedback forms. This feedback helped to refine the workshop process, and gather additional information. For
example, it gathered information on the relative importance participants placed on addressing cost-related barriers to the adoption of WSUD compared to other capacity building activities (see Section 4.7).
Fourth, data from each workshop were organised, condensed and analysed. A conceptual framework (see Section 4.8) was also used to structure and highlight key findings. The findings from each workshop were used to formulate a set of recommendations and a revised project plan which represent a set of actions to cost-effectively address high priority LCC-related stakeholder needs.
Fifth, a draft report was prepared and circulated to the five funding organisations, as well as all participants at the November 2009 workshop (i.e. members of the „Steering Group‟ for the national initiative). Following consultation, the final report was prepared.
3.2. Feedback from participants on the workshops
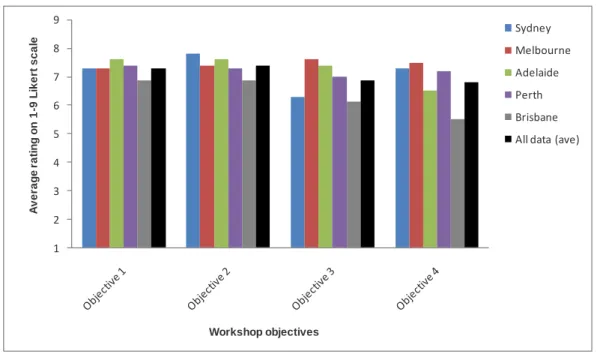
Participants at the five workshops were asked to rate the extent to which their workshop met its key objectives using a 1 to 9 Likert scale (1 = “very poor”; 9 = “excellent”). Figure 1 presents average ratings from participants at each of the workshops, plus an overall average for all workshops. These data indicate that participants, on average, thought that the extent to which the workshops met their objectives was “good” (i.e. around 7 on the scale).
1 2 3 4 5 6 7 8 9 A v e ra g e r a ti n g o n 1 -9 L ik e rt s c a le Workshop objectives Sydney Melbourne Adelaide Perth Brisbane All data (ave)
Figure 1 – The extent to which the workshops met their objectives
Legend:
Objective 1 = To identify and reach agreement on the stages that WSUD assets typically move through from conceptual design to ongoing maintenance.
Objective 2 = To identify the groups of practitioners who need costing data for WSUD assets at each stage.
Objective 3 = To identify the WSUD life cycle costing data needs within each stage (i.e. data that will satisfy key practitioners). Objective 4 = To propose „tools‟ to address identified costing needs, including a description of the tools‟ design features.
There were some relatively low ratings at three of the workshops (see Figure 1). The relatively low score for objective number 3 in Sydney (6.3) was a result of a problem with the relevant worksheet, which was rectified in subsequent workshops. The relatively low score for objective number 4 in Adelaide (6.5) was due to the group running out of time towards the end of the workshop when the possible cost estimation tools were discussed. In addition, the relatively low ratings for objectives number 3 (6.1) and 4 (5.5) in Brisbane were due to running out of time towards the end of the
workshop and possibly the smaller, less diverse group making the discussion of needs and tools less satisfying for participants.2
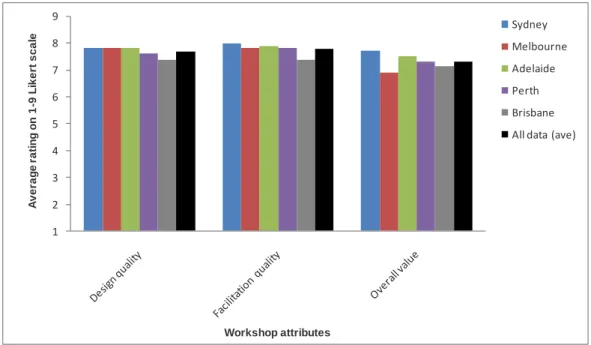
Participants were also asked to rate the quality of their workshop‟s design, the quality of its facilitation, and the overall value of the workshop using the same 1 to 9 Likert scale. Figure 2 presents average ratings. These data indicate that participant ratings for the quality of the workshop‟s design and facilitation were consistently high, around the 7 to 8 range (i.e. between “good” and “excellent”). Ratings for overall value were slightly lower, being around 7 (“good”), with Sydney being considered the most valuable. The slightly higher rating in Sydney is likely to be the result of this workshop being an hour longer than the subsequent workshops.
1 2 3 4 5 6 7 8 9 A v e ra g e r a ti n g o n 1 -9 L ik e rt s c a le Workshop attributes Sydney Melbourne Adelaide Perth Brisbane All data (ave)
Figure 2 – The quality of the workshop‟s design and facilitation, as well as its overall value
Legend:
Design quality = How would you rate the quality of the workshop‟s design (e.g. structure, timing, opportunity to participate, etc.)? Facilitation quality = Overall, how would you rate the quality of the facilitation of the whole workshop?
Overall value = How you would rate the over-all value of the workshop?
Participants were also asked to indicate what they thought were the strengths of the workshop, as well as areas for improvement (weaknesses). Repeatedly mentioned strengths and weaknesses are
summarised in Tables 1 and 2, respectively3. The most commonly mentioned positive features of the
workshops were the highly diverse nature of participants, and the opportunity to interact and discuss issues (particularly during small-group work). The most significant opportunities for improvement were providing more time (particularly in Sydney and Adelaide) and inviting a broader range of stakeholders. There was no opportunity for improvement that was repeatedly highlighted by
2 The participants in Brisbane may have also been suffering from “consultation fatigue” as a significant body of work had been
done in the preceding year regarding WSUD maintenance and asset management practices (see www.waterbydesign.com.au).
The ratings in Brisbane may also have been affected by the view that cost information and tools are unlikely to greatly accelerate the adoption of WSUD in parts of South East Queensland as WSUD is now required on private sector
developments. The participants in Brisbane were also surveyed via an on-line instrument which was conducted a week after
the workshop. This was done as time constraints made the administration of a paper-based survey at the end of the workshop impractical. The lag between the workshop and the on-line survey may have also affected the results for Brisbane.
3
Only strengths / weaknesses that were repeatedly mentioned at each workshop have been considered to filter out minor and/or trivial comments.
participants at all workshops, indicating there was no fundamental flaw in the design or delivery of these events.
Table 1 – Major strengths of the workshops Strengths repeatedly mentioned at the
workshops
Sydney Melbourne Adelaide Perth Brisbane All data
Having a diverse group (i.e. a cross-section of industry).
- 4 4 4 - 12
Interactive small-group work. 2 3 4 - 1 10
Discussing common issues and sharing views / information.
3 3 - - 3 9
Identifying the information needs and possible tools.
2 - - 2 1 5
Networking with fellow practitioners. 2 - - - 2 4
Facilitation. - - 3 - - 3
The workshop‟s design / structure. 2 - - - - 2
Having „roving experts‟ and worksheets. 2 - - - - 2
Note: The numbers in this table indicate the number of participants who mentioned each issue. Data reflect strengths that were mentioned by more than one person at each workshop.
Table 2 – Major opportunities for improvement with respect to the workshops Opportunities repeatedly mentioned at
the workshops
Sydney Melbourne Adelaide Perth Brisbane All data
Could have taken more time. 2 - 3 - - 5
Could have invited a broader range of stakeholders.
- - 2 - 2 4
Could have provided more background information before the workshop.
- - 3 - - 3
Could have provided more opportunities to share knowledge across the small groups.
- 2 - - - 2
Note: The numbers in this table indicate the number of participants who mentioned each issue. Data reflect opportunities that were mentioned by more than one person at each workshop.
4. Findings
4.1. The process of WSUD asset delivery
At each workshop, participants provided feedback on the typical stages in the process of WSUD asset
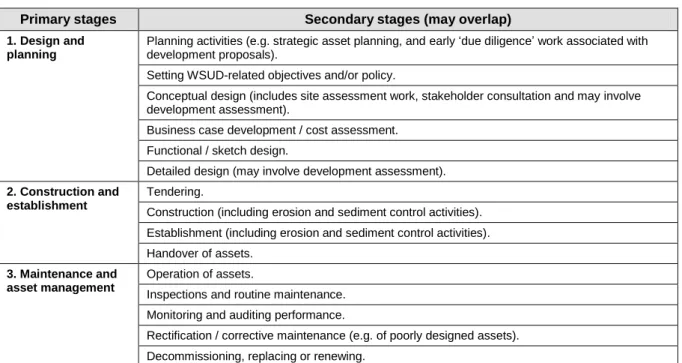
delivery. The stages are summarised in Table 3. Note that some of the secondary stages in Table 3 overlap. There was a high degree of consistency in these stages across the five cities. The only significant difference was that in some cities (e.g. Brisbane) there was a stronger emphasis on including erosion and sediment control (ESC) activities in the process, as there can be significant costs associated with this part of the construction and establishment stage.
Table 3 – Typical stages within the WSUD asset delivery process Primary stages Secondary stages (may overlap) 1. Design and
planning
Planning activities (e.g. strategic asset planning, and early „due diligence‟ work associated with development proposals).
Setting WSUD-related objectives and/or policy.
Conceptual design (includes site assessment work, stakeholder consultation and may involve development assessment).
Business case development / cost assessment. Functional / sketch design.
Detailed design (may involve development assessment).
2. Construction and establishment
Tendering.
Construction (including erosion and sediment control activities). Establishment (including erosion and sediment control activities). Handover of assets.
3. Maintenance and asset management
Operation of assets.
Inspections and routine maintenance. Monitoring and auditing performance.
Rectification / corrective maintenance (e.g. of poorly designed assets). Decommissioning, replacing or renewing.
4.2. The key stakeholders
Table 4 provides a summary of the key stakeholders involved in the three primary stages of the WSUD asset delivery process. Table 4 also indicates which stakeholders particularly need good LCC information and/or tools.
Table 4 – Key stakeholders typically involved in the WSUD asset delivery process
Design & planning stage Construction & establishment stage Maintenance & asset management stage
Private sector designers /
consultants (incl. engineers, planners, landscape architects, urban designers, ecologists, surveyors, horticulturalists, soil scientists). (S), (M), (A), (P), (B)
Specifically, design and subdivision
engineers - civil, hydraulic and environmental (private and public sector). (M), (P), (B)
Financial officers / economists /
property economists. (S), (A), (B)
DA (development assessment)
Developers / asset owners (public
and private). (S), (A), (P)
Designers (including consulting
engineers) (e.g. at handover stage). (S), (P)
Project managers. (S)
Site superintendents / supervisors
(private and public sector). (M)
Contractors (civil and landscape).
(A)
Private certifiers and council
compliance officers. (P)
Asset planners / managers /
engineers / owners. (S), (A), (B)
Financial managers, staff and
planners. (A), (B), (S)
Maintenance crews / service
providers (staff and contractors) – bush regeneration, landscape / open space, drainage, waste / cleaning / sweeping and irrigation. (S), (B)
Risk managers. (S), (P)
Design & planning stage Construction & establishment stage Maintenance & asset management stage
staff, typically in local government agencies (may also involve compliance officers). (S), (B)
Developers / owners / builders.
(M), (A)
Local government project sponsors
/ managers. (M), (P)
Business development managers
(private and public sector). (M), (B)
Strategic and land use / town
planners. (S)
Water-related policy and planning
staff in government agencies / water agencies. (S)
Project managers (private sector).
(B)
Asset managers / planners
(ultimate asset owners). (A)
Boards and staff of publicly owned
development organisations. (M)
Local government councillors /
politicians. (M)
Peak industry bodies (e.g. UDIA).
(A)
Executives (e.g. in local
government agencies).
Private sector marketing
specialists.
Infrastructure Developer
Contribution officers (local government).
Community consultation
specialists.
Asset managers. (M)
A wide variety of council staff (e.g.
engineers (A), contract managers, supervisors, landscape architects, planners and environmental managers).
State agencies / water agencies.
Suppliers of materials (e.g. plants
and soil).
Development managers (private
sector).
Council maintenance staff.
Engineering surveyors.
Quantity surveyors.
Geotechnical specialists.
Hydrologists.
Natural Resource Management
boards.
People contributing finance to the
project.
Community (e.g. school groups
involved with wetland planting).
Some others (miscellaneous):
traffic engineers, residents, plumbers, service providers (e.g. Telstra), etc.
managers. (A)
Environmental managers,
environmental health officers, parks maintenance coordinators and roads and drainage coordinators / engineers. (P)
Horticultural service managers. (A)
Capital works planners / engineers
/ project managers (e.g. for corrective maintenance). (B)
Senior staff in local government
agencies. (B)
Contract managers and
administration officers.
Landscape architects /
coordinators.
Specialist consultants (e.g. to
troubleshoot problems).
Asset inspectors.
The community (including local
community groups).
(S), (M), (A), (P), (B) = these stakeholders “particularly need LCC data / tools” in Sydney, Melbourne, Adelaide, Perth and Brisbane, respectively.
The information provided the Table 4 indicates that a very wide variety of stakeholders are involved in each of the three primary stages of the asset delivery process. In addition, a significant portion of the stakeholders have a significant need for good costing information and tools, particularly in the „design and planning‟ stage. This finding highlights that LCC tools will need to be flexible enough to service a wide variety of stakeholders.
The data in Table 4 also indicates that there are some key stakeholder groups in each stage that were nominated in more than one workshop as having a significant need for LCC information and tools. For the „design and planning‟ stage, the most strongly nominated stakeholders were:
private sector designers / consultants (i.e. members of multi-disciplinary design teams), and
more specifically, design and subdivision engineers (civil, hydraulic and environmental);
financial officers and economists;
development assessment (DA) officers;
developers, owners and builders;
local government project sponsors / managers; and
business development managers.
For the „construction and establishment‟ stage, developers, designers and asset owners (private and
planners, managers, engineers and owners were highlighted, along with financial managers and planners, maintenance service providers and risk managers.
4.3. Drivers and opportunities for change
During the longer workshop in Sydney, the opportunity was taken to briefly explore drivers and opportunities. In this context, „drivers‟ are the factors that are creating or building the need for good LCC information and tools (e.g. statutory requirements for 10 year asset management plans to be prepared in NSW local government agencies). „Opportunities‟ are circumstances that could be used to
improve the use of WSUD costing information and tools (e.g. asset management „crises‟ that are
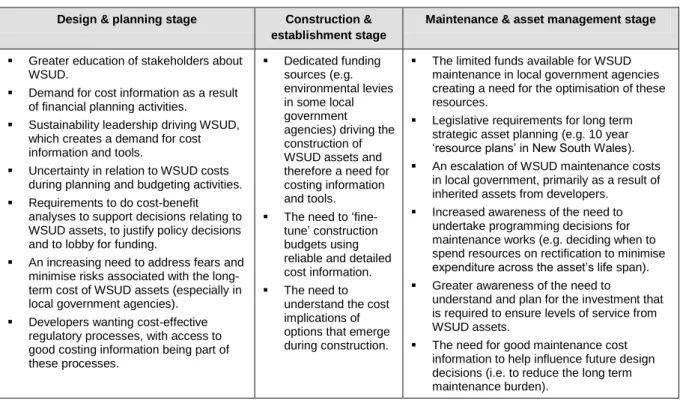
occurring in some local government agencies). The information collected from workshop participants is summarised in Tables 5 and 6.
Table 5 – Drivers to improve the use of WSUD costing information and tools Design & planning stage Construction &
establishment stage
Maintenance & asset management stage
Greater education of stakeholders about
WSUD.
Demand for cost information as a result
of financial planning activities.
Sustainability leadership driving WSUD,
which creates a demand for cost information and tools.
Uncertainty in relation to WSUD costs
during planning and budgeting activities.
Requirements to do cost-benefit
analyses to support decisions relating to WSUD assets, to justify policy decisions and to lobby for funding.
An increasing need to address fears and
minimise risks associated with the long-term cost of WSUD assets (especially in local government agencies).
Developers wanting cost-effective
regulatory processes, with access to good costing information being part of these processes. Dedicated funding sources (e.g. environmental levies in some local government agencies) driving the construction of WSUD assets and therefore a need for costing information and tools.
The need to
„fine-tune‟ construction budgets using reliable and detailed cost information.
The need to
understand the cost implications of options that emerge during construction.
The limited funds available for WSUD
maintenance in local government agencies creating a need for the optimisation of these resources.
Legislative requirements for long term
strategic asset planning (e.g. 10 year „resource plans‟ in New South Wales).
An escalation of WSUD maintenance costs
in local government, primarily as a result of inherited assets from developers.
Increased awareness of the need to
undertake programming decisions for maintenance works (e.g. deciding when to spend resources on rectification to minimise expenditure across the asset‟s life span).
Greater awareness of the need to
understand and plan for the investment that is required to ensure levels of service from WSUD assets.
The need for good maintenance cost
information to help influence future design decisions (i.e. to reduce the long term maintenance burden).
The drivers in Table 5 are numerous and some of them are significant. For example the legislative driver that requires local government agencies in New South Wales to prepare detailed 10-year strategic asset management plans creates a significant demand for reliable costing information and estimation tools. Other drivers relate to fears, risks and „crises‟ concerning the financial sustainability of WSUD assets that are maintained by local government agencies. In addition, increasing sustainability leadership, the accelerating delivery of WSUD assets, and the increasing need to better justify investing in WSUD assets are acting as drivers.
Table 6 – Opportunities to improve the use of WSUD costing information and tools Design & planning stage Construction &
establishment stage
Maintenance & asset management stage
Planning instruments provide an opportunity to require
developers to consider and provide LCC information.
Legislative instruments that require sound, long term
financial / asset management planning.
An increasing awareness of the need to better manage
natural assets.
Greater recognition of the true value of water creating
new opportunities for some WSUD assets.
Greater community interest, awareness and
willingness to pay for environmental protection (e.g. via local government environmental levies).
Commitments by major developers to sustainable
development.
As more WSUD assets
are constructed, the knowledge of the industry builds, and the need for good LCC information and tools also increases.
Where Councils have
environment levies, good costing information is needed to justify council-funded WSUD assets and to meet reporting requirements.
Asset management
„crises‟, particularly in local government agencies, create an opportunity to improve financial planning in relation to WSUD assets.
Training activities create
an opportunity to build understanding of life cycle costing and the use of costing tools. (Applies to all stages.)
Most of the „windows of opportunities‟ in Table 5 are likely to be open for some time, such as opportunities created through growing community interest and awareness. More transient opportunities relate to legislative instruments (e.g. requirements to undertake long-term asset management planning in NSW) and the potential to connect new LCC tools to relevant types of training (e.g. training around Australia on the „Construction and Establishment of Vegetated
Stormwater Systems‟4
).
Overall, the information in Tables 4 and 5 indicate that numerous drivers are building demand for, and creating opportunities to use, good LCC information and tools in order to make better decisions about WSUD assets. It is suggested that the majority of the drivers will be sustained or build in intensity in the foreseeable future (i.e. in the next 5-10 years). This suggests that early investment in gathering LCC information and providing practitioners with cost estimation tools is warranted.
4.4. Types of WSUD assets for which LCC data are needed
During each workshop, participants brainstormed the types of WSUD assets they were involved with, and then highlighted which ones particularly needed good costing information. The asset types practitioners were involved with are listed in Table 7. The information in this table indicates that a large number of WSUD asset types are being managed across Australia; especially considering some of these categories have many sub-categories (e.g. gross pollutant traps). This information also highlights that stormwater reuse assets are now a significant part of WSUD. It also indicates that some, but not many, asset types are more common in particular regions of Australia (e.g. the use of soil amendment in Perth).
4
Table 7 – The types of WSUD assets that workshop participants managed
WSUD asset type Sydney Melbourne Adelaide Perth Brisbane
Rain gardens / bioretention basins (incl. tree systems, street and regional systems, and those with or without a saturated zone).
√ √ √ √ √
Stormwater reuse systems (3 parts):
a) Stormwater harvesting storage – tanks, ponds and lakes.
√ √ √ √ √
b) Stormwater harvesting post-storage treatment systems (includes control and monitoring systems).
√ √ √
c) Stormwater recycling pump and irrigation systems (including subsurface irrigation and private
reticulation).
√ √ √ √
Stormwater harvesting systems – roof water only. √ √ √
Constructed wetlands. √ √ √ √ √
Swales (with or without a bioretention component). √ √ √ √ √
Rehabilitated channels / natural channel designs / living streams.
√ √ √ √
Gross pollutant traps: proprietary systems, floating booms, end of pipe nets and pit liners / traps.
√ √ √ √ √
Detention basins (wet and dry). √ √ √
Infiltration systems – basins and pits. √ √ √ √
Sand filters. √ √
Paving – permeable, porous. √ √ √ √
Aquifer storage and recovery systems. √ √ √
Vegetated buffers, filter strips and riparian vegetation zones.
√ √ √ √
Sediment basins. √ √ √ √
Diversion structures. √ √ √ √
Green roofs and walls. √ √ √
Media filtration / cartridge filtration systems. √ √ √
Erosion and sediment control during the construction phase.
√ √
Soil amendment (to bind nutrients) and sub-soil drainage in sandy, low lying areas.
√ √ = mentioned by workshop participants as being relevant to their work.
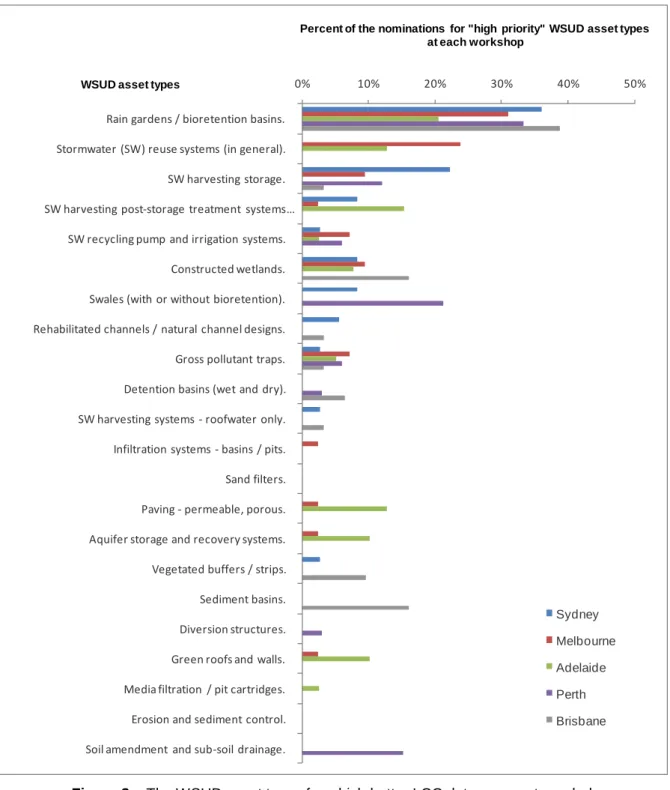
Each workshop participant was given three nominations / votes to highlight specific WSUD asset types for which good LCC information was most needed. The nomination data are plotted in Figure 3.
0% 10% 20% 30% 40% 50%
Rain gardens / bioretention basins.
Stormwater (SW) reuse systems (in general).
SW harvesting storage.
SW harvesting post-storage treatment systems …
SW recycling pump and irrigation systems.
Constructed wetlands.
Swales (with or without bioretention).
Rehabilitated channels / natural channel designs.
Gross pollutant traps.
Detention basins (wet and dry).
SW harvesting systems - roofwater only.
Infiltration systems - basins / pits.
Sand filters.
Paving - permeable, porous.
Aquifer storage and recovery systems.
Vegetated buffers / strips.
Sediment basins.
Diversion structures.
Green roofs and walls.
Media filtration / pit cartridges.
Erosion and sediment control.
Soil amendment and sub-soil drainage.
Sydney Melbourne Adelaide Perth Brisbane Percent of the nominations for "high priority" WSUD asset types
at each workshop
WSUD asset types
Figure 3 – The WSUD asset types for which better LCC data are most needed
The data in Figure 3 indicate that at a national level, there is a strong need for better LCC information
relating to:
Stormwater reuse systems larger than the lot scale (incl. storage, treatment, pump and irrigation / reticulation, and monitoring elements).
Constructed wetlands5.
Whilst at a regional level, a number of significant local costing needs also exist. For example, there is
a need for better costing information relating to:
Swales (with or without bioretention components) in Perth.
Permeable and porous paving, and aquifers storage and recovery systems in Adelaide.
Sediment basins in Brisbane.
4.5. Specific LCC data needs
The workshops produced a large amount of detailed information on the LCC needs of various
stakeholders. This section presents a synthesis of key findings and commonly expressed views.
Tables 8, 9 and 10 summarise the specific needs of key stakeholder groups involved with the design and planning, construction and establishment, and maintenance and asset management stages, respectively.
Overall, the information in these three tables indicates there are three broad groups of stakeholders with different LCC needs. First, some stakeholders, such as technical specialist developing conceptual designs, need information that allows them to generate reasonable estimates of cost elements (e.g. TAC, TAM, RC and DC) and life cycle cost (LCC) in a form that allows them to
examine „cost-performance relationships‟. Currently, this group of stakeholders use tools such as
MUSIC to do this6. They may also use size – cost relationships they have developed through their
own project work (e.g. $/m2 rates for TAC for different types of WSUD assets). Ideally, this group of
stakeholders would be able to quickly generate cost estimates that allow for a limited range of factors that can significantly affect cost (e.g. the development context, level of service, design, geographic
location). This report refers to these types of estimates as “WSUD cost estimates”.
Second, other stakeholders, such as strategic planners, also need to be able to generate “WSUD cost estimates” but need to be able to access this information directly, rather than through design tools like MUSIC. These stakeholders also need to know when costs are incurred over time (e.g. for financial and asset planning).
Third, other stakeholders, such as maintenance coordinators, designers and construction managers, need cost elements (e.g. TAC and TAM) to be broken down into lists of unit rates / „bills of quantities‟. These stakeholders also need to be able to access this information directly (e.g. through a downloadable spreadsheet or database). They currently have access to unit rates for common construction activities but limited information on WSUD-specific construction costs (e.g. bioretention filter media) and maintenance costs.
More specifically, construction practitioners need a typical list of cost items for each WSUD asset type, as well as rates for WSUD-specific items that are not available in documents like „Rawlinson‟s Australian Construction Handbook‟. This report refers to this type of cost information as “WSUD construction rates estimates”.
5
It is acknowledged that workshop participants indicated there is little need for good LCC information for constructed wetlands in Perth at present.
6
Maintenance practitioners need to know typical maintenance activities, unit rates for these activities, as well as information on the frequency of various maintenance activities, the human resources needed for these activities, and the plant / equipment requirements. They also need to be able to generate estimates that allow for a range of factors that affect cost such as the development context (e.g. greenfield vs. retrofit), size, level of service, geographic location, design, season, vegetation type, etc. For vegetated assets, they also need to know how maintenance cost elements (e.g. TAM) and the cost of various activities (e.g. weed control) vary over the asset‟s life. This report refers to this
Table 8 – The LCC data needs of key stakeholders during the „design and planning‟ stage Stakeholders The type of cost information / data
they need
The degree of confidence they need in the data
(High / Medium / Low)
The form the data needs to be in Other important WSUD asset information / data needs
Technical practitioners and managers: developer consultants; designers; DA officers; development managers; and project managers.
Estimates of all cost elements (TAC, TAM, RC and DC) and LCC. Detailed breakdown of these cost elements (e.g. for rain gardens: planting costs, media costs, drainage, etc.).
L-M (conceptual / functional design)
H (detailed design)
Conceptual / functional design: broad estimates of cost elements (e.g. TAC, TAM, etc.) per size descriptor (e.g.
KL, m2). Similar to the MUSIC model‟s LCC module but
also allowing for major factors that can affect cost (e.g. development context, location, service level). Where relevant, cost elements should also be linked to particular events (e.g. TAM broken down into the cost per
maintenance event). Also, TAC needs to be broken down (e.g. to allow the design costs to be removed).
Detailed design: unit rate breakdown for all major cost elements (e.g. not just the „TAC‟ estimate for rain gardens, but how this cost element is typically broken down into costs for soil, plants, drainage, etc.). In other words, create a “bill of quantities” for the stages of construction. Cost information that can be used to examine the relationship between cost and performance (e.g. $ per kg of N/P removed over the asset‟s life).
Note: In general, all cost estimates may need to be linked to at least the following factors:
Development context: greenfield / brownfield; retrofit;
streetscape; lot. Likely to affect all cost elements.
Size of assets: large; small. Likely to affect all cost
elements.
Design: best practice; common but poor designs.
Likely to affect TAM and RC (incl. major rectification) costs.
Level of service: Standard; high. Likely to affect all
cost elements.
Geographic location: TAM and RC likely to be
strongly affected by location (due to a range of factors such as climate).
Also need tools to compare cost and performance in order to optimise cost-effectiveness (e.g. MUSIC). Ideally, practitioners would have access to databases that provide cost and performance data for all WSUD assets.
Assumptions in costing data need to be explicit. Need to link cost estimates to specific designs and maintenance regimes.
Need the ability to generate cost estimates for individual assets and treatment trains. Also need information on „land take‟, impact of WSUD on surrounding property values, social benefits, energy related costs (e.g. for reuse systems), etc. Such information goes beyond the LCC of just the WSUD assets to consider triple-bottom-line benefits and costs.
Useful to also have costs associated with the „do nothing‟ or „base case‟ scenario to help justify the project.
TAM costs need to include operation costs (e.g. running a reuse system).
Stakeholders also need broad guidance on relevant targets / design objectives, policy, legislative requirements and applicable detailed guidelines.
TAC needs to include construction, establishment and project management costs.
Photographs should also be used to communicate the types of designs for which cost estimates are available.
Stakeholders The type of cost information / data they need
The degree of confidence they need in the data
(High / Medium / Low)
The form the data needs to be in Other important WSUD asset information / data needs High-level decision-makers: strategic planners; developers; councillors; board members; executives.
High level estimates – e.g. TAC and LCC / size relationships, % „rule of thumb‟ estimates (e.g. relating to costs per development size), and probable „land take‟ associated with WSUD assets. Needed to build business cases.
The contingency amount that should be allowed in case cost estimates are inaccurate.
The relationship between the cost and performance of WSUD assets (i.e. the „cost-performance curve‟) to help decision making. Applies to capital and LCC costs.
How costs are spread over time.
M-H – TAC estimates. M-L – other cost estimates.
TAC and LCC per size descriptor (e.g. m2, KL) for each
WSUD asset type.
TAC and LCC costs per lot, where relevant (e.g. the costs of rainwater tanks per lot on a subdivision).
% „rule of thumb‟ estimates that relate the development‟s size to: typical WSUD TAC / LCC costs; and the loss of developable land.
Contingency allowance (e.g. a % of TAC to allow for increased construction costs and DC to allow for asset removal).
The relationship between cost elements and each year of the asset‟s life.
Cost data in a form that allows relationship between cost and performance to be examined (e.g. $ per kg of N/P removed over the asset‟s life).
There is no need to service this group of stakeholders via design tools / models like MUSIC.
Also interested in the costs associated with the „do nothing‟ / „base case‟ scenario (e.g. traditional water management) in order to build a business case.
Also interested in all of the information needed to do triple-bottom-line assessments (with costs being one input).
Information to examine the efficiency of WSUD assets (e.g. treatment performance versus cost), and their ability to meet targets (e.g. design objectives).
The time needed to get the asset in place (this is often a significant driver for the private sector). Photographs should also be used (see previous comment).
Representatives of the eventual owner / operator (e.g. financial planners and asset managers in councils).
All cost elements: LCC, TAC (less significant), TAM, RC, DC, discount rates, life span / cycle and depreciation rates.
How LCCs are spread over time, including the costs that fall into discrete budget periods (i.e. 1, 4, 10 and 20 year periods).
M-L – TAC.
H – other cost elements.
Cost elements and LCC per size descriptor (e.g. m2, KL)
for each WSUD asset type.
Need estimates of each cost element that are linked to a given year, so costs can be grouped into budget periods for asset / financial planning purposes (e.g. all
maintenance costs over the next 10 years). Standard unit rate cost estimates for individual asset components (e.g. filter media, plants, etc.). In particular, TAM needs to be broken down into unit rates.
Need to state all financial assumptions associated with cost estimates.
Also need guidance on how to use this information in asset management plans, as well as relevant legislative requirements. [Such comments highlight the need for capacity building activities to support the provision of LCC information and tools.]
Photographs should also be used (see previous comment).
Table 9 – The LCC data needs of key stakeholders during the „construction and establishment‟ stage Stakeholders The type of cost information / data
they need
The degree of confidence they need in the data
(High / Medium / Low)
The form the data needs to be in Other important WSUD asset information / data needs
Developers, contract managers, consulting engineers.
Primarily TAC.
May also need to know DC (as a contingency measure).
May also need to provide other stakeholders (e.g. ultimate asset owners) with TAM and RC estimates.
H – TAC.
L-M – other cost elements.
TAC and DC per size descriptor (e.g. m2 or KL).
TAC broken down into unit rates / „bills of quantities‟. See previous comments about the need for cost elements to reflect a range of factors (e.g. size, context, level of service, geographic location, etc.).
Guidance on WSUD asset specifications. Guidance on what costing information needs to be supplied during the approval process.
Detailed designers / design teams, project managers, construction managers, lead contractors, sub-contractors, developer superintendants.
Primarily TAC. LCC.
TAM and RC (especially in the first few years after construction). Costs savings (helps to sell benefits) – e.g. reduced trunk drainage costs. Compliance costs (e.g. filter material tests).
H – TAC (ideally within 10% of final budget). Typically confirmed through market mechanisms. M – other cost elements.
LCC and TAC per size descriptor (e.g. m2 or KL). Also, TAC
per lot, where relevant.
Unit rates / bills of quantities for TAC (i.e. typical ranges for common items).
Need to understand how the capital (TAC) and early maintenance costs (TAM / RC) are spread over the assets life, especially the first few (e.g. 3-5) years.
Need to be able to compare the costs associated with alternative options (e.g. WSUD Vs. traditional design).
Life span of assets / asset components. Benchmarking information (e.g. typical TAC
and LCC/m2 ranges for well designed,
cost-effective rain gardens in particular cities / regions). Needed to demonstrate value for money.
Guidance on the pros and cons of using different construction service providers (e.g. landscapers, civil contractors, etc.). Asset owners, maintenance
contract managers, local government subdivision engineers.
All maintenance costs (TAM, RC). DC.
Time frames for all maintenance costs (i.e. frequencies).
H – TAM. M – RC. L – DC.
Cost (TAM, RC, DC) per m2 per event or year.
Also need a typical schedule of maintenance visits, costs, staff requirements and plant / equipment requirements. See previous comments about the need for cost elements to reflect a range of factors.
Need to break vegetation-related maintenance costs (e.g. TAM) down into several categories (e.g. year 1, years 2-5, years 6+).
Need to break down maintenance costs to include items like
the cost of disposing contaminated material ($/m3) in various
locations.
Also need guidance on the life span of
WSUD asset elements (e.g. filter media in
bioretention systems). This guidance could use a range of factors to estimate the life span.
Also need a clear maintenance plan / inventory at the asset handover stage that specifies maintenance processes, timing, and requirements for equipment and staff.
Regulators / compliance officers. All cost elements, as these stakeholders need to know the long-term cost implications.