ENERGY
Energy policy
The NSW Government’s priorities for energy as identified in the State Plan are to ensure a reliable electricity supply, and develop a clean energy future. The table below identifies the targets and measures for each priority.498
Priority Target Performance measure
Ensure a reliable electricity supply
Achieve average electricity reliability for NSW of 99.98% by 2016
Proportion of normalised customer minutes subject to unplanned electricity outages each year Develop a clean
energy future
Achieve 20% renewable energy consumption by 2020
Proportion of electricity consumed in NSW generated from renewable sources Implement 4,000GWh of annual electricity
consumption savings through NSW energy efficiency programs by 2014
Total electricity consumption savings through NSW energy efficiency programs
The achievement of the goal to ensure a reliable electricity supply is intended to be by:
The NSW Government introducing laws to protect vital electricity supply cables TransGrid and the distribution companies investing $18 billion in electricity network
infrastructure over the 2009/10 to 2013/14 period, including some $800 million in the CityGrid project
The NSW Government working with the private sector to back-up power systems in Central
Sydney.499
The achievement of the goal to develop a clean energy future is intended to be by:
Developing renewable energy sources by introducing a Solar Bonus Scheme, creating six wind
energy precincts, and working to secure a large solar power plant for NSW under the Australian Government’s Solar Flagships program
Improving energy efficiency through the $150 million Energy Efficiency Strategy, and
implementing the Energy Savings Scheme, setting mandatory targets for energy retailers to deliver energy savings for customers by reducing demand
Facilitating smart power distribution grids through supporting bids for large-scale pilots of smart
grid technology that allow whole suburbs to reduce electricity costs and demand under the Australian Government’s Smart Grid Smart City program
Facilitating the introduction of Lower Carbon Transition Fuels by supporting distributed
co-generation and tri-co-generation, supporting natural gas supply and pipeline projects across NSW, and investing $100 million to support development of carbon capture and storage and other technologies to reduce emissions from coal-fired power generation.500
NSW’s energy sector is governed by a combination of State and national organisations. The key ones are:
Australian Energy Market Commission (AEMC). The AEMC became responsible for
rule-making, market development and policy advice on the National Electricity Market (NEM) and natural gas pipelines services and elements of the broader natural gas markets from 1 July 2009.
Australian Energy Regulator (AER). The AER has responsibility for the enforcement of and
compliance with the National Electricity Rules, as well as responsibility for the economic regulation of electricity transmission and distribution. The AER issues infringement notices for certain breaches of the National Electricity Law and Rules, and is the body responsible for bringing court proceedings in respect of breaches.501 The AER is also the economic regulator for National Gas Law covering natural gas transmission and distribution pipelines in all States and Territories and enforces the National Gas Law and National Gas Rules. The AER took
responsibility for economic regulation of the gas distribution networks from 1 July 2008.502 The
AER is part of the Australian Competition and Consumer Commission (ACCC).
Australian Energy Market Operator (AEMO). The AEMO operates the National Electricity
Market (NEM) as well as the retail and wholesale gas markets of south-eastern Australia from 1 July 2009.
Independent Pricing and Regulatory Tribunal (IPART). IPART is responsible for
administering licensing within the energy industry and monitoring compliance with licence requirements. IPART's roles and functions in relation to electricity and gas are set out in the
National Electricity (New South Wales) Act 1997, the Electricity Supply Act 1995, the Gas Supply Act 1996 and the Gas Pipelines Access (NSW) Act 1998. IPART ceased being the regulator for electricity and gas networks in NSW on 1 July 2009, transferring responsibility to AER and AEMC.
Industry & Investment NSW (NSW Department of Industry & Investment). This department
is responsible for setting NSW energy policy and regulations including licence conditions, contestability requirements and reporting.
NSW Department of Planning. The Department is responsible for environmental assessment
of network proposals under the Environmental Planning and Assessment Act, 1979 (EP & A Act) and relevant planning instruments, in particular the State Environmental Planning Policy.
NSW Office of Fair Trading. The Office is responsible for monitoring the safety of customer
electrical installations under the Electricity (Consumer Safety) Act and Electricity (Consumer Safety) Regulation and authorising accredited service providers under the Electricity Supply Act
and Electricity Supply (General) Regulation. It is also responsibility for certain regulatory activities under the Gas Supply Act 1996.
Energy and Water Ombudsman NSW (EWON). EWON is a consumer service resolving
9 Electricity
9.1 Summary
Infrastructure Type NSW 2010 NSW 2003 National 2005 National 2001
Electricity C- B C+ B-
This rating recognises that transmission and distribution systems performance has improved in the last few years and the committed medium-term investment will lead to further improvements. Of concern is the uncertain future of new baseload generation caused by uncertainty over the future of gas prices, carbon costs and government decisions. If new generation capacity is not constructed, NSW’s power needs will not be able to be supplied from within the State.
Since the last Report Card, the major electricity sector developments in NSW have been:
A significant growth in electricity demand Rising electricity prices
Increase in the utilisation of infrastructure to the point where further increases are difficult
without the construction of major new infrastructure
Significant increase in capital investment by transmission and distribution companies
Transfer of economic regulation for electricity transmission and distribution from IPART to AER An increase in renewable energy supply
Major electricity supply disruptions in the Sydney CBD in April 2009.
Recently completed and in-progress major infrastructure projects include:
CityGrid CBD electricity upgrade
Commissioning major gas-powered generators at Colongra, Uranquinty and Tallawarra Upgrades at Eraring, Bayswater and Mount Piper Power Stations
Upgrade of the Bayswater to Mount Piper transmission line.
Challenges to improving electricity infrastructure include:
Renewing ageing infrastructure
Implementing significant demand management measures to constrain peak demand growth Capturing the opportunities of smart network technology
Building new generation plants
Building economic baseload generation Ensuring retail competition.
9.2 Infrastructure
overview
9.2.1 System description
Electricity infrastructure refers to stationary electricity networks that comprise interconnected electricity transmission and distribution systems, together with connected generating systems, facilities and loads. It includes non-renewable and renewable generation. It excludes mobile generators and non-grid-connected electricity systems.
The State’s physical electricity infrastructure comprises:
Generation
Distribution networks Retail companies.
Figure 9.1 illustrates the infrastructure components of an electricity network.
Figure 9.1: Infrastructure components of the electricity network503
The physical elements work within a market structure called the National Electricity Market (NEM). The NEM spans Victoria, Queensland, NSW, ACT, SA and Tasmania. Over 275 registered generators across the NEM offer to supply power and their production is bought by retailers. The central coordination of the dispatch of electricity from generators is the responsibility of the AEMO. Figure 9.2 illustrates the inter-relationship between the physical and financial components on the NEM. While generation and retail has been opened to competition, due to the nature of
transmission and distribution networks, these are regulated monopolies.
Figure 9.2: Structure of the National Electricity Market504
electricity settlement payments electricity settlement payments
* currently no customers submit demand side bids
load dispatch instructions*
purchase bids*
physical electricity flows
plant dispatch instructions
supply offers
transmission network distribution network
consumers AEMO
determines the amount of power required generators
Generation
NSW has around 18,000MW of installed electricity generation capacity (which includes Snowy Mountain hydroelectric generators) with Queensland and Victorian interconnectors providing an additional 1,100MW and 1,500MW respectively.505 Over 90% of NSW-installed capacity is
generated by black coal-power stations. Other fuel sources include gas, wind, distillate and
photovoltaic. Figure 9.3 identifies the sources of electricity in NSW compared with the other States.
Figure 9.3: Installed capacity by fuel type with Snowy Mountain generators extracted from the NSW figures, as at June 2008 506
Table 9.1 identifies the major generation plants in the State. Most of the large power stations were built prior to 1990 and are expected to reach their end of their technical life within the next 20 years. Munmorah is expected to close in winter 2014 unless a major overhaul/re-powering occurs.507
Table 9.1: Major existing NSW power stations (greater than 30MW)508
Power station Location Owner Technology Installed
capacity (MW) Commission date Current technical life
Bayswater Hunter Macquarie
Generation
Steam/Coal 2,720 1985/86 2035
Eraring Lower Hunter Eraring Energy Steam/Coal 2,640 1982/84 2030
Tumut Snowy Snowy Hydro Hydro 2,116 1959-1973
Liddell Hunter Macquarie Generation
Steam/Coal 2,080 1971/73 2025
Murray* Snowy Snowy Hydro Hydro 1,500 1967-1969
Mount Piper Central West Delta Electricity Steam/Coal 1,400 1992/93 2040 Vales Point Central Coast Delta Electricity Steam/Coal 1,320 1978/79 2030 Wallerawang Central West Delta Electricity Steam/Coal 1,000 1976/80 2030 Colongra Central Coast Delta Electricity Open Cycle Gas
Turbine
668 2009 2040
Uranquinty Wagga Wagga Origin Energy Open Cycle Gas Turbine
648 2008
Munmorah Central Coast Delta Electricity Steam/Coal 600 1969 2013/14
Tallawarra Wollongong TRUenergy Combined Cycle
Gas Turbine
435 2009
Shoalhaven Nowra Eraring Energy Hydro 240 1977 2040
Smithfield Smithfield Marubeni Gas Cogen 160 1997
0 2 4 6 8 10 12 14
NSW QLD VIC WA SA Snowy TAS NT
Installed
capacity
('000 MW)
Non-hydro renewable Oil and other Hydro Natural gas Coal
Power station Location Owner Technology Installed capacity (MW) Commission date Current technical life
Redbank Hunter Redbank Project Coal Tailings 145 2001
Capital Wind Farm
Tarago Renewable Power Ventures
Wind 141 2009
Blowering Snowy Snowy Hydro Hydro 80 1969
Guthega Snowy Snowy Hydro Hydro 60 1955
Appin Mine Illawarra EDL Group Coal Seam Methane
56 1996
Warragamba Sydney Eraring Energy Hydro 50 1959
Tower Mine Illawarra EDL Group Coal Seam Methane
41 1996 Broadwater North Coast Delta Electricity BaGasse 30
Condong North Coast Delta Electricity BaGasse 30
Cullerin Upper Lachlan Origin Energy Wind 30
* in Victorian region of the NEM
About 6% of NSW electricity generation is derived from renewable sources, and the contribution of each is: 88% hydro 5% biomass 5% landfill methane 1% wind 1% solar.509
Table 9.2 details the capacity of renewable generation in NSW and other jurisdictions.
Table 9.2: Capacity of renewable generation (MW) at 31 December 2008510
Fuel type NSW & ACT1
VIC QLD SA WA TAS NT Snowy TOTAL
Hydro 3,966.1 620.4 161.4 2.5 30.1 2,279.6 0.0 3,676.0 7,060.0 BaGasse 15.5 0.0 362.6 0.0 6.0 0.0 0.0 0.0 384.1 Biomass 3.9 0.2 36.5 3.5 1.0 0.0 0.0 0.0 45.1 Black liquor 20.0 54.5 2.0 0.0 0.0 0.0 0.0 0.0 76.5 Geothermal 0.0 0.0 0.1 0.0 0.0 0.0 0.0 0.0 0.1 Landfill gas 50.9 35.3 16.6 20.9 22.8 3.9 1.1 0.0 151.4 Sewage gas 3.5 18.1 4.5 5.5 1.8 0.1 0.0 0.0 33.5 Solar2 1.5 0.5 0.3 0.3 0.3 0.0 1.4 0.0 4.3 Wave 0.5 0.0 0.0 0.0 0.0 0.0 0.0 0.0 0.5 Wind 16.7 191.9 12.5 482.4 202.6 142.3 0.1 0.0 1,048.4 Total 4,078.4 920.9 596.4 515.1 264.6 2,425.9 2.6 8,804.0 1.
Includes Snowy region. 2. Solar capacity does not include solar hot water installations.
The NSW Government renewable energy goal, as stated in the State Plan, is to achieve 20% renewable energy consumption by 2020.511 To accelerate the uptake of wind energy, the NSW
Government is creating six wind energy precincts – New England Tablelands, Upper Hunter, Central Tablelands, NSW/ACT Cross Border Region, Cooma–Monaro and the South Coast – with streamlined planning assessments and dedicated coordinators.512
To increase rooftop photovoltaic (PV) systems, the NSW Government introduced a feed-in tariff scheme called the NSW Solar Bonus Scheme on 1 January 2010. The scheme pays a gross tariff (i.e. the consumer is paid for all the electricity that they generate). The tariff is set at 60c/kWh. The
feed-in tariff applies to customers who consume less than 160MWh of electricity per annum and have a PV system or wind turbine up to 10kW in capacity.513 The Scheme aims to result in 10,000
new installations each year.514 The Scheme will be reviewed in 2012, or when the installed capacity
of renewable energy generators participating in the Scheme reaches 5MW, whichever occurs first.515 The costs paid to customers benefiting from the scheme are recovered from all electricity
customers via a distributor levy. Retailers pay their customer the appropriate tariff through an additional line in their quarterly bill, and then recoup this cost by billing the distributor.516 This
subsidy by all electricity customers will result in an increase in household electricity bills of $1.90 to $7.47 per annum depending on take-up.517 Details of feed-in tariff schemes for other jurisdictions
are listed in Table 9.3.
Table 9.3: Feed-in tariff rates in other Australian jurisdictions518
Jurisdiction Current status Nature of scheme* Rate Duration
NSW Commenced in January 2010 Gross 60c/kWh 7 years
VIC Commenced 1 November 2009 Net 60c/kWh 15 years
QLD Commenced 1 July 2008 Net 44c/kWh 20 years (subject
to review)
WA Commencing 1 July 2010 Net 40c/kWh 10 years519
NT Commenced 1 July 2009 in Alice Springs only
Net 45.76c/kWh (capped
at $5 per day, then reverts to 23.11c/kWh)
To be determined
ACT Commenced in March 2009 Gross 50.05c/kWh reducing
to 45.7c/kWh in July 2010
5 years
SA Commenced on 1 July 2008 Net 44c/kWh 20 years
* Nature of the scheme options: Gross tariffs which are where the consumer is paid for all the electricity their system generates, and net tariffs which are where the consumer is only paid for the generated electricity they export to the grid, not for the proportion of generated electricity they use themselves.
Transmission
NSW’s transmission network can be divided into:
The intrastate network linking generators to distribution networks and major end users
Interconnectors that link NSW’s intrastate network with the transmission network of Victoria and
Queensland.
Intrastate transmission network
NSW’s intrastate transmission network is owned, operated and managed by TransGrid, a NSW State-owned corporation. It is also responsible for planning and developing the NSW transmission system within the State and to facilitate operation of the National Electricity Market. It has assets worth over $4.2 billion.520 Table 9.4 provides details of its assets.
Table 9.4: TransGrid’s transmission network assets (as at June 2009)521
Assets Asset High Voltage Overhead (km) 12,445
High Voltage Underground (km) 47 Substation and switching stations 85
Structures 36,543
Figure 9.4: NSW transmission network522
The transmission network carries loads to six main areas as identified in Table 9.5.
Table 9.5: NSW load areas and their indicative peak loads523
Load area Indicative peak load (MW)
The NSW north, supplied from the Hunter Valley, Newcastle and over Queensland to NSW Interconnector (QNI)
1,000 Newcastle area (this includes aluminium smelters with a load greater than 1,000MW) 2,000
Greater Sydney 6,000
Western Area 600
South Coast 700
Electricity transmission networks are regulated due to their monopolistic nature, meaning that they operate within regulatory arrangements established in the National Electricity Law and National Electricity Rules, and administered set by the AER. TransGrid’s current regulatory period runs from 1 July 2009 to 30 June 2014.
Interconnectors
Interconnectors connect the transmission networks of different NEM regions. They enhance competition by allowing multiple generators to compete for supply, as well as improving security and reliability of supply. The interconnectors are:
Queensland NSW interconnector (QNI) commissioned in 2002 Terranora (NSW–Qld) interconnector, previously called Directlink Victoria–NSW interconnector.
Distribution
Electricity is delivered to consumers by the following three State-owned distribution companies:
EnergyAustralia, which covers eastern Sydney, the Central Coast, the Newcastle area and the
Hunter Valley
Integral Energy, which covers Greater Western Sydney, the Blue Mountains, the Southern
Highlands and the South Coast
Country Energy, which covers the remainder of NSW.
The distributors’ supply regions are identified in Figure 9.5 and their infrastructure characteristics are listed in Table 9.6.
Table 9.6: Distributors’ infrastructure characteristics (June 2009)
Characteristics Country Energy525 EnergyAustralia526 Integral Energy527
Distribution Customer Numbers (Total) 786,241 1,591,372 859,718
Maximum Demand (MW) 2,332 5,918 3,798
Energy Received by the distribution network to year end (GWh)
13,076 32,289 18,235
System Loss Factor (%) 7.9 4.66 5.18
Transmission System (km) 0 885 N/A
Transmission Substation (Number) 17 40 41 N/A
Sub-transmission System (km) 12,277 3,685 3460
Substation - Zone (Number) 321 177 151
Substation - Distribution (Number) 132,212 29,974 29,219
High Voltage Overhead (km) 144,5462 10,290 11,325
High Voltage Underground (km) 1,7952 7,071 3,413
Low Voltage Overhead (km) 26,3082,3 21,156 8,891
Low Voltage Underground (km) 4,897 6,459 6,490
Pole (Number) 1,373,649 502,126 311,756
Street Lights (Number) 143,753 249,292 185,177
Being a monopoly service, electricity distribution networks are regulated by the AER. The regulatory period for all three distributors runs from 1 July 2009 to 30 June 2014.
Retail
Full retail competition for NSW electricity customers was introduced in January 2002, meaning that all customers can choose a retailer from which to buy their electricity. There are 21528 licensed
electricity retailers in the State as of March 2010, 11529 of which sell to small customers. Some 81%
of small retail customers in NSW are supplied by Country Energy, EnergyAustralia and Integral Energy.530
There are two types of tariffs for small customers – unregulated retail tariffs offered by all retailers, and regulated tariffs offered only by the three host retailers, which are Country Energy,
EnergyAustralia and Integral Energy. The regulated tariffs were intended to be a transitional measure during the development of retail markets, and the NSW Government has agreed to eliminate it where effective competition has been demonstrated. Since 2004, this regulated tariff has been made under a Voluntary Transitional Pricing Agreement (VTPA) by each host retailer. In 2009, the NSW Government stated that it would keep this tariff at least until 30 June 2013. This decision was justified on the basis of protecting consumers.531 In 2011, the AEMC will undertake a
review of the effectiveness of competition in NSW’s electricity and gas retail markets.532 Electricity demand
Over the last decade, electricity demand has increased annually on average by 1.9%.533 The peak
summer demand growth has been increasing faster at 3.3%534 with a major contributor being the
increased use of reverse cycle air-conditioning in homes. For instance, in Integral Energy’s supply area a decade ago, only 25% of households had air-conditioning, but today some 70% have it.535
Because of the air-conditioning growth, peak electricity demand has now shifted from winter to summer.536 Electricity demand increases on workdays compared with weekends, and during periods
of high and low temperatures.537
9.2.2 Policy and governance
A key component of the NSW Government’s vision for the electricity sector is reflected in its agreement to the national electricity objective. This objective is to promote efficient investment in, and efficient operation and use of, electricity services for the long-term interests of consumers of
electricity with respect to price, quality, safety, reliability and security of supply of electricity; and the reliability, safety and security of the national electricity system.538
The overarching regulatory framework for the NSW network is provided through the National Electricity Rules which are made under the National Electricity Law. The National Electricity Law is applied as law in NSW by the National Electricity (New South Wales) Act 1997. The National Electricity Rules provide the detailed standards that govern participation in, and the operation of, the NEM. They specify a range of technical performance criteria that network service providers must observe while planning, designing and operating their networks.
The role of the NSW and Australian Governments in controlling electricity infrastructure is now very constrained compared to the past, as they have transferred control to independent regulators and authorities within a market framework. However, Governments can influence the direction of the electricity industry through the Ministerial Council on Energy and the setting of Rules by the AEMC. In addition, Governments can indirectly influence both costs and demand through mechanisms such as applying a price to carbon and encouraging energy efficiency.
Key documents to guide the development of electricity networks in NSW are summarised in Table 9.7.
Table 9.7: Key electricity planning documents
Document Description
Annual Planning Report and Network Management Plan (for transmission)
TransGrid prepares an Annual Planning Report, which provides information on NSW energy demand projections; emerging constraints in the NSW network; information on completed, committed and planned augmentations; and proposed network developments over the next five years. This information allows the market to identify potential demand management solutions and allows TransGrid to implement appropriate network solutions. TansGrid’s Network Management Plan outlines its approach to managing existing network assets.539
Electricity System Development Review (ESDR)
Each of the distributors produces an ESDR that identifies emerging constraints for each sub-transmission and zone substation, and provides an indicative solution.
Electricity Statement of Opportunities (ESOO)
An ESOO is published annually by AEMO and provides a 10-year forecast to help market participants assess the future need for electricity generating capacity, demand side capacity and augmentation of the network to support the operation of the NEM. It includes a year-by-year annual supply-demand balance for the regions as a snapshot forecast of the capacity of generation and distribution.
National Transmission Statement (NTS) & National Transmission Network Development Plan (NTNDP)
These documents are published by AEMO in its role as the National Transmission Planner for the electricity transmission grid. The annual network development plans guide investment in the power system. In 2009, an interim NTS was produced, which replaced the previous Annual National Transmission Statement produced by NEMMCO. This document will be superseded by the NTNDP in 2010. The NTNDP will provide historical data and projections of network utilisation and congestion, summarise emerging reliability issues and potential network solutions, and present information on potential network augmentations and non-network alternatives and their ability to address the projected congestion.540
The key electricity supply legislation in NSW is the Electricity Supply Act 1995. This Act establishes a competitive retail market in electricity, confers on network operators such powers as are
necessary to enable them to construct, operate, repair and maintain their electricity networks, regulates network operations and electricity supply in the retail market, and encourages safety. Following a number of electricity blackouts to the Sydney CBD, notably in March 2009 and May 2009,541 the NSW Government introduced the Energy Legislation Amendment (Infrastructure
Protection) Act 2009. It requires that energy (electricity and gas) distribution network operators are members of the Dial Before You Dig Scheme, meaning that they have to provide contractors with information on the location and type of underground powerlines in the vicinity of any proposed excavation work.542 The Act also requires contractors undertaking excavation work to contact Dial
Before You Dig and obtain relevant information, with failure to do so resulting in a maximum fine of $2,200. Any person who damages vital electricity cables could face criminal charges or negligence proceedings, especially if they have not sought advice through the Dial Before You Dig hotline. In addition, the Act requires all government buildings to regularly test their back-up power systems, and the NSW Government will be putting in place a best practice program for private sector CBD landlords.543
9.2.3 Sector trends
Reform of the NSW electricity sector
Table 9.8 lists the major developments in electricity reform since 2006.
Table 9.8: Major developments in NSW electricity sector reform since 2006
Date Event
2006 The electricity market operator, MEMMCO, forecast that NSW would require 372MW of additional generation to meet existing demand by 2010/11.544
11 September 2007 The government commissioned Inquiry into Electricity Supply in NSW, undertaken by Professor Tony Owen, and made the recommendation that the NSW Government should divest itself of all State ownership on both retail and generation.545
10 December 2007 In response to the Owen report, the NSW Government announced that it would:
• Lease existing electricity generators to private operators, while keeping them in public ownership
• Retain the ‘poles and wires’ assets of the State-owned companies Country Energy, EnergyAustralia and Integral Energy in Government ownership, while their retail functions would move to private operators
• Introduce safeguards to protect and create jobs, keep prices as low as possible and protect the environment.
10 April 2008 Following the release of the Consultative Reference Committee (headed by Barrie Unsworth), the NSW Government stated that it would produce a $272 million electricity safety net package containing rebates for pensioners and help for low-income families.546
4 June 2008 The Premier, Hon Morris Iemma, introduced in the Legislative Assembly the Electricity Industry Restructuring Bill 2008 to provide for the restructuring of part of the NSW electricity industry by authorising and facilitating any of the following transfers of assets to the private sector:
• The lease of the power stations of an electricity generator and the transfer of the rest of its business
• The transfer of the retail business of an electricity distributor.547
The Premier also introduced a cognate bill, the Community Infrastructure (Intergenerational) Fund Bill 2008, to establish a fund into which the net proceeds of the restructuring would be paid and from which funds for capital works projects would be drawn.
19 June 2008 The Parliament passed the Auditor-General (Supplementary Powers) Bill 2008 to require the Auditor-General to review the Government’s program for restructuring the NSW electricity industry. On 21 August 2008, the Auditor-General tabled his report.
28 August 2008 The Treasurer, Mr Costa, introduced the Electricity Industry Restructuring Bill (No 2) 2008 and the Electricity Industry Restructuring (Response to Auditor-General Report) Bill 2008. The leader of the Opposition in the Council, the Hon Michael Gallacher, advised in his second reading speech that the Opposition would not support the Bills. The effective result of this was that the Bills would not pass the House.548
Date Event
1 November 2008 The NSW Government announced its Energy Reform Strategy, which consisted of: • Selling the retail arms of the three State-owned energy corporations (Country Energy,
EnergyAustralia and Integral Energy)
• Selling the seven power station development sites around NSW
• Contracting the electricity trading rights of the nine State-owned power stations to the private sector (the ‘Gentrader model’)
• Maintaining public ownership of existing power stations
• Maintaining public ownership of electricity transmission and distribution networks.549 March 2009 The NSW Government released the Energy Reform Strategy: Defining an Industry Framework,
which identified a range of implementation considerations to be resolved, and the Government undertook to seek market feedback to inform its final policy decisions on a range of transaction implementation issues.
September 2009 The NSW Government released the Energy Reform Strategy: Delivering the Strategy, which set out the Government’s final policy position on key reform and transaction implementation issues for the generation trading rights, retail businesses and development sites. This document also set out next steps and anticipated timelines for implementing the energy reforms.
Major network investment project
NSW distribution and transmission companies are planning to invest $18 billion in electricity network infrastructure from 2009/10 to 2013/14. This is the largest energy infrastructure program in the State’s history. For the three distributors, it will involve $14 billion of capital investment, an 80% increase from the past regulatory period 2004/05 to 2008/09 when it was $8 billion.550 It will result in
a significant expansion of assets. For instance, TransGrid's asset base will expand by 27% over the 2009/10 to 2013/14 period compared with 4% over the 2004/05 to 2008/09 period.551 A
significant reason for the growth is that over the last two decades, the focus has been on fine-tuning to maximise the utilisation of existing assets rather than building new ones. An illustration of this is that over the last 20 years there have only been a few major transmission lines built despite the massive increase in electricity consumption.552 As the load continues to grow and constraints
arise, there is now little option but to construct major new infrastructure.
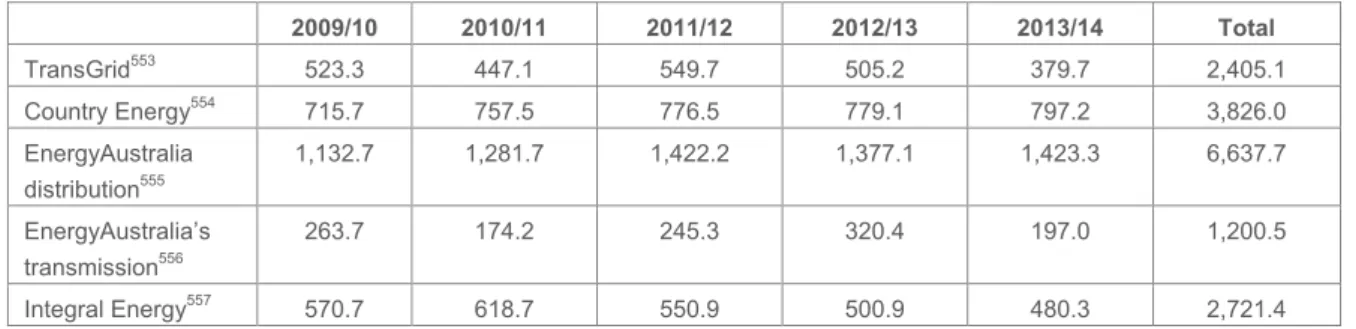
Table 9.9 details the capital expenditure over the 2009/10 to 2013/14 period for NSW transmission and distribution companies.
Table 9.9: Capital expenditure between 2009/10 and 2013/14 for NSW transmission and distribution companies approved by AER ($ millions)
2009/10 2010/11 2011/12 2012/13 2013/14 Total TransGrid553 523.3 447.1 549.7 505.2 379.7 2,405.1 Country Energy554 715.7 757.5 776.5 779.1 797.2 3,826.0 EnergyAustralia distribution555 1,132.7 1,281.7 1,422.2 1,377.1 1,423.3 6,637.7 EnergyAustralia’s transmission556 263.7 174.2 245.3 320.4 197.0 1,200.5 Integral Energy557 570.7 618.7 550.9 500.9 480.3 2,721.4
This expansion has been justified because of the need to:
Augment the networks to accommodate the growth in maximum demand for energy
Replace ageing assets
Improve network security and reliability.558559 Growing electricity demand
Electricity demand is driven by economic activity, population growth, price, domestic air-conditioner penetration, the comparative cost of natural gas, and several less important factors. For residential growth, key driver is population and hence household numbers. For commercial loads, the most
significant drivers are economic activity and population growth.560 The electricity 10-year growth
rate is estimated to be 1.5%561 per annum and projections for future growth are shown in Figure 9.6.
Figure 9.6: Energy projections for different economic growth scenarios562
The peak electricity rate continues to grow at a faster rate than average growth rate. The summer peak (10% POE rate)f rate is forecast to be 2.2% and winter 2.0%.563
Table 9.10 details the forecast growth in electricity demand and customer numbers over the 2009/10 to 2013/14 period for NSW distribution companies.
Table 9.10: Distributors’ customer numbers and energy forecasts for 2009/10 to 2013/14564
Forecast 2009/10 2010/11 2011/12 2012/13 2013/14 Average annual
growth 2009/14a Country Energy’s customers
(number)565
1,321,286 1,339,074 1,357,118 1,375,421 1,393,989 1.3%
EnergyAustralia’s customers (number)566
2,073,691 2,087,691 2,102,703 2,117,640 2,132,584 0.6%
Integral Energy’s customers (number)567
860,392 866,018 873,565 885,078 896,496 1%
Country Energy’s energy forecast (GWh)568
12,092 12,147 12,202 12,556 12,314 0.5%
EnergyAustralia’s energy forecast (GWh)569
27,948 28,041 27,989 27,673 27,477 –0.1%
Integral Energy’s energy forecast (GWh)570
17,373 17,313 17,526 17,967 18,202 0.7%
The importance of growth drivers varies with distributors, but the ones experienced by all are:
Population growth
Growth in air-conditioning loads
Obligations to meet N-1 reliability requirements
Replacement of the ageing infrastructure.
Growth factor – Population
Electricity demand is directly related to population growth and growth varies significantly between NSW supply areas. Population growth in the supply area of Integral Energy is highest in the State and its population is expected to grow by 6% by 2013/14, while the maximum demand for electricity is forecast to increase by 33% by 2013/14. Its supply area is served with rural and semi-rural feeders but is now becoming urbanised. This means that customers now expect improved reliability performance in these areas.571 In Country Energy’s supply area, population growth is pronounced
only along the coastal strip and this population has a high penetration of air-conditioning.572 Meeting
this peak demand growth is difficult using non-network options, meaning that new infrastructure has to be built to service the loads.
Growth factor – Air-conditioning
The uptake of air-conditioning has resulted in peak demand growing faster than average demand. As meeting peak demand is a primary driver of network capital investment, the growing peakier load pattern means that more assets are required to service demand that only exists for very short times each year. This is leading to a deteriorating load factor, as seen in Figure 9.7.
Figure 9.7: Integral Energy forecast system load factor573
Growth factor – n-1 reliability requirements
The NSW Government has introduced mandatory licence conditions on distributors that have imposed additional infrastructure requirements. The conditions contain new planning design security levels that include ‘n-1, 1 minute’ reliability standards for sub-transmission lines and zone substations supplying loads greater than to specified minimums, e.g. 15 MVA in urban and non-urban areas. An ‘n-1’ reliability standard allows for maximum forecast demand to be supplied when any one of the ‘n’ elements of a network is out of service. An ‘n-1, 1 minute’ standard allows for a risk that there will be some loss of supply for up to 1 minute to provide, for example, automatic switching to alternative supply arrangements.574 These requirements were first introduced in 2005,
and revised effective from 1 December 2007. The NSW Government requires that the new conditions be met by 2014, resulting in the distributors and TransGrid initiating a number of new projects.575
Growth factor – Ageing infrastructure
Many transmission and distribution assets in NSW are reaching the end of their useful life. This is because much of the network was built from the 1960s through to the 1980s, and many assets have a design life of about 50 years as seen in Table 9.11. It needs to be noted that the actual life
depends on the design, equipment specification and maintenance. Just because assets are ageing, it does not imply that they will fail. But, generally, there is a relationship between asset age and declining performance and increased operating expenditure due to more preventive and corrective maintenance. EnergyAustralia has the oldest energy distribution network in Australia, with many assets over 50 years old.576 For TransGrid, some 35% of substations and switching
stations were commissioned before the 1970s.577
Table 9.11: Design life of assets578
Asset Design life of assets
Transmission and zone substations and switching stations 45
Power transformers 50
Transmission and sub-transmission steel tower lines 60
Transmission and sub-transmission pole lines (concrete poles) 55
Transmission and sub-transmission underground cables 45
Distribution substations and switching stations (ground mounted) 45
Distribution substations (pole mounted) 45
Distribution overhead lines (concrete poles) 55
Distribution overhead lines (wooden poles) 45
Distribution underground cables 60
Metering equipment 25
Substation secondary systems (SCADA and protection systems, excluding cabling) 15
Substation control building 40
Communications systems 10
Street lighting 20
Growth in generation
There are currently three new generation projects either committed or under construction in NSW that have a total capacity of 362MW according to Australian Bureau of Agricultural and Resource Economics.579 There are another 23 fossil-fuel and 14 renewable energy projects that are in the
less developed category.580 A comparison of advanced energy projects underway in NSW and the
other States shows that NSW has attracted about 28% of all new plants being developed in Australia.581 Given the existing and committed investment in new electricity generation plant in
NSW, AEMO considers that NSW has sufficient capacity to meek both peak and average demand until 2013/14. After this date, additional capacity will be required to meet demand. AEMO 10-year predictions of the supply and demand balance are provided in Figure 9.8. The region is forecast to experience a reserve deficit from 2015/16.582
Figure 9.8: NSW supply–demand balance583
14000 14500 15000 15500 16000 16500 17000 2010/11 2011/12 2012/13 2013/14 2014/15 2015/16 2016/17 2017/18 2018/19 Capacity (MW)
Additional Capacity required Allocated Installed Capacity
As part of the Electricity Reform strategy, the Government intends to sell the generation development sites of the State-owned generators. These include sites suitable for gas-fired generation (peaking and combined cycle) and ‘dual fuel’ sites, which are suitable for the development of either coal- or gas-fired generation capacity. They are detailed in Table 9.12.
Table 9.12: State-owned generator sites to be sold584
Development Site Owner Size (MW) Fuel Progress
Bamarang Delta Electricity 300-450 Gas Full Development Approval (DA)
Tomago Macquarie Generation 500-790 Gas Full DA
Marulan EnergyAustralia 350 Gas Director-General’s (DG’s) requirements issued
Marulan Delta Electricity 300-450 Gas DG’s requirements issued Munmorah Delta Electricity 700 Gas/coal Planning process underway Bayswater B Macquarie Generation 2000 Gas/coal Planning process underway Mt Piper extension Delta Electricity 2000 Gas/coal Planning process underway
Figure 9.9 identifies their location in relation to major gas supply pipelines and electricity transmission lines.
Figure 9.9: NSW generation development sites585
9.3 Performance
9.3.1 NEM reliability and security
The performance of the National Electricity Market is based on the criteria of:
Reliability, the availability of adequate bulk supply to meet consumer demand. The current
capacity so that no more than 0.002% of the annual energy of consumers in any region is at risk of not being supplied; that is, unserved energy (USE) is less than 0.002%.
Security, the continuous operation of the power system within its technical limits.
For the NSW region of the NEM, the USE reliability criterion for a rolling 10-year average has been met. Over the last decade, the State’s USE was 0.0%.586
9.3.2 Generation
The key performance measure for a generational plant is its ability to deliver a reliable supply when required. Its availability is affected by the number of internal plant planned outages (e.g. for
maintenance and renewals), internal plant forced outages (e.g. plant breakdowns) and external forced outages (e.g. fuel unavailability, third party industrial actions). Internal plant outages usually increase with a plant’s age, and when major upgrades occur.
Table 9.13 contains the most recent availability figures, which show that NSW plants are in the mid-high range for planned outages and forced outages. Older generators generally have higher requirements for maintenance and higher rates of failure than new plants.
Table 9.13: Availability factors for generation1587
Equivalent availability factor(%) Forced outage
factor (%) Planned outage factor (%) State 2006/07 2007/08 2006/07 2007/08 2006/07 2007/08 NSW & ACT 86.4 85.2 4.2 4.3 9.4 10.5 Victoria 90.3 90.6 4.0 3.5 5.7 6.0 Queensland 93.1 88.9 3.3 3.8 3.6 7.3 South Australia 85.9 95.2 6.9 0.2 7.1 4.6 Western Australia 82.1 81.5 3.3 7.5 14.6 11.0 Tasmania 90.3 87.0 0.9 4.2 8.8 8.9 Northern Territory 84.1 89.7 4.6 3.6 11.3 6.7
Other performance indicators of generation, listed in Table 9.14 consist of:
System load factor, the ratio of the average load supplied during the year to the maximum
load. It measures the fluctuation in demand.
Capacity factor, the ratio of the actual output of a power plant over the year and its output if it
had operated at full nameplate capacity for the entire time.
Reserve plant margin, the total plant capacity available less the actual maximum demand for
electricity in a particular year, expressed as a percentage of maximum demand.
Table 9.14: Technical indicators: generation1588
System load factor (%) Capacity factor (%) Reserve plant margin2 (%)
State 2006/07 2007/08 2006/07 2007/08 2006/07 2007/08 NSW & ACT 63.6 61.5 66.1 69.0 9.0 5.0 Victoria 59.6 56.0 68.5 68.3 11.9 3.3 Queensland 65.1 69.3 65.6 60.0 21.0 38.1 South Australia 50.9 47.1 40.8 42.5 22.0 16.6 Western Australia 52.1 53.5 38.4 37.2 45.3 51.5 Tasmania 69.6 71.1 38.9 36.3 58.2 57.4 Northern Territory 64.5 65.2 44.26 41.1 48.8 60.4
9.3.3 Transmission
Technical service standards for TransGrid are:
Reliability. This is a measure of frequency and duration of power supply loss due to a
temporary failure of TransGrid’s plant. The measure of reliability is the number of system minutes of lost network supply.
Availability. This is a measure of the readiness of TransGrid’s plant to effectively transfer
energy from the generators to the distributors. Availability reduces with planned outages for scheduled maintenance and capital construction or replacement programs, and with unscheduled outages from plant failures.
Average Outage Restoration Time. This is a measure of the time taken to return equipment to
service after an unplanned outage. It is calculated by totalling the durations of unplanned outages that are longer than one minute, and dividing the total by the number of those outages.
Quality of Supply. This is a measure of electricity quality including power frequency voltage,
voltage fluctuations, voltage waveform distortion, voltage unbalance and fault clearance times.589
Table 9.15 sets out TransGrid’s performance for the last three years. Availability measures have been below target which TransGrid claims is due mainly to a large quantity of capital work for transmission line rebuilds, pole replacements and transformer replacements.590
Table 9.15: TransGrid’s performance measures
Performance measure 2006/07591 2007/08592 2008/09593 Target594
System minutes unsupplied 1.19 0.37 0.47 *
Transmission line availability 99.44 98.55 98.44 99.50595
Transformer availability 98.16 97.69 98.42 99.00596
Reactive plant availability 99.96 98.97 98.96 98.60597
Outage (unplanned) Average Duration (minutes)
613 843 862 1,500598
* TransGrid’s target for system minutes unsupplied is now specified in terms of numbers of large and small events incurred, not as a particular value.
9.3.4 Distribution
Technical performance of the distribution network is measured by reliability and quality of supply. Performance measures for these are:
System Average Interruption Duration Index (SAIDI). The sum of the duration of each
sustained customer interruption (in minutes), divided by the total number of distribution customers. SAIDI excludes momentary interruptions (one minute or less duration).
System Average Interruption Frequency Index (SAIFI). The total number of sustained
customer interruptions, divided by the total number of distribution customers. SAIFI excludes momentary interruptions (one minute or less duration).
Quality of supply. The quality of supply factors consist of voltage (e.g. sustained overvoltage
and undervoltage) voltage variation (e.g. fluctuations, dips, switching transients), current (e.g. direct current, harmonic content and inter-harmonics) and other qualities (e.g. signalling reliability, noise and interference, level of supply capacity).
Table 9.16 provides Normalised SAIDI figures, which exclude severe weather events. This provides a better insight into the underlying quality of the network. There has been an overall improvement trend in SAIDI for Integral Energy and Country Energy, which reflects positively on network improvement strategies. The increase in SAIDI for EnergyAustralia over the last year was due to two large network failures that affected parts of the Sydney CBD in April 2009.
Table 9.16: Normalised SAIDI for NSW distributors
2004/05 2005/06 2006/07 2007/08 2008/09
EnergyAustralia SAIDI599 90.4 90.2 102.0 100.3 108.5
Integral Energy SAIDI600 93 99 94 98 89
Country Energy SAIDI601 299 304 242 225 267
Figure 9.10 compares SAIDI across the nation.
Figure 9.10: System Average Interruption Duration Index (SAIDI) across Australia602
Table 9.17 provides SAIFI figures for NSW distributors. EnergyAustralia’s increase in 2008/09 is also due to the Sydney CBD disruptions in April 2009.
Table 9.17: SAIFI for NSW distributors
2004/05 2005/06 2006/07 2007/08 2008/09
EnergyAustralia SAIFI603 1.20 1.15 1.15 1.16 1.31
Integral Energy SAIFI604 1.2 1.2 1.2 1.2 1.1
Country Energy SAIFI605 2.82 2.55 2.39 2.28 2.37
Table 9.18 identifies the national comparisons.
Table 9.18: System average interruption frequency index (SAIFI)606
State 2000/01 2001/02 2002/03 2003/04 2004/05 2005/06 2006/07 2007/08 Queensland 3.0 2.8 2.7 3.4 2.7 3.1 2.1 2.4 NSW 2.5 2.6 1.4 1.6 1.6 1.8 1.9 1.7 Victoria 2.1 2.0 2.0 2.2 1.9 1.8 1.9 2.1 South Australia 1.7 1.6 1.8 1.7 1.7 1.9 1.8 1.5 Tasmania 2.8 2.3 2.4 3.1 3.1 2.9 2.6 2.6 NEM weighted average 2.4 2.4 1.9 2.2 1.9 2.1 2.0 1.9 Western Australia 3.3 3.3
Quality of supply performance measures are defined in the Electricity Distribution Code. Monitoring and reporting of compliance against these performance factors is based on the distributors’
monitoring program and customer complaints received by it. Table 9.19 identifies the number of customer complaints about quality of supply issues. The most common complaints were voltage fluctuations, sustained undervoltage and overvoltage, voltage dips and supply failures.607 While
EnergyAustralia and Integral Energy’s complaints are decreasing, this is not the case for Country
0 50 100 150 200 250 300 350 400 450 500 2000/01 2001/02 2002/03 2003/04 2004/05 2005/06 2006/07 2007/08 Av erage minutes of
outages per customer
Queensland New South Wales Victoria
South Australia Tasmania NEM average Western Australia
Energy. Country Energy considers that complaints continue to increase due to higher community expectations in reliability and quality of supply, as well as improvements in the recording of complaints.608 Increases in complaints may also be attributed to the introduction of more sensitive
and less tolerant electronic equipment. Country Energy also considers that the use of split system air-conditioning units installed without consideration of existing supply limitations contribute to complaints, and that the major cause of voltage fluctuations is an increasing number of air-conditioners installed with poor start characteristics.609
Table 9.19: NSW distributors’ customer complaints for quality of supply (complaints per 1,000 distribution customers) 2004/2005 2005/2006 2006/2007 2007/2008 2008/2009 Proportion of complaints relating to quality of supply Country Energy610 2.9 3.3 2.7 3.0 4.2 75% EnergyAustralia611 0.93 0.99 1.06 0.89 50% Integral Energy612 4.45 4.25 3.95 2.12 1.89 74%
All distributors have been working to improve the security of network assets and the prevention of theft, notably copper theft. An example of this is EnergyAustralia’s ongoing rollout of a $90 million security and surveillance campaign.613
9.3.5 Environmental sustainability
Electricity consumption in NSW produces over 79 million tonnes of greenhouse gas emissions per year. This is over 37% of the State’s greenhouse gas emissions.614
The NSW Government has a range of initiatives to both reduce electricity consumption and increase renewable energy uptake. These include:
A feed-in tariff for PV and small wind generators
The NSW Greenhouse Gas Reduction Scheme, establishing a local market for emissions reductions and greenhouse credits. Under the scheme, mandatory annual targets based on NSW per capita greenhouse emissions must be met by electricity retailers.
The Energy Savings Scheme, creating financial incentives to reduce electricity consumption by encouraging the adoption of cost-effective energy-saving practices by households and
businesses. It requires electricity retailers to pursue additional energy efficiency measures in households and businesses. The energy savings target started on 1 July 2009 at 0.4% of electricity sales in NSW and increases to 4% by 2014.
The Climate Change Fund, which provides rebates for energy-saving measures such as solar hot water and insulation, and a range of other funding programs for energy savings in schools, businesses and public facilities.
Under the Building Sustainability Index (BASIX), home builders, developers and some renovators in NSW, are required to meet targets to reduce energy consumption.615
Specific environmental improvements pursued by electricity sector participants include:
Reducing the carbon footprint and waste output of the organisation
Educating customers on ways to reduce energy consumption
Demand management measures.
Demand management initiatives are actively being pursued as a way of deferring network augmentation that would otherwise be required to meet demand growth and network security requirements. Demand management options include:
Thermal insulation
Renewable energy sources such as solar
Alternative reticulated energy sources such as natural gas Tariff incentives
Load interruption and reduction incentives
Arrangements to transfer load from peak to off-peak times Energy storage systems
Standby generators
Power factor correction equipment.616
A major development in advancing demand management was completed in 2008 by EnergyAustralia and involved producing a comprehensive knowledge base of demand management technologies and practices with the potential to reduce electricity demand in the Sydney inner metropolitan area. An example of successful demand management was the introduction of a portfolio of 350MW of demand reduction to the Newcastle–Sydney–Wollongong load area in the summer of 2008/9, which enabled the completion of the Western 500kV Upgrade project to be deferred to summer 2009/10.617 A number of demand management projects are
actively being pursued by TransGrid618 and the distributors.
9.4 Future
challenges
The challenges to achieving improvements in electricity infrastructure are:
Renewing ageing infrastructure. Much of the distribution network is nearing the end of its
design life. A significant rise in the level of upgrades and renewals of network infrastructure will be needed, requiring a large pool of labour resources.
Implementing significant demand management measures to constrain peak demand
growth. Peak demand is currently growing faster than average demand. Peak demand growth
needs to be reduced to the level of average demand growth to improve network reliability and security, and maximise asset utilisation. Achieving significant reduction in demand, particularly given air-conditioning demand on hot days, will be a major challenge.
Capturing the opportunities of smart network technology. There is a need to prepare for an
increasingly intelligent network, with proliferating network-integrated digital technologies, and growing numbers of small and micro generators such as solar/photovoltaic and wind linking into the network. Electricity providers are currently planning for smart grid networks that provide real-time information on electricity supply and the ability to remotely control the network. Increased initiatives, such as EnergyAustralia’s research and development activities via its university Intelligent Network Centre of Excellence program, are required both to accelerate the development and deployment of smart network technology.
Building new generation plants. An assumption in the Electricity Reform Program is that new
generation will be built if the reforms occur. However, new generation in the scale and type required may not be constructed by the private sector due to market problems such as a lack of confidence in the long-term electricity demand and supply forecasts, concern over sovereign risk, and uncertainty about revenues and costs. While market mechanisms theoretically will result in new generation construction, there is a significant risk that over-relying on the market to deliver this will result in insufficient electricity supplies at certain times, and erratic prices.
Building economic baseload generation. Due to uncertainty over carbon pricing, baseload
coal-fired plants are not being developed. Instead, gas-fired plants are being built as they are quicker and cheaper to construct, and less subject to carbon pricing. However, their cost of generation is far more sensitive to gas prices, which are likely to become more volatile due to the internationalisation of Australian gas prices. Providing economic baseload generation will become increasingly important as NSW’s existing coal-fired plants reach their technical end of life. All options should be considered in the provision of baseload power, including renewable and nuclear power.
Ensuring retail competition. The sale of State-owned retail electricity activities has the
potential to transfer the existing monopolies from State to private ownership. There is a considerable risk that competition will not be enhanced following the reforms, resulting in no competitive tension between suppliers and no downward pressure on prices.
9.5
Report Card Rating
Infrastructure Type NSW 2010 NSW 2003 National 2005 National 2001
Electricity C- B C+ B-
Based on considerations of planning, funding, and infrastructure capacity and condition, NSW’s electricity infrastructure has been rated C-. This rating recognises that transmission and distribution systems performance has improved in the last few years and the committed medium-term
investment will lead to further improvements. Of concern is the uncertain future of new baseload generation caused by uncertainty over the future of gas prices, carbon costs and government decisions. If new generation capacity is not constructed, NSW’s power needs will not be able to be supplied from within the State.
Positives that have contributed to the rating are:
Growth in renewable generation in the State
Significant expansion in investment in network infrastructure
Sound transmission and distribution networks
New requirements for n-1 reliability and introduction of enhanced Dial Before You Dig
arrangements.
Negatives that have contributed to the rating are:
Ageing transmission and distribution infrastructure Ageing of many of the major generation units Peak demand is rising faster than average demand
Congestion and network constraints in certain areas of the transmission network
Increasing population and increasing electricity demand resulting in a predicted reserve deficit
after 2012/13
10 Gas
10.1 Summary
Infrastructure Type NSW 2010 NSW 2003 National 2005 National 2001
Gas C Not rated C+ C
This rating recognises that the gas transmission and distribution systems are in a sound condition, and increases in gas exploration, production and pipeline capacity have increased supply.
However, as future supply and demand for gas is highly uncertain due to government policy, the internationalisation of domestic gas prices, and the construction of new gas-fired generation plants along the east coast of Australian, it is impossible to determine if the infrastructure is appropriate for future demand.
Since 2005, the major gas sector developments have been the:
Increased quantity of gas required for gas-powered generation
Transfer of economic regulation for gas distribution from the IPART to the AER
Reduction in cross-subsidies paid by large gas customers resulting in real price reduction for
large customers and price increases for small customers
Supply of gas from Queensland to NSW via the Ballera and Moomba pipeline (QSN Link) Increased exploration and development of coal seam gas reserves.
Recently completed and in-progress major infrastructure projects include:
Construction of the QSN Link
Construction of the Sydney Primary Loop to improve security of supply to the Sydney basin Expansion in capacity of the Moomba–Sydney Pipeline, Eastern Gas Pipeline and NSW–
Victoria Interconnect.
Challenges to improving gas infrastructure include:
Planning gas infrastructure to meet demand Expanding the distribution network.
10.2 Infrastructure
overview
10.2.1 System description
Gas infrastructure refers to reticulated natural gas infrastructure. NSW’s gas infrastructure comprises the following components:
Production
Transmission
Distribution
Retail companies.
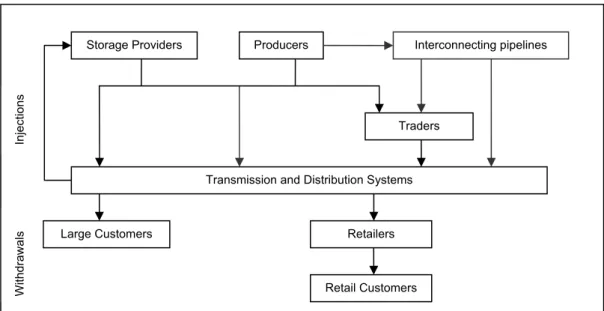
This section does not cover liquefied petroleum gas (LPG), biomass and other fuel gases. Figure 10.1 illustrates the entities and physical flows in the State’s natural gas sector. Producers extract and process the gas, and sell gas directly to large customers, retailers or traders. Supply is also provided from interconnecting pipelines and storage providers. Transmission pipelines carry the gas under high pressure to city gates (also known as gate stations/custody transfer meters)
that control and measure the gas flow into the distribution network. The odorant is normally added at the city gates to make the detection of gas leaks easier. The distribution network takes the gas from the gates and distributes it via high, medium and low pressure pipelines to the customer’s meter/regulator set. The customer pays the retailer for the gas. The retailer buys the gas from producers, and pays the transmission and distribution businesses for transporting the gas.g
Retailers must balance their purchase and sale contracts to ensure security of supply. Retailers also operate customer call centres and implement customer demand curtailment in the event of major gas shortages.
Figure 10.1: Schematic of natural gas entities and physical flows
Production
Natural gas can be divided into two categories - conventional natural gas which is found in underground reservoirs of trapped rock, and coal seam gas, which is located in coal seams. There are currently no commercially viable reserves of conventional natural gas within NSW.619
Consequently, natural gas consumed in NSW is imported from other States. Principally, it comes from three basins:
Cooper/Eromanga Basin, which spans SA, NT and Queensland
Surat-Bowen Basin, which spans Queensland and NSW
Gippsland Basin, which spans the State’s south east and Victoria.
Imports from Queensland’s Surat-Bowen Basin only started in January 2009 following the commissioning of the QSN Link pipeline between Ballera and Moomba.620 A small component of
NSW’s gas consumption comes from coal seam gas. This is supplied from the Camden Gas Project, located 50km south west of Sydney. The project has been supplying gas since 2001 and provides about 5PJ/year.621 This accounts for 4.5% of gas delivered in NSW. The locations of the
existing sources of coal seam gas are shown in Figure 10.2.
g The charges are known as transmission use of system (TUOS) and distribution use of system (DUOS).
Injections
Withdrawals
Producers Interconnecting pipelines
Traders
Transmission and Distribution Systems
Large Customers Retailers
Retail Customers Storage Providers
Figure 10.2: Sources of gas and major pipelines in eastern Australia622
The supply of gas from different sources is changing, notably due to the declining reserves in the Cooper/Eromanga Basin and the increase in coal seam gas from Queensland. There are
considerable coal seam gas reserves in NSW, primarily located in the Clarence-Morton, Gunnedah and Gloucester basins, which may be commercially exploited. Exploration in these basins is underway. The locations of coal seam gas projects are illustrated in Figure 10.3.
Figure 10.3: Coal seam gas projects in NSW623
The coal seam gas reserves in NSW have risen significantly over the last few years as exploration increases, as seen in Figure 10.4.
Figure 10.4: 2P coal seam gas reserves in NSW basins624
Over the next few years, several production projects are expected in NSW coal seam gas basins. Each will require wells, processing facilities and high pressure gas pipelines to connect the supply to existing pipelines or customers. Proposed projects include:
Gloucester Gas Project (AGL), located near Stratford, 100km north of Newcastle, which will
supply gas to Sydney625
Bulga area of the Hunter Valley (AGL)626
Eastern Star Gas development of the Narrabri, which includes exporting LNG via Newcastle
port.627
Clarence-Moreton basin projects (Metgasco). 0 50 100 150 200 250 300 350 400 2003 2004 2005 2006 2007 2008 PJ Gunnedah Clarence Moreton Gloucester Sydney
Transmission and storage
The vast majority of gas in NSW is imported via the following three main transmission pipeline systems:
Moomba–Sydney Pipeline, which transports gas from the Cooper/ Eromanga Basin, and from
the Surat-Bowen Basin via the QSN Link into Sydney and some major regional centres via lateral branches. It interconnects with the Central West Pipeline (CWP) and the Central Ranges Pipeline (CRP).
Eastern Gas Pipeline, which transports gas from the Gippsland Basin via Longford and Orbost,
and via the VicHub interconnect facility, along the eastern seaboard to Sydney.
NSW–Victoria Interconnect, which is a bi-directional pipeline linking the Moomba–Sydney
Pipeline to Victoria’s Gas Principal Transmission System. The Interconnect imports gas from Victoria to NSW in summer, and the reverse in winter.628
Below is a description of the recent and ongoing expansions of these pipelines.
Moomba–Sydney Pipeline. In 2008, a $100 million five-year expansion program commenced.
The project will increase capacity by around 20% to meet winter peak demand, and provide flows for new gas-fired electricity generation projects such as Uranquinty near Wagga Wagga.629
Eastern Gas Pipeline. A $41 million capacity expansion of the pipeline was completed in
2010.630 The project involved installing an additional compressor at the Longford Compressor
Station. The upgrade increased capacity of the pipeline from 250TJ/d to 268TJ/d.631
NSW–Victoria Interconnect. A partial looping of the Young to Culcairn pipeline was completed
in 2010. This duplication increases gas storage and capacity to meet future demand.632
Upgrades to pipeline infrastructure in Victoria connecting to the Interconnect were also completed in 2010 increasing the import capacity to NSW from 35TJ/day to 51TJ/day during winter.h
These and other pipelines are seen in Figure 10.5.
Figure 10.5: NSW’s major pipelines gas transmission network633
h The upgrade involved installing two new compressors at the Wollert Compressor Station; up-rating pipeline operating pressure of the
Wollert to Euroa pipeline; and installing flow reversal capability at the Springhurst Compressor Station. Australian Energy Market Operator, 2009, 2009 Gas Statement of Opportunities for Eastern and South Eastern Australia, pp. 4-18.