Working Paper Series
THE EFFECT OF PREMIUMS ON THE DECISION TO
PARTICIPATE IN HEALTH INSURANCE AND OTHER FRINGE
BENEFITS OFFERED BY THE EMPLOYER: EVIDENCE FROM A
REAL-WORLD EXPERIMENT
Anne Beeson Royalty
Indiana University Purdue University Indianapolis John Hagens
International Planning and Research
ERIU Working Paper 23 http://www.umich.edu/~eriu/pdf/wp23.pdf Economic Research Initiative on the Uninsured
University of Michigan 555 South Forest Street, 3rd Floor
Ann Arbor, MI 49104-2531
Not to be distributed or copied without permission of the authors. July 2003
The authors thank NCR for their cooperation in the use of the data. Royalty gratefully acknowledges funding from the Robert Wood Johnson Foundation through the Economic Research Initiative on the Uninsured at the University of Michigan. The views expressed are solely the authors’ and do not necessarily reflect the views or opinions of the Robert Wood Johnson Foundation or the Economic Research Initiative on the Uninsured. Thanks also to Qian Li for excellent research assistance.
Contact Information: Anne Beeson Royalty, Department of Economics, Indiana University Purdue University Indianapolis, 425 University Blvd., Indianapolis, IN 46202; royalty@iupui.edu
In this paper, we investigate the effect of the out-of-pocket premium on the decision to enroll in employer health insurance and other benefits plans including dental insurance, vision care, long-term care insurance, and wellness benefits. Previous estimates of the effects of premium
on takeup of health insurance could be biased toward zero due to a correlation between premium and unobservable demand or plan quality. We solve this problem using data representing hypothetical choices by employees under three different price regimes, providing price variation uncorrelated with either individual-specific or plan-specific unobservables. We find that workers are insensitive to price in health insurance takeup. Workers show much greater price sensitivity to
decisions about dental insurance, vision plans, long-term care insurance, and wellness benefits. We conclude that premium subsidies are unlikely to have a substantial impact on increasing
Census Bureau. Concern over the number of the uninsured stems from many sources, ranging from negative health consequences of being uninsured, to the financial impact of lack of insurance, to the strain that uncompensated care due to lack of insurance puts on already burdened publicly-funded health facilities. Despite a growing awareness of the problem over the preceding decade and attention to the matter by policymakers all the way up to the White House, the number of uninsured Americans increased substantially between 1987 and 2000 (U.S. Census Bureau).
In the U.S. most private insurance is employment-based. In 1996, 75% of workers were offered insurance through the workplace but 20% of those eligible for insurance from their employer did not take up that coverage (Cooper and Schone (1997)). Of workers who were uninsured in recent years, approximately 60% worked at firms that did not offer insurance, 20% were not eligible for offered employer insurance, and 20% did not take up the health insurance offered by the employer (2000 data from Cutler (2002); 1999 data from Garrett et. al. (2001)). Efforts to increase the number of workers covered by employer-based insurance can therefore be directed in any or all of three ways: policies to increase the number of employers offering insurance, policies to encourage liberalized eligibility at firms already offering insurance, or policies designed to increase the number of eligible workers who take up the coverage offered by their employers.
We focus here on the decision to enroll in offered employer health insurance. Not only do a substantial number of workers offered employer insurance decline the coverage, that number has been increasing in recent years (Cooper and Schone (1997), Farber and Levy (2000), Cutler (2002)). The
most common policy prescription for increasing takeup when insurance is offered is a premium subsidy. (See, for example, Glied (2001).) The question is whether or not this will work. How much would premium subsidies increase participation in employer health plans that are already being offered? And, more specifically, how large would such subsidies have to be to have a real impact on the number of workers who have no health insurance?
The previous work most directly addressing these questions has found very small effects of premiums on takeup. These estimates imply that even subsidies as large as 50% would not induce most workers currently not enrolling in offered insurance to do so (Blumberg et. al. (2002), Cutler (2002), Chernew et. al. (1997)). These studies are unable, however, to control completely for the correlation between premium and unobservable demand for insurance or plan quality that could bias the estimates.
We estimate the price sensitivity of workers’ takeup decisions using a unique dataset in which the variation in workers’ out-of-pocket premiums is exogenous, allowing us to estimate price effects unbiased by a correlation of premium and unobservable demand or unobservable plan quality. The data represent hypothetical choices of whether or not to participate in fringe benefits such as employer-sponsored health insurance by employees at a single firm. The data were collected in an effort to revise the firm’s benefits offerings to reflect more closely employee preferences. The same employees made choices from the same (quality-constant) menu of alternatives under three different price regimes, providing price variation uncorrelated with either individual-specific or plan-specific unobservables that could affect the takeup decision. We use these data to produce unbiased price elasticities.
With our data we are also able to estimate the effect of out-of-pocket prices on workers’ decisions to take up other offered employee benefits such as dental insurance, vision benefits, long-term
1
Other studies provide premium elasticities between health plans when more than one plan is offered (Short and Taylor (1988), Feldman et. al. (1989), Royalty and Solomon (1999), Buchmueller and Feldstein (1999)). These studies confirm the importance of the worker’s out-of-pocket premium in health insurance decisions but they do not address the decision to take up employer coverage. Abraham et. al. (2003) estimate a model of demand for insurance that models the choice between plans of different types, allows for an opt out decision, and takes into account the
care insurance, and wellness benefits. Our estimates are the first evidence on the price sensitivity of workers with respect to some of these other fringe benefits and, as such, should be of interest in understanding cafeteria-type benefit plans as well as fringe benefits more generally. Elasticity estimates for other benefits also serve as a useful comparison to our estimates for health insurance.
We find that workers are much more price sensitive to the out-of-pocket premium for fringe benefits other than health insurance than they are to health insurance. In fact, the price elasticity of the takeup of health insurance is essentially zero in all of our models, providing support for previous work that has found very small effects. However, workers are clearly sensitive to the price they pay for other fringe benefits. Those negative and significant effects are quite robust to a variety of model
specifications. The robust negative effects of price on the takeup of other benefits also helps to validate the survey procedure and thereby to lend support to our zero finding for the elasticity of health
insurance.
PREVIOUS LITERATURE
Of the previous literature, four studies are most closely related to this one: Chernew et. al. (1997), Blumberg, et. al. (2002), Cutler (2002), and Gruber and Washington (2003). Each of these studies examines the effect of premiums on the probability that workers eligible for employer health insurance will take up that coverage.1 Chernew et. al. examine this question using a sample of
low-choices of households with more than worker. The model is different than that estimated here but their opt out estimates imply higher (in absolute value) takeup elasticities than the studies focusing only on takeup.
income workers in small firms that offer health insurance, a subsample of the Small Business Benefit Survey. They restrict the sample to single workers with no other source of coverage. The study finds a negative and significant effect of the employee’s out-of-pocket premium on the probability of taking up employer coverage; however, the effect is quite small. Their results imply, for example, that direct premium subsidies to employees of 50%, quite a large subsidy by any measure, would increase takeup in this group only 3.2 points, from 89% to 92.2%.
Blumberg et. al. (2002) tackle the same question using the 1996 Medical Expenditure Panel Survey. Their approach is quite similar to that of Chernew et. al. but their data include a more nationally representative sample and many more individual-level variables that may help to explain the decision to participate in employer health insurance. These data produce the same bottom line: it would take very large subsidies to have any real effect on takeup rates of employer-provided insurance.
Neither of these two studies can fully account for two possible sources of endogeneity that could bias the estimated price effects. As both analyses point out, studies of this type are subject to the problem that workers are free to choose their jobs, thereby potentially inducing a correlation between the health plan premium they will face and unobservable components of their demand for insurance. Second, unobservable product quality that is correlated with price will produce price coefficient estimates that are biased toward zero. If workers are more likely to take up higher quality health plans and if quality and price are positively correlated, then inadequate controls for plan quality will result in price effects that are biased downward in absolute value. High-demand workers may also sort
2
Gruber and McKnight (2002) estimate that the percentage of all U.S. workers paying premiums on a pre-tax basis is one-half.
themselves into jobs with higher plan quality, inducing additional correlation between unobservable demand and price if price and quality are correlated. For all of these reasons, the estimates of the previously cited studies could be biased and a downward bias could explain why such small price effects are found in both of the above studies.
Cutler (2002) analyzes the effect of premiums on takeup in the context of rising premiums and declining takeup over the period 1987 to 2000. He addresses the problem of the endogeneity of the out-of-pocket premium by instrumenting using state tax rates. His OLS estimates are of very similar magnitude to previous estimates and his IV elasticity estimates are larger in absolute value (-0.09) but still not large. There are, however, potential problems with this instrument. State tax rates affect offer rates (Royalty (2000), Gruber (2002)) and as Cutler points out that could cause selection in the sample of firms that is correlated with the instrument. Also, the use of state tax rates as an instrument for the out-of-pocket premium is based on the fact that traditionally the employer-paid portion of the premium was not taxed but the employee portion had to be paid with post-tax dollars. With the advent of Section 125 plans, however, both the employee and the employer-paid portions of the premium can be paid with pre-tax dollars. According to the Bureau of Labor Statistics Employee Benefits Survey, 28% of private firms used Section125 plans in 1999.2 There is, therefore, still a need to look for alternative ways to address the problem of the endogeneity of premium in these models of employee takeup.
Gruber and Washington (2003) address the problem of the endogeneity of out-of-pocket premiums by using a policy change that affected the out-of-pocket premium of federal government
3
Several other studies address related questions but do not focus on employer-provided insurance nor do they focus on workers already offered insurance. Both Gruber and Poterba (1994) and Marquis and Long (1995) examine takeup in the nongroup market. Using exogenous changes in the tax code to identify the effects, Gruber and
workers over the period 1991-2002. Premium payments by federal postal workers were made post-tax prior to 1994 but pre-post-tax thereafter. This premium conversion occurred in 2000 for non-postal federal workers. This study estimates a price elasticity which, although negative and significant, is close to zero.
The exogenous source of variation in out-of-pocket premiums caused by the premium conversion for federal workers provides a better experiment for investigating price elasticity of takeup than prior studies had. Nonetheless, the policy change was not a perfect experiment. Variation in premiums is due entirely to variation in tax rates; yet tax rates (or all the information necessary for computing tax rates) are not available in the dataset and must be imputed. Additionally, although the variation in tax rates due to the policy change is the tax rate variation which is argued to be exogenous, the authors use other sources of variation in tax rates to identify the price elasticity as well. Variation in tax rates across states, time, and, especially, income group is much less likely to be exogenous than that associated with the premium conversions for federal workers. Federal workers are also a very select group and are unlikely to be representative of the U.S. workforce as a whole. Finally, as the authors point out, workers may not have been fully aware of the impact of the premium conversion on their out-of-pocket premiums. Lack of knowledge would certainly dampen the effect of the price change. Other mechanisms for subsidization may well be more transparent than the move to pre-tax premium payment and therefore could have a larger effect on takeup than is observed in this sample of federal workers. For these reasons, complementary approaches in examining this question remain important.3
Poterba find very large price elasticities for self-employed workers: a 1% increase in premium price is associated with a 1.8% decrease in the probability of health insurance coverage for the self-employed. The results of Marquis and Long are much more similar to those of Chernew et. al. and Blumberg et. al. once one accounts for the much smaller baseline takeup rate in the nongroup market. It is difficult to know to what extent the findings from the nongroup market can be extrapolated to the employer setting, especially when potentially very different populations, such as the self-employed, are the study population for the non-group findings.
4
There is a substantial literature on pension provision and takeup that we do not summarize because we do not address pension benefits in this paper.
Even fewer researchers have investigated the takeup of fringe benefits other than employer health insurance.4 A handful of previous work has explored some aspect of the provision of other insurance benefits but has produced little evidence about takeup decisions. For example Gentry and Peress (1994), find a significant effect of tax rates on employer decisions to offer vision and dental insurance and the estimates of Woodbury (1983) imply that health and life insurance benefits are highly substitutable with wages. These studies had only aggregate data available, however, and they had to rely on variation in tax rates, either by income-level (Woodbury) or by state (Gentry and Peress) to identify benefit price effects. The price variation available in the data employed here is more clearly exogenous and allows us to estimate the effect of premium on the takeup of a variety of fringe benefits in addition to health insurance.
DATA
The data were collected by International Planning and Research (IPR), a management consulting company for a project commissioned by the computer-maker NCR. In January and February of 2000, IPR surveyed 423 NCR employees at five sites. This group of employees was
5
Employees were randomly chosen within age, gender, and income groups. Approximately, 30% of employees invited to participate in the survey responded. The resulting sample very closely approximated the distribution of these characteristics in the NCR workforce. In the final report from IPR to NCR, weighting by actual demographic characteristics of the firm made no difference to the estimated effects or conclusions.
chosen to be representative of NCR’s U.S. workforce.5
Surveyed employees identified what choices they would make if offered a given menu of benefits and options for each of those benefits. While the choices were hypothetical, employees knew that this information was to be used to design changes to their true menu of benefits in order to align that menu of choices more closely to employee preferences. They therefore had a greater incentive to answer thoughtfully than may otherwise be the case with hypothetical questions. We address the hypothetical nature of the questions further when we discuss the advantages and disadvantages of the data.
NCR/IPR presented workers with a large set of possible benefits, including health insurance, dental insurance, vision care, long-term care insurance, and wellness benefits along with a price or “change in cash pay” associated with each possible choice. Surveys were computerized and were conducted in small group sessions of 8-12 employees. Human resource managers were on hand to answer questions about the offered benefits packages but there was no consultation among the respondents. The NCR human resources department also developed detailed online descriptive material to aid respondents in understanding each benefit category and the coverage provisions of each offered plan. Based on this information, the employee indicated whether she would choose to
participate in the particular benefit and, in some cases also the level of coverage.
employee only, employee plus one dependent, or employee plus two or more dependents. If an employee chose to participate, several options were typically available. In the case of health insurance, an employee could choose catastrophic coverage, an HMO, or a PPO. The catastrophic coverage option and the PPO also allowed for a choice between brand-name or generic drug coverage. The cost to the employee for each plan and coverage level was clear, with a display of the cumulative payroll deductions for the choices made constantly appearing in the upper right corner of the computer screen. For this study, a worker is defined to have taken up the health insurance benefit if they
participated in any of these plans at any coverage level.
In the case of dental insurance, as with health insurance, a worker could choose to opt out of benefits altogether, to cover only him- or herself, to cover self and one dependent, or to cover self and two or more dependents. Dental options included a plan with no orthodontia coverage, a plan with $1500 orthodontia coverage, a plan with $2500 orthodontia coverage for children only, and a plan with $2500 orthodontia coverage for all covered persons. We define takeup of dental benefits to be equal to one if the worker chose any of these plans at any coverage level.
The vision care benefits offered were somewhat simpler. The worker could choose among the following options: no vision care benefit, vision care discounts, two employee-only plans classified as “low” or “high” benefit, and two family plans also classified as “low” or “high” benefit. A worker was defined as taking up vision benefits unless he or she opted out of the vision benefit altogether.
We also analyze the decision to take up long-term care insurance and wellness benefits. NCR employees were offered the choice of no long-term care benefit, or long-term care benefits providing either $100, $200, or $300 in daily benefits. The wellness benefits options included fitness center
6
An example from the trade literature of generally how the procedure worked is provided in Hagens et. al. (2000). Note, however, that the example provided does not use actual data from the NCR experiment but is merely illustrative of the kind of procedure that was used at NCR.
7
To estimate the effect of premium on takeup, the survey design wherein the price of all health plans increased or decreased by the same percentage in the three different scenarios is an advantage since the price of all possible options and coverage levels rise by the same percentage relative to the opt out option. This allows us to examine takeup without simultaneously modeling the worker’s choice among offered plans or levels of coverage.
discounts, health information including Health Risk Assessments, $300 during open enrollment to use on wellness-related areas (smoking cessation, weight loss, exercise equipment, fitness center memberships, etc.), and an on-site fitness center. Participation in any level of long-term care or wellness benefits is defined as takeup of those benefits.
The hypothetical exercise undertaken by the NCR employees closely resembles the procedure followed by employees offered cafeteria-style benefits plans when making their actual choices among benefits.6 One key difference between this exercise and the actual choices made by workers during an open enrollment period, however, is that the NCR employees completed the exercise three times under three different price scenarios. It is this fact that will allow us to identify the effect of price on the takeup decision holding constant individual characteristics as well as plan quality. Employees began by making their choices under a baseline price scheme. They then went through the exercise a second and a third time, where, in one case, prices were 25% lower and in the other 25% higher than the base case scenario.7
In addition to the choice of benefits, NCR/IPR collected data from respondents on age, gender, race, income, years of tenure, job category, and location. Descriptive statistics are reported in Table 1 and Table 2. Takeup rates for these employees were higher than the national average but still did not approach 100% (Table 1). The takeup rate for the baseline prices was 93% for health insurance and
87% for dental insurance. Takeup was lower for the three other benefits; the lowest, for wellness benefits, was 41%. Out-of-pocket premiums for health plans under the base case pricing ranged from a low of $84/year for employee-only coverage under a catastrophic plan with generic drug coverage to a high of $1,530/year for a coverage of the employee plus two or more dependents for a PPO with brand name drug coverage. Single dental coverage without orthodontia was $136/year while the most costly dental plan was family coverage with the highest level of orthodontia coverage costing $391/year. The least expensive vision option was $30 while the most expensive was $195. The cost of long-term care insurance was an increasing function of age. For a 43-year-old worker, the cost of long-term care options ranged from $227-$680 annually. Wellness benefits ranged in cost from $25-$1000/year.
The main specifications of the takeup models will be conducted pooling observations on workers choosing any level of health insurance coverage since there is almost no switching between coverage levels (employee-only coverage versus employee plus one or more dependents) in response to price. More specifically, for workers enrolling in health coverage, we cannot reject the hypothesis that the coverage level is independent of the price level (p-value for the chi-squared test of 0.972).
ADVANTAGES AND DISADVANTAGES OF THE DATA
Though the question to be answered is most similar to those of the studies cited above, the data to be used are more similar to analyses employing stated choice methods (Louviere et. al. (2000)). In this approach, a researcher asks survey participants to make hypothetical choices or to rank
hypothetical alternatives that vary along the dimensions under study, allowing the researcher to infer the relative importance of characteristics of the alternatives on the stated choice or stated preference
ordering of the respondent. There are a number of advantages to this approach as compared to the usual observed choice approach based on market data. Louviere et. al. (2000) emphasize, for example, that observed alternatives frequently exhibit very little variation in certain characteristics, making it difficult or impossible to identify the effect of those characteristics on choices. For instance, if virtually all health plans include maternity benefits then it will be impossible to infer from observed data a willingness to pay for maternity benefits. A stated choice approach could overcome this problem. The data used in this paper do exhibit substantial price variation: from 25% below baseline to 25% above baseline. This is very useful in identifying a price effect.
The key benefit of these data that we want to emphasize, however, is that the variation in the key explanatory variable – the out-of-pocket premium – is exogenous. The study design holds constant plan quality while prices are varied, assuring that price effects are not biased by unobservable quality differences across plans. The exogenous variation in prices also assures that out-of-pocket premiums are not correlated with individual characteristics as may be the case with the data on actual choices of workers since those workers may have sorted themselves into firms based on the health plan premium or quality available at that firm. The possible endogeneity of out-of-pocket premiums is the most troubling possible source of bias in previous studies. We are able to circumvent that problem entirely with these data.
The primary disadvantage of stated choice data is that it is difficult to know whether stated choices accurately reflect the actual choices that would be made if the alternatives were not
8
Only a few studies have compared estimates obtained from revealed preference and stated choice data and those are for very specific applications. Some of these have found consistent results from models using the two types of data (see, for example, Spencer et. al. (1998) on water quality monitoring and the citations in Louviere et. al. (2000) Chapter 13). Others have found that hypothetical willingness to pay is larger than actual willingness to pay (Loomis (1997)). There is also evidence that greater knowledge of the good and greater “contextual realism” lessen any possible differences between hypothetical and actual choices (Paradiso and Trisorio (2001) and Louviere et. al. (2000)). The NCR survey had very high “contextual realism” as well as knowledge of the goods since it was designed to mimic an actual open enrollment exercise.
9
This raises the question of whether NCR workers might have tried to “game the system” by answering strategically rather than honestly. This is unlikely due to the complexity of the game. Because NCR was able to choose both the menu of options and the price, it would be difficult for an individual to identify the best strategy. For example, suppose a worker chose to opt out of a benefit at the high price, thinking that this would discourage NCR from raising the price paid by employees. This strategy might backfire since it would also signal to NCR that the worker did not value that benefit highly and possibly cause that option to be dropped from the menu of benefits. In addition, if workers were to follow the strategy just described, it would cause price elasticities to be overstated (in absolute value) which seems particularly unlikely given our very small estimated elasticities.
relying on what consumers say they will do compared with observing what they actually do” (p. 20).8 Ideally, in order to validate the survey procedure, we would compare the hypothetical choices of NCR workers to their actual choices made after the new benefits design was implemented. Unfortunately, we do not have data on the actual choices made by NCR employees and, even if we did, if would be difficult to make this comparison since the actual options offered under the new plan were not precisely the same as the hypothetical options of the survey. We do know, however, that the hypothetical choices at baseline pricing of medical and dental insurance, benefit plans very similar to the benefits previously offered by NCR, were consistent with past actual results. We also observe that the NCR respondents had a clear incentive to answer thoughtfully since they knew that the survey results were going to be used to redesign the menu of benefits they were offered.9 We have some evidence of respondents’ attentiveness to the exercise in the rational consistency of their responses. In more than 99% of the observations, takeup patterns in health insurance appears rational. That is, in less than 1% of the sample do we see a pattern such as opting out of coverage at the low price level but taking up
coverage at one or more of the higher prices. And, finally, we also have an internal check on the hypothetical choice procedure. We observe respondents’ stated choices for five different fringe benefits. We have a priori beliefs about the relative price sensitivity for some of those benefits. Most particularly, we believe that workers will be less price sensitive in decisions with respect to health insurance than they are in takeup decisions for other benefits. If NCR workers did not show greater price sensitivity to benefits other than health insurance or if they displayed no price sensitivity to any of the offered benefits, we might be skeptical that the procedure using hypothetical questions and stated choices elicited actual preference parameters. This is clearly not the case, however. NCR employees were price sensitive to all fringe benefits except health insurance. The ordering with respect to the magnitude of the estimated price elasticities is what we expected, providing some internal validation for the procedure.
The dataset does lack some information that would be very useful for this analysis. For example, NCR/IPR did not collect data on marital status, family composition, or access to other sources of health insurance. We address this as best we can by performing robustness checks on subsamples of the sample and by including interactions with price effects in order to identify differences in price sensitivity across groups. We discuss these sensitivity checks further in the results section below.
The final drawback of these data is that the sample is pulled from a single firm. These workers are unlikely to be entirely representative of the U.S. population as a whole and, in particular, they may have a higher demand for insurance than the general population since they have chosen to work for a large firm that offers both several types of insurance and several plans of each type. The estimates
10
The out-of-pocket premium index (OOP index) is defined as follows: = 100 in the baseline price scenario; = 75 in the low price scenario when all prices were 25% lower than baseline; =125 in the high price scenario when all prices were 25% higher than baseline. In order to make the small estimates easier to read, the models actually include OOP index % 10. Therefore, the coefficient on the price variable (OOP index % 10) measures the effect on takeup of a 10% change in price.
derived from this sample must therefore be read as complementary to those obtained in other studies of takeup, including the cross-section studies where the identifying price variation is less likely to be exogenous, and the estimates of Gruber and Washington (2003) using a sample of federal government workers, a second unrepresentative group. The consistency of the results using the clearly exogenous price variation produced using the hypothetical exercise at NCR with those results of several very different types of studies is both striking and reassuring.
ECONOMETRIC MODEL
Following previous work, we use binary probit models to estimate the effect of the worker’s out-of-pocket premium on the decision to accept or decline the health insurance offered by the employer. We will use the same type of model to estimate the takeup of each offered benefit: health insurance, dental insurance, vision benefits, long-term care insurance, and wellness benefits. The dependent variable will indicate whether the worker enrolls in any level of the benefit at a given price. The out-of-pocket price variable will measure the percentage increase or decrease relative to the base case pricing.10
It is worth considering whether or not the out-of-pocket premium is the appropriate premium measure to use in order to capture the price sensitivity of workers with respect to their fringe benefits. At NCR, as at many firms, the employer subsidizes many, if not all, fringe benefits. The out-of-pocket
price paid by the workers is not equal to the full price of the benefit. If workers believe that their individual wages are reduced by the amount of all subsidies paid on their behalf by the firm, then the total premium (employee share plus employer share) would be the appropriate premium measure. However, if wage offsets are not made on a worker-by-worker basis, even if the firm passes on the average cost of benefits to its workforce, workers will consider the out-of-pocket premium to be the relevant price in their decision-making.
Previous work has found no evidence that employees internalize the full premium cost.
Chernew et. al. show, in fact, that takeup of employer coverage increases with total premium, possibly reflecting unmeasured differences in quality across plans. The positive or insignificant effect of total premium, coupled with the negative and significant effect of the worker’s portion of the premium suggests, as the authors point out, that workers are “acting as if wages are fixed and the employee contribution is the relevant price of participation.” Blumberg et. al. confirm the results of Chernew et. al. on the relevance of out-of-pocket premium, rather than total premium, on the participation decision of workers. Cutler, too, finds that the relevant price variable is the out-of-pocket premium; however, he also includes total premium in some of his specifications in order to account for the increased value of insurance as healthcare costs rise. Cutler finds a positive and significant effect of total premium on takeup.
In addition to out-of-pocket premium, we also control for age, gender, race, income, years of tenure, and location. We account for the error structure that results from having three observations on each individual by allowing the error term to be correlated across observations for the same individual. From the probit model, we obtain estimates of the probability derivative with respect to each
continuous explanatory variable. For dummy variables, we report the difference in the probability evaluated at one and zero. Of prime interest is the effect of premium on the probability of enrolling in coverage and the implied price elasticity.
As discussed above, the advantage of these data as compared to that used in previous studies is that neither unobservable components of individual demand nor unobservable aspects of plan quality are correlated with the worker’s premium. Any estimated association between price and takeup cannot be biased due to a sorting of, say, high-demand workers into firms with both higher quality and higher priced plans since there is no opportunity for workers to choose jobs based on either plan price or quality. Plan quality is also constant across all three price regimes. This is critical since we would expect that workers would be more likely to take up high-quality plans and also that high-quality plans are likely to have higher premiums. It is the endogeneity of premium that most plagues previous work. The key advantage of these data is that premium is, by construction, exogenous.
In addition to our health insurance takeup models, we also estimate probit models of the decision to take up dental and vision coverage, long-term care insurance, and wellness benefits. The existence of several benefit insurance choices gives us a chance to verify the experimental procedure by exploring, for example, whether workers are more price sensitive for these auxiliary benefits, as we expect. These estimates also give us a useful point of comparison in understanding the magnitude of the estimated premium effects on health insurance and provide new evidence on price sensitivity in these other insurance markets.
We also estimate several other models in order to check the robustness of our results and to provide evidence on issues such as nonlinearity in price effects. We illustrate that our results are robust
to using a sample of workers not choosing family coverage and to a sample of workers with lower incomes. We also examine whether the price sensitivity of the takeup decision varies by demographic characteristics such as income, gender, or race.
RESULTS
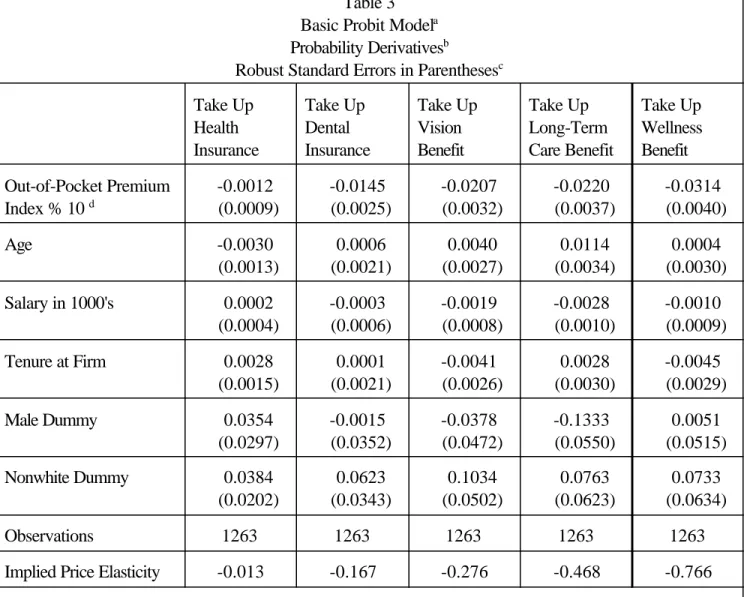
Probability derivative estimates from the basic probit model for all five fringe benefits are reported in Table 3. Before addressing the key results on premium effects, we briefly discuss the estimates of the effect of the control variables. Very few of the personal characteristics included in the model are significant. We find a negative and significant effect of salary on the probability of taking up both vision benefits and long-term care insurance, possibly due to decisions by higher income workers to self-insure in these dimensions. Age negatively affects the probability of taking up health insurance and positively affects the probability of taking up the long-term care benefit. The negative and significant effect of being male on the probability of taking up long-term care insurance may be
explained by the fact that on average women live longer than men. The negative effect of age on health insurance takeup is more puzzling. In unreported models, we found no particular pattern to this age effect and no interactions with age and other demographic characteristics. The Nonwhite dummy is estimated to have a positive and significant effect on takeup of vision coverage and marginally significant positive effects on health and dental insurance takeup. Last, tenure at the firm is significantly positively associated with the takeup of health insurance.
The key results are reported in the first row and the last row of the table. The first row reports the probability derivative of the out-of-pocket premium index % 10. The reported probability
derivatives are therefore the effect on takeup of a 10% change in the price to the worker. The last row of the table reports the price elasticity implied by the estimated price effect.
The out-of-pocket premium has essentially no effect on takeup of health insurance in this sample. The estimate is statistically insignificant, implying a price elasticity of only -0.013. As we see by looking at the results for the other benefits under study, this tiny price elasticity cannot be attributed to a more general insensitivity to the price of fringe benefits nor to the hypothetical nature of the exercise. For all other benefits, we find a statistically and economically significant price effects. The estimated price elasticities are -0.167 for dental coverage, -0.276 for vision benefits, -0.468 for long-term care insurance, and -0.766 for wellness benefits. The relative size of these price elasticities also accords with our expectations that workers might be more price sensitive for these other benefits than for health insurance and also that workers might be more sensitive to the price of wellness benefits and long-term care insurance than to the price of dental and vision benefits. The results for these other benefits clearly show that the insensitivity to price in the health insurance takeup decision is not due to the nature of the exercise. Workers were clearly able to understand the exercise and to change their choices in response to changes in prices. Price simply had very little effect on their health insurance takeup decision.
These estimates are estimates of the elasticity of takeup, not the elasticity of coverage since it is probable that some of the workers in the sample who opt out of coverage at their own firm have coverage through a working spouse. In this respect, the estimates are comparable to those of Cutler (2002). However, Chernew et. al. (1997) explicitly choose to look only at single workers so as to avoid the issues raised by some workers having other coverage options. Therefore, in their case, the
11
This intuition is confirmed by recent empirical work of Abraham et. al. (2003).
12
Including an interaction might also help account for differential tax effects for persons with different marginal tax rates. Taxes affect workers differently because the out-of-pocket premium is paid with pre-tax dollars, providing a larger tax effect for employees in higher tax brackets. However, this should not be a problem even in the basic model as we have specified it, since prices are expressed as a percentage of the baseline price.
elasticity of takeup is equal to the elasticity of coverage. The NCR data do not include information on marital status so it is not possible to estimate the model for single workers only. However, we would expect workers with other possible sources of coverage to be more price sensitive than workers with no other source of coverage.11 Therefore the inability to control for the presence of a spouse or a spouse’s insurance offer is unlikely to explain the zero price elasticity for health insurance that we find. As a check and in order to produce estimates more comparable to those of Chernew et. al., we estimate the model on a sample of workers who do not choose any level of family coverage at any price for any of the benefits that specify coverage levels. These results are presented in Table 4. Although this is certainly an imperfect way of distinguishing single from married workers, the results are similar enough to those from the basic model to alleviate concerns that our results suffer severely from not being able to control for marital status. The insignificance of premium on health plan takeup as well as the signficance of the out-of-pocket premium on the takeup of all other benefits remains. The pattern with respect to the magnitudes of the elasticities across the benefits is also maintained.
Many policy prescriptions for increasing takeup focus on low-income workers. This sample is not ideal for addressing that issue since the median income in the sample is substantially above the national median. But we can explore this issue in two ways. First, we estimated the model for each benefit including an interaction of income and premium in order to see whether there are differences in price elasticity by income level.12 The results are not reported because the interaction was insignificant
in all cases except for vision insurance. For vision insurance, we found that higher income workers were less price sensitive. In the case of health insurance, the income interaction was insignificant and the uninteracted price effect remained insignificant as in the base model. As a second way of investigating income effects, we limited the sample to workers earning less than $34,000/year. The results from this sample are presented in Table 5. The pattern of results again does not change. The magnitudes of the elasticities vary from the base model somewhat but the elasticity of health insurance takeup remains essentially zero.
We also estimated models with price interactions with age, gender, and race. Of the 15 possible interactions (five benefits x three interactions), only three were statistically significant at the 10% level. Men were estimated to be less price sensitive in the takeup of vision benefits and older workers and nonwhite workers were less price sensitive in the takeup of wellness benefits. Our overall conclusion is that price sensitivity for benefits differs little in these dimensions.
Last, in Table 6, we present estimates from models that allow for a nonlinear price effect. This specification addresses two main concerns. The first is simply that price responses may not be equal at all levels of the out-of-pocket premium. The second is that we might be finding no price effect on health insurance because the takeup rate at the baseline price is quite high– 93%. By estimating the model using dummy variables for the high price (125% of baseline) and the low price (75% of
baseline), we can address both of these concerns. We can test whether the absolute value of the effect of a 25% higher price is equal to the effect of a 25% lower price. Also, if the small price effect on health insurance is due to high baseline takeup, then we might not see much positive effect of price decrease but we would still expect to see a negative effect of a price increase. The nonlinear
13
One reason for high takeup rates is the availability of an inexpensive catastropic plan. Approximately, 11% of NCR workers chose a catastrophic plan at baseline pricing. In order to explore the effect of this option on takeup rates, we also estimated the model defining a person as taking up health insurance only if he or she enrolled in a plan other than a catastrophic plan. This is not the preferred specification for two main reasons. First, the catastrophic plans provide insurance against large losses and, in other data sources, a person so insured would be considered to have taken up coverage. Second, the price change is less clean in this case since the 25% increase and the 25% decrease in the price of coverage is in this case not defined only relative to the opt-out option that had no price change. Nonetheless, it is useful to know that the price elasticity for takeup of non-catastrophic coverage remains statistically insignificant, though it is larger in absolute value than that for the standard definition of takeup. The estimated coefficient on the OOP index in this model is -0.007 which is about one-half the size of the price coefficient for dental insurance.
specification allows for this whereas the linear model did not.
As we see in column 1 of Table 6, this specification continues to produce an insignificant price effect on health insurance. The last two rows present two formal tests. The second to last row presents the test statistic for testing the joint significance of the two price dummy variables. The last row reports a test of the hypothesis that the effect of a 25% higher price is equal to the negative of the effect of a 25% lower price. We cannot reject that the two price dummy variables are jointly equal to zero for health insurance. Both the low price dummy and the high price dummy are also individually insignificant. The two price variables are jointly significant for all other fringe benefits. Thus, it does not appear that the lack of price sensitivity in the health insurance takeup decision is simply due to high baseline takeup rates.
Not only does the price effect in this specification remain statistically insignificant, the point estimate also remains quite small. The estimated effect of a 25% price decrease is a 0.56 point increase in takeup. At baseline pricing, 7% of NCR workers do not take up health insurance. The estimated 0.56 point increase represents 8% of these unenrolled workers. Our estimates imply that large subsidies would still not induce a large proportion of those workers not currently enrolling in offered insurance to do so.13
For all benefits other than health insurance, the negative effect of a price increase is larger in absolute value than the positive effect of the same percentage price decrease. Although the formal test for equality of the two effects rejects equality only in the case of the vision benefit, the strong pattern in the point estimates is suggestive of some nonlinearity in the premium effects. In the case of these benefits, we think that these results are probably due to true nonlinearities in the sensitivity to premium and not simply a statistical artifact since baseline takeup rates for the other benefits are not nearly so high as is the case for health insurance.
CONCLUSION
Our findings from these unique data complement and confirm previous studies. We find, consistent with previous results, very small elasticities of takeup of health insurance with respect to the out-of-pocket premium. Most other analyses have suffered, however, from a possible bias due to price endogeneity that could cause workers to appear less price sensitive than they really are. We use data with exogenous price variation – prices are uncorrelated with worker demand and plan quality by construction – and still produce very low premium elasticities. We conclude that previous results are not merely a result of biases induced by price endogeneity but that employees who are already offered health insurance are, in fact, very insensitive to price in the takeup decision. We conclude that efforts to reduce the number of the uninsured via the employer-based system of health insurance will have to approach the problem broadly and creatively since it appears that a simple focus on health insurance subsidies will not provide the hoped for silver bullet. Subsidies in the range under consideration are unlikely to increase substantially the number of workers that voluntarily take up already offered
employer coverage.
Employers and policymakers should not, however, assume that the price insensitivity of workers in health insurance takeup should be extrapolated to takeup decisions of other fringe benefits. We find evidence that workers are much more price sensitive in decisions to enroll in dental insurance, vision coverage, long-term care insurance, and wellness benefits.
Table 1
Takeup Under Baseline Price Scenario Health
Insurance
Dental Insurance
Vision Benefit Long-Term Care Benefit Wellness Benefit 0.93 0.87 0.75 0.47 0.41 Table 2 Means (Standard Deviation) Age 43.17 (9.78) Male Dummy 0.58 (0.49) Nonwhite Dummy 0.15 (0.36) Salary 67,014.18 (26,519.88) Years of Tenure 15.14 (10.51) Out-of-Pocket Premium Index 100.00 (20.42)
Table 3 Basic Probit Modela Probability Derivativesb
Robust Standard Errors in Parenthesesc Take Up Health Insurance Take Up Dental Insurance Take Up Vision Benefit Take Up Long-Term Care Benefit Take Up Wellness Benefit Out-of-Pocket Premium Index % 10 d -0.0012 (0.0009) -0.0145 (0.0025) -0.0207 (0.0032) -0.0220 (0.0037) -0.0314 (0.0040) Age -0.0030 (0.0013) 0.0006 (0.0021) 0.0040 (0.0027) 0.0114 (0.0034) 0.0004 (0.0030) Salary in 1000's 0.0002 (0.0004) -0.0003 (0.0006) -0.0019 (0.0008) -0.0028 (0.0010) -0.0010 (0.0009) Tenure at Firm 0.0028 (0.0015) 0.0001 (0.0021) -0.0041 (0.0026) 0.0028 (0.0030) -0.0045 (0.0029) Male Dummy 0.0354 (0.0297) -0.0015 (0.0352) -0.0378 (0.0472) -0.1333 (0.0550) 0.0051 (0.0515) Nonwhite Dummy 0.0384 (0.0202) 0.0623 (0.0343) 0.1034 (0.0502) 0.0763 (0.0623) 0.0733 (0.0634) Observations 1263 1263 1263 1263 1263
Implied Price Elasticity -0.013 -0.167 -0.276 -0.468 -0.766
a Model also includes dummy variables for location of employee’s work site.
b Derivatives of the probabilities for continuous variables. Differences in the predicted probabilities evaluated at one and zero for each dummy variable. Other variables evaluated at means.
c Standard errors allow for correlation in the unobservables across observations for the same individual. dThe out-of-pocket premium index is defined as follows: = 100 in the baseline price scenario; = 75 in the low price scenario when all prices were 25% lower than baseline; =125 in the high price scenario when all prices were 25% higher than baseline. Therefore, the coefficient on OOP index % 10 measures the effect on takeup of a 10% change in price.
Table 4
Basic Probit Model on Workers Never Choosing Family Coveragea Probability Derivativesb
Robust Standard Errors in Parenthesesc Take Up Health Insurance Take Up Dental Insurance Take Up Vision Benefit Take Up Long-Term Care Benefit Take Up Wellness Benefit Out-of-Pocket Premium Index % 10 d -0.0017 (0.0032) -0.0156 (0.0053) -0.0167 (0.0056) -0.0177 (0.0078) -0.0422 (0.0103) Age -0.0059 (0.0033) -0.0074 (0.0048) -0.0017 (0.0054) 0.0037 (0.0063) -0.0128 (0.0052) Salary in 1000's -0.0009 (0.0017) -0.0014 (0.0022) -0.0033 (0.0025) -0.0076 (0.0029) 0.0017 (0.0024) Tenure at Firm 0.0025 (0.0043) 0.0027 (0.0057) -0.0019 (0.0068) 0.0218 (0.0071) 0.0043 (0.0062) Male Dummy -0.1338 (0.0757) -0.1632 (0.0954) -0.2570 (0.1105) -0.2035 (0.1081) 0.0402 (0.1058) Nonwhite Dummy 0.0723 (0.0606) 0.1027 (0.0862) 0.1847 (0.0885) 0.0443 (0.1208) -0.2227 (0.1005) Observations 333 333 333 333 333
Implied Price Elasticity -0.020 -0.203 -0.235 -0.377 -0.898
a Model also includes dummy variables for location of employee’s work site.
b Derivatives of the probabilities for continuous variables. Differences in the predicted probabilities evaluated at one and zero for each dummy variable. Other variables evaluated at means.
c Standard errors allow for correlation in the unobservables across observations for the same individual. dThe out-of-pocket premium index is defined as follows: = 100 in the baseline price scenario; = 75 in the low price scenario when all prices were 25% lower than baseline; =125 in the high price scenario when all prices were 25% higher than baseline. Therefore, the coefficient on OOP index % 10 measures the effect on takeup of a 10% change in price.
Table 5
Basic Probit Model on Workers Earning < $34,000/year Probability Derivativesa
Robust Standard Errors in Parenthesesb Take Up Health Insurance Take Up Dental Insurance Take Up Vision Benefit Take Up Long-Term Care Benefit Take Up Wellness Benefit Out-of-Pocket Premium Index % 10c -0.0005 (0.0010) -0.0224 (0.0105) -0.0314 (0.0128) -0.0322 (0.0168) -0.0304 (0.0177) Age -0.0009 (0.0016) 0.0010 (0.0060) -0.0068 (0.0051) 0.0101 (0.0106) -0.0159 (0.0093) Salary in 1000's 0.0013 (0.0022) 0.0095 (0.0154) 0.0193 (0.0110) 0.0066 (0.0226) -0.0044 (0.0216) Tenure at Firm -0.0001 (0.0002) -0.0099 (0.0092) -0.0072 (0.0056) 0.0115 (0.0127) 0.0118 (0.0125) Male Dummy -0.0632 (0.0747) -0.0499 (0.1678) -0.0301 (0.1358) -0.2365 (0.2155) 0.2672 (0.1643) Nonwhite Dummy -0.2019 (0.1612) -0.0942 (0.1824) -0.2242 (0.1866) 0.2372 (0.1738) 0.1662 (0.1927) Observations 108 108 108 108 108
Implied Price Elasticity -0.005 -0.277 -0.374 -0.575 -0.596
a Derivatives of the probabilities for continuous variables. Differences in the predicted probabilities evaluated at one and zero for each dummy variable. Other variables evaluated at means.
b Standard errors allow for correlation in the unobservables across observations for the same individual. cThe out-of-pocket premium index is defined as follows: = 100 in the baseline price scenario; = 75 in the low price scenario when all prices were 25% lower than baseline; =125 in the high price scenario when all prices were 25% higher than baseline. Therefore, the coefficient on OOP index % 10 measures the effect on takeup of a 10% change in price.
Table 6
Probit Model with Nonlinear Price Effecta Probability Derivativesb
Robust Standard Errors in Parenthesesc Take Up Health Insurance Take Up Dental Insurance Take Up Vision Benefit Take Up Long-Term Care Benefit Take Up Wellness Benefit Dummy for Price=75% of
Baseline Price 0.0056 (0.0063) 0.0282 (0.0094) 0.0244 (0.0130) 0.0370 (0.0172) 0.0574 (0.0168) Dummy for Price=125%
of Baseline Price -0.0005 (0.0043) -0.0447 (0.0104) -0.0796 (0.0158) -0.0729 (0.0174) -0.0989 (0.0190) Age -0.0030 (0.0013) 0.0006 (0.0021) 0.0040 (0.0027) 0.0114 (0.0034) 0.0004 (0.0030) Salary in 1000's 0.0002 (0.0004) -0.0003 (0.0006) -0.0019 (0.0008) -0.0028 (0.0010) -0.0010 (0.0009) Tenure at Firm 0.0028 (0.0015) 0.0001 (0.0021) -0.0041 (0.0026) 0.0028 (0.0030) -0.0045 (0.0029) Male Dummy 0.0354 (0.0297) -0.0015 (0.0352) -0.0380 (0.0472) -0.1333 (0.0550) 0.0052 (0.0515) Nonwhite Dummy 0.0384 (0.0202) 0.0623 (0.0343) 0.1033 (0.0502) 0.0762 (0.0622) 0.0734 (0.0634) Observations 1263 1263 1263 1263 1263
Test for Low Price and High Price Jointly Equal to Zero Chi-squared Statistic (p-value) 1.77 (0.412) 35.92 (0.000) 44.31 (0.000) 36.93 (0.000) 60.61 (0.000)
Test for Low Price = – High Price Chi-squared Statistic (p-value) 0.25 (0.614) 0.79 (0.374) 5.02 (0.025) 1.43 (0.233) 2.04 (0.153)
a Model also includes dummy variables for location of employee’s work site.
b Derivatives of the probabilities for continuous variables. Differences in the predicted probabilities evaluated at one and zero for each dummy variable. Other variables evaluated at means.
REFERENCES
Abraham, Jean, William B. Vogt, and Martin S. Gaynor. March 2003. “Household Demand for Employer-Based Health Insurance.” Unpublished working paper.
Blumberg, Linda J., Len M. Nichols, and Jessica S. Banthin. 2002. “Worker Decisions to Purchase Insurance.” International Journal of Health Finance and Economics.1:305-325.
Buchmueller, Thomas C. and Paul J. Feldstein. 1997. “The Effect of Price on Switching Among Health Plans.” Journal of Health Ecnoomics 16:231-47.
Chernew, Michael, Kevin Frick, and Catherine McLaughlin. 1997. “The Demand for Health Insurance Coverage by Low-Income Workers: Can Reduced Premiums Achieve Full Coverage?” Health Services Research 32(4):453-470.
Cooper P. and Schone B. 1997 "More Offers, Fewer Takers for Employment-Based Health Insurance" Health Affairs 16(6):142-149.
Cutler, David M. 2002. “Employee Costs and the Decline in Health Insurance Coverage.” NBER Working Paper 9036.
Farber, Henry S. and Helen Levy. 2000. “Recent Trends in Employer-Sponsored Health Insurance Coverage: Are Bad Jobs Getting Worse?” Journal of Health Economics. 19(1): 93-119 Feldman, Roger, Michael Finch, Bryan Dowd and Steven Cassou. 1989. “The Demand for
Employment-Based Health Insurance Plans.” The Journal of Human Resources 24(1):115-142.
Garrett, Bowen, Len M. Nichols, and Emily K. Greenman. 2001. “Workers Without Health
Insurance; Who Are They and How Can Policy Reach Them?” Washington, D.C.: The Urban Institute.
Gentry, William and Eric Peress. 1994. “Taxes and Fringe Benefits Offered by Employers.” NBER Working Paper #4764.
Glied, Sherry A. 2001. “Challenges and Options for Increasing the Number of Americans with Health Insurance.” Inquiry 38(2):90-105.
Gruber, Jonathan. 2002. “The Impact of the Tax System on Health Insurance Coverage.”
International Journal of Health Care Finance and Economics, 1:293-304.
Gruber, Jonathan and Robin McKnight. 2002. “Why Did Employee Health Insurance Contributions Rise?” NBER Working Paper #8878.
Gruber, Jonathan and James Poterba. 1994. “Tax Incentives and the Decision to Purchase Health Insurance: Evidence from the Self-Employed.” Quarterly Journal of Economics 109(3): 701-733.
Gruber, Jonathan and Ebonya Washington. 2003. “Subsidies to Employee Health Inruance Premiums and the Health Insurance Market.” NBER Working Paper #9567.
Hagens, J., Young, J., Kasparek, J., and Gaughan, L. 2000. "The Employee as Customer: Using Market Research to Manage Compensation and Benefits," Workspan, the Magazine of Worldatwork, September 2000, 30-37.
Loomis, John. 1997. “Evaluating the Validity of the Dichotomous Choice Question Format in Contingent Valuation.” Environmental and Resource Economics 10(2):109-23. Louviere, Jordan J., David A. Hensher, and Joffre D. Swait. 2000. Stated Choice Methods:
Analysis and Applications. Cambridge: Cambridge University Press.
Marquis S. and Long S. 1995. "Worker Demand for Health Insurance in the Non-group Market."
Journal of Health Economics, 14(1):47-63.
Paradiso, Massimo and Antonella Trisorio. 2001. “The Effect of Knowledge on the Disparity between Hypothetical and Real Willingness to Pay.” Applied Economics 33(11):1359-64.
Royalty, Anne Beeson. 2000. “Tax Preferences for Fringe Benefits and the Health Insurance Offered by Employers,” Journal of Public Economics, 75(2): 209-227.
Royalty, Anne Beeson and Neil Solomon. 1999. “Health Plan Choice: Price Elasticities in a Managed Competition Setting,”Journal of Human Resources, 34(1):1-41.
Short, Pamela Farley and Amy K. Taylor. 1989. “Premiums, Benefits, and Employee Choice of Health Insurance Options.” Journal of Health Economics 8:293-311.
Spencer, Michael A, Stephen K. Swallow, and Christopher J. Miller. 1998. “Valuing Water Quality Monitoring: A Contingent Valuation Experiment Involving Hypothetical and Real Payments.”
Agricultural and Resource Economics Review 27(1):28-42.
U.S. Census Bureau. 2001. Health Insurance Coverage: 2000. Washington, D.C. Current Population Report. http://www.census.gov/prod/2001pubs/p60-215.pdf.
Woodbury, Stephen H. 1983. “Substitution Between Wage and Nonwage Benefits.” American Economic Review 73(1):166-182.