Electricity Network Performance Report
2012/13
Electricity Network Performance Report
Contents
INTRODUCTION ... 1
1
PROFILE ... 2
1.1
Overview ... 2
1.2
Capital works program ... 4
2
NETWORK MANAGEMENT ... 6
2.1
Overview ... 6
2.2
Network Complaints ... 8
2.3
Customer Service Standards Reporting ... 9
3
NETWORK PLANNING ... 10
3.1
Overview ... 10
3.2
Design Planning Criteria Compliance Reporting ... 10
3.3
Demand Management ... 15
4
ASSET MANAGEMENT ... 17
4.1
Overview ... 17
4.2
Technical Service Standards ... 17
4.3
Quality of Supply ... 17
4.4
Distribution Reliability ... 19
4.5
Transmission Reliability ... 26
5
NETWORK SAFETY ... 27
5.1
Overview ... 27
5.2
Public Reportable Safety Incidents ... 28
5.3
Worker Reportable Safety Incidents ... 29
5.4
Major Incident Reports ... 29
6
CUSTOMER INSTALLATIONS ... 31
6.1
Reports against Customer Installation Safety Plans ... 31
6.2
Customer Installation Shock Reports ... 32
7
CONTESTABLE WORKS SCHEME ... 34
8
BUSH FIRE RISK MANAGEMENT ... 36
8.1
Monthly and Quarterly Reporting Process ... 37
8.2
Capital and Replacement Programs ... 38
8.3
Communicating with Customers ... 38
8.4
Liaison and consultation with Fire Services and others ... 39
9
PUBLIC ELECTRICAL SAFETY AWARENESS ... 40
9.1
Key Issues ... 40
9.2
PESAP Programs ... 40
10
POWER LINE CROSSINGS OF NAVIGABLE WATERWAYS ... 44
10.1
Risk Assessment ... 44
10.2
Water Crossing Program Progress ... 44
10.3
New Crossings ... 45
10.4
Water Crossing Incidents ... 45
11
COO DECLARATION ... 47
ATTACHMENT A: DISTRIBUTION RELIABILITY OF SUPPLY: DEFINITIONS AND
NOTES ... 48
ATTACHMENT B: TRANSMISSION RELIABILITY: NETWORK INDICES ... 52
ATTACHMENT C: SAFETY ... 54
ATTACHMENT D: DEFINITIONS ... 73
ATTACHMENT E: FEEDERS WHICH EXCEEDED INDIVIDUAL FEEDER
STANDARDS ... 74
ATTACHMENT F: GUIDELINES FOR THE REPORTING OF DEMAND
MANAGEMENT ... 80
Introduction
This report represents Ausgrid’s Electricity Network Performance Report for the 2012/13 financial year. The report has been prepared in accordance with the Electricity Supply (Safety and Network Management) Regulation 2008 and follows the outline provided by the NSW Department of Trade and Investment, Regional Infrastructure and Services. The report is designed to report actual performance in the 2012/13 financial year, against the criteria and key performance
indicators established in the Network Management Plan. This report therefore complements the Plan and details Ausgrid’s performance with respect to:
Network Management
Network Planning
Asset Management
Network Safety
Customer Installations
Accredited Service Provider Scheme
Bushfire Risk Management
Public Electrical Safety Awareness1 Profile
1.1 Overview
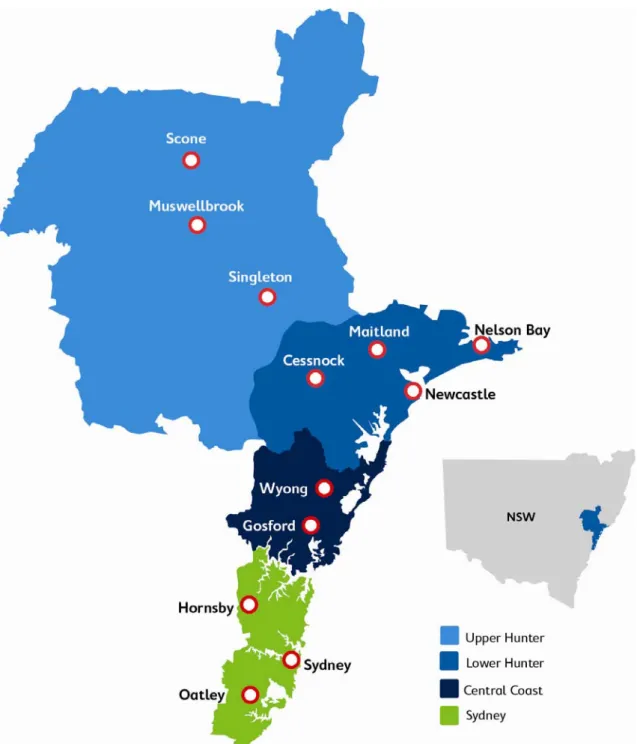
Ausgrid’s distribution network covers 22,275 square kilometres from Waterfall in Sydney’s south to Auburn in western Sydney and the upper Hunter Valley in the north. Ausgrid supplies electricity to 1.6 million customers in Sydney, the Central Coast and the Hunter Region in NSW. Its electricity network powers large and small businesses, as well as major industry including mining, shipping, tourism, manufacturing and agriculture. This report focuses on the performance of Ausgrid’s network business which is responsible for the distribution of electricity within our network area (Figure 1).
Ausgrid’s principal activities include:
the ownership and management of assets which make up the electricity distribution network
the distribution of electricity to customers through our distribution network
infrastructure–related construction and maintenance services
a range of other services including street lighting, customer connections, safety check ups, energy reviews, metering and 24 hour electrical repairs.Ausgrid’s distribution network includes:
a sub-transmission system of 33kV, 66kV and 132kV assets
a high voltage distribution system of 5kV, 11kV and 22kV assets
a low voltage distribution system of 240V and 415V assets
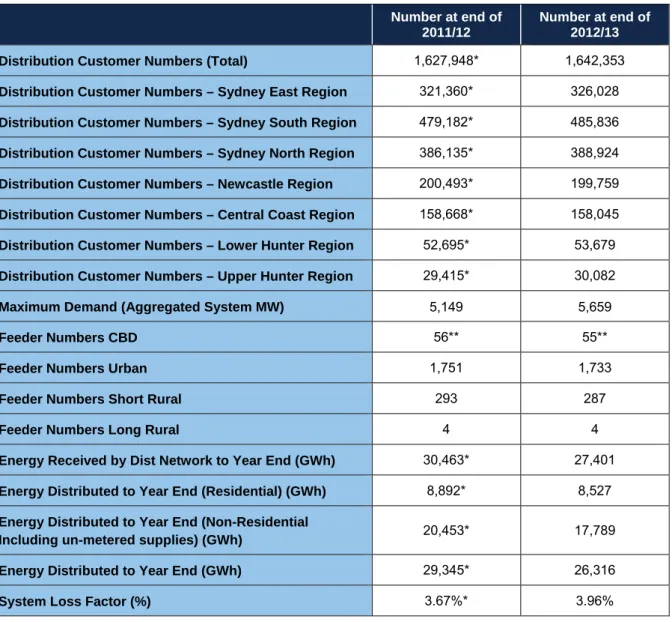
over 40,000km of overhead lines and underground cables.These assets are referred to throughout the report as “the network”. Ausgrid’s network customers are therefore customers who are connected to this network of assets. Table 1.1 sets out operator statistics in relation to Ausgrid's network.
Table 1.1 Distributor Statistics
Number at end of 2011/12
Number at end of 2012/13
Distribution Customer Numbers (Total) 1,627,948* 1,642,353 Distribution Customer Numbers – Sydney East Region 321,360* 326,028 Distribution Customer Numbers – Sydney South Region 479,182* 485,836 Distribution Customer Numbers – Sydney North Region 386,135* 388,924 Distribution Customer Numbers – Newcastle Region 200,493* 199,759 Distribution Customer Numbers – Central Coast Region 158,668* 158,045 Distribution Customer Numbers – Lower Hunter Region 52,695* 53,679 Distribution Customer Numbers – Upper Hunter Region 29,415* 30,082 Maximum Demand (Aggregated System MW) 5,149 5,659
Feeder Numbers CBD 56** 55**
Feeder Numbers Urban 1,751 1,733
Feeder Numbers Short Rural 293 287
Feeder Numbers Long Rural 4 4
Energy Received by Dist Network to Year End (GWh) 30,463* 27,401 Energy Distributed to Year End (Residential) (GWh) 8,892* 8,527 Energy Distributed to Year End (Non-Residential
Including un-metered supplies) (GWh) 20,453* 17,789 Energy Distributed to Year End (GWh) 29,345* 26,316
Number at end of 2011/12
Number at end of 2012/13
Transmission System (km) 1,024 7891
Transmission Substation (Number) 42 42
Sub Transmission System (km) 3,624 3,5341
Substation - Zone (Number) 188 192
Substation - Distribution (Number) 30,860 31,070
High Voltage Overhead (km) 10,159 10,117 High Voltage Underground (km) 7,634 7,822 Low Voltage Overhead (km) 13,642 13,060
Low Voltage Underground (km) 5,494 5,638
Pole (Number) 506,517 507,513
Streetlights (Number) 252,955 253,881
Employees (Full Time Equivalent Number) 5,869 5,713
Contractors (Full Time Equivalent Number) 856 622 Notes: Distances for overhead and underground lines are circuit km.
1 The implied reduction in network length is due to a number of; network reclassifications, reconfiguration of the network, and the correction of errors found in the FY11/12 data.
System Loss Factor (%) is the difference between electricity received by the distribution network and electricity received by customers (including un-metered supplies) divided by electricity received by the distribution network (allowing for embedded generation), expressed as a percentage.
* Data for 2011/12 has been revised in line with the audited Weighted Average Price Cap (WAPC) values and updated customer numbers.
** The count of CBD feeders for reliability purposes is the count of triplex system feeders and not x3 (which counts the 3 “legs” of the triplex feeder system.) The count of triplex feeder “legs” has been included in previous years but was amended in 2011/12 to align with current reliability reporting formats.
1.2
Capital works program
Ausgrid invested about $1.3 billion in the electricity network during 2012/13. A 12 month snapshot of completed works and maintenance activities across the electricity network is available on Ausgrid’s website, www.ausgrid.com.au.
Network investment included approximately $443 million on major substation and related feeder projects. During the year, seven major zone substation projects were commissioned in Empire Bay, Rathmines, Tomaree, Charlestown, Aberdeen, Potts Hill and Lake Munmorah. Feeder connections were completed from Lindfield to Kuringai, and Lake Munmorah.
More than 300 kilometres of high-voltage cable and 280 kilometres of low-voltage overhead and underground cables were installed in 2012/13, and more than 430 distribution substations were replaced. In addition, 277,780 planned maintenance inspections were completed across Ausgrid’s network.
Table 1.2 Capital works program trend
Previous Years Current Year
Year 2009/10 2010/11 2011/12 2012/13
Capital works program ($M)
2 Network
Management
2.1 Overview
In line with the Electricity Supply (Safety and Network Management) Regulation 2008, Ausgrid is required to prepare, implement and publish a Network Management Plan. The Plan is available at www.ausgrid.com.au. The Plan contains high level design, construction, operation and maintenance principles to manage network assets. It also incorporates principles applied to asset utilisation in the areas of safety, reliability, quality of supply and risk management. The Plan has four chapters which are outlined below.
Chapter 1: Network Safety and Reliability – sets out a framework for Ausgrid’s network to provide a safe and reliable, supply of electricity. This chapter details how Ausgrid:
manages its assets and sets out the basis for network investment
plans investments
provides reference to standards and protocols
identifies areas of the network that require development.Ausgrid’s network planning meets legislative, licence compliance and regulatory requirements and wider organisational objectives and business responsibilities. These include meeting customer expectations for a safe and reliable supply of electricity; managing safety, environmental and security risks associated with network infrastructure; and managing the financial performance of the business.
To deliver these objectives, the Network Management Plan focuses on: 1. Maintaining compliant infrastructure
Maintaining compliant infrastructure includes managing safety, environmental and infrastructure security risk. The environmental, safety and asset security obligations applicable to the network and services Ausgrid provides as a distributor are taken into account to develop Ausgrid’s network management strategies.
2. Network performance
Overall network performance is impacted by performance of individual assets, growth in demand, the number of new customer connections required and the extent of any imbalance between overall growth in demand for electricity and available supply.
In meeting these two primary objectives Ausgrid targets its investment expenditure to ensure network performance and compliance outcomes are achieved efficiently and prudently along with all regulatory and other obligations.
While the network performance and customer outcomes associated with the planning processes are stipulated in the Design, Reliability and Performance Licence Conditions, fault level management is not included in this document. The term fault level relates to how much energy can potentially be released during various fault scenarios - and this parameter varies across the network. Ensuring the fault rating of network assets is not exceeded is a significant asset integrity and safety issue, in addition to customer outcomes associated with faults. Management of fault levels is a critical element of the planning process and is an investment driver.
standards are displayed on an intranet platform for general access across Ausgrid and publicly available standards are also published on the Ausgrid website.
Chapter 2: Customer Installation Safety – addresses the management of safety in customer premises to the
point of connection between the customer’s electrical installation and the Ausgrid network.
Each year work is undertaken on electrical installations at thousands of customer properties throughout our distribution area. Ausgrid has responsibility for maintaining the distribution network, including the poles and wires required for connection of customer installations. All new and existing electrical work within a customer’s electrical installation remains the responsibility of the customer and their installing electrical contractor (contractor).
Customers need to employ licensed electrical contractors for any new or modified electrical work. Accredited Service Providers (ASPs) connecting customer installations to our electricity network need to be authorised by Ausgrid.
In preparation of the Customer Installation Safety Plan we have taken into account the NSW Codes of Practice: Service and Installation Rules, and the Installation Safety Management Code of Practice. There are no departures from these Codes, unless to adopt a higher safety standard. As required we also advise that customers operating electrical installations are subject to the requirements of the Service and Installation Rules of NSW and Ausgrid’s local requirements. Issues, initiatives and achievements relating to Ausgrid’s customer installations during 2012/13 are outlined in Chapter 6 of this report.
Chapter 3: Public Electrical Safety Awareness – aims to warn the public of hazards associated with
electricity, particularly in relation to our network. It is based on an assessment of risks associated with the system and an analysis of any accidents or incidents. Ausgrid’s approach to public safety focuses on:
risk assessment and risk reduction
education and communication
hazard response and procedures.The Public Electrical Safety Awareness Plan outlines Ausgrid’s commitment to safety and our responsibilities under the Electricity Supply (Safety and Network Management) Regulation 2008. The plan details:
Ausgrid’s approach to safety and potential hazards associated with the transmission and distribution of electricity
how “at risk” groups are identified
precautions to avoid electrical incidents.Programs are designed to create greater awareness of electrical safety amongst the general public and targeted groups, based on an analysis of safety incidents involving Ausgrid’s network and relevant data sources.
To communicate our safety message we use a number of communication tools and media to reach the at risk groups including TV, radio and print advertisements, education kits, personal presentations, bill inserts, printed material and the web. A range of safety initiatives and programs undertaken over the past year are outlined in
Chapter 9 of this report.
Chapter 4: Bushfire Risk Management – describes a management framework that when correctly
implemented will:
establish standards for vegetation management near electricity lines (particularly in bushfire prone areas)
reduce interruptions to supply that are related to vegetation
minimise the possibility of fire ignition by electricity lines and associated equipment.Ausgrid has an obligation to manage bushfire risks as they relate to our network. We do this by ensuring our assets are safe and are properly designed, constructed and maintained. We also provide information to owners of private power lines and our customers, describing the obligations associated with private power lines, so that they can do the same. This chapter outlines the procedures, standards, codes and guidelines Ausgrid applies to construction, operation and management of our network to achieve these objectives. It also provides an overview of Ausgrid’s bushfire risk management strategies in relation to key stakeholders including:
landowners and occupiers
local government
government agencies
emergency services.The Bushfire Risk Management Plan also outlines how we inform customers of their obligation to share bushfire prevention responsibilities with us to ensure privately owned overhead power lines are kept free of vegetation and are inspected, tested and maintained at regular intervals. Details of initiatives undertaken in the last year to improve systems to manage bushfire risk within Ausgrid’s network area are outlined in Chapter 8
of this report.
2.2 Network
Complaints
Table 2.1 Complaint Performance DataPrevious Years Current
Year
Year 2008/09 2009/10 2010/11 2011/12 2012/13
Complaints Total 1,409 1,121 1,420 1,471 1,973 Complaints per 1,000 Distribution
Customers
0.89 0.70 0.88 0.89 1.2
Complaints regarding Vegetation Management
126 118 242 146 266
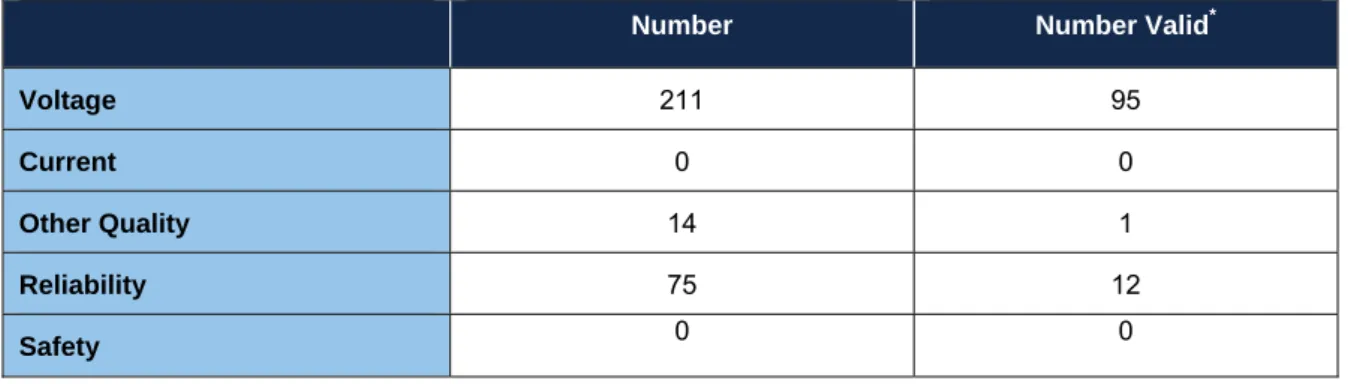
Table 2.2 Network Complaint Investigations Completed 2012/13
Number Number Valid*
Voltage 211 95
Current 0 0
Other Quality 14 1
Reliability 75 12
2.3 Customer
Service Standards Reporting
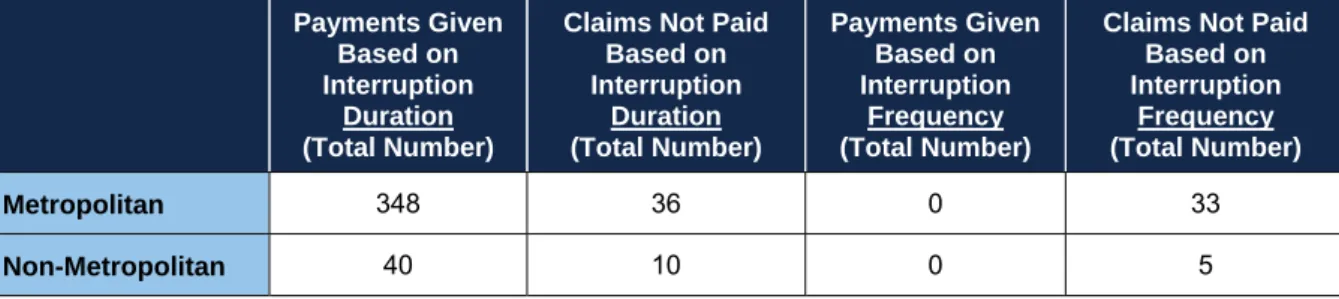
Table 2.3 Customer Service Standards 2012/13 DataPayments Given Based on Interruption
Duration (Total Number)
Claims Not Paid Based on Interruption Duration (Total Number) Payments Given Based on Interruption Frequency (Total Number)
Claims Not Paid Based on Interruption Frequency (Total Number) Metropolitan 348 36 0 33 Non-Metropolitan 40 10 0 5
3 Network
Planning
3.1 Overview
Ausgrid carries out planning at the strategic and project level, driven by prudent, strategic decisions which consider the capital investment required and the delivery of individual projects. Ausgrid’s network planning approach is outlined in the Network Management Plan and is consistent with the principles of the NSW Government’s Total Asset Management system. Drivers of investment include asset condition, capacity, reliability, customer connections and ensuring the safety and security of the network.
Ausgrid is required to comply with service standards in the Design, Reliability and Performance licence conditions imposed by the NSW Minister for Energy. The licence conditions facilitate the delivery of a safe and reliable supply of electricity. The AEMC’s report following their review of the NSW licence conditions is currently with the Government for consideration, and we are providing ongoing support to both this, and the associated national review. Ausgrid’s Electricity Network Operation Standards detail objectives for maintaining quality electricity supply.
Capital investment requirements in the subtransmission network are forecast in line with investment drivers across 25 network areas. Ausgrid also has three transmission plans: Sydney Metropolitan, Central Coast and Lower Hunter, which focus on the transmission network linking TransGrid’s bulk supply points to
subtransmission substations.
The spatial demand forecast is a critical process which supports planning, development of the capital program and the regulatory submission. The current forecast is the first full implementation of a new forecasting application and enhanced process, developed to provide greater efficiency and accuracy, and specifically including weather correction and load normalisation, broad-based demand management, and econometric growth projections.
3.2
Design Planning Criteria Compliance Reporting
The design planning criteria contained within the licence conditions set input standards to be used in planning the network, requirements for load forecasting and contingency planning methodologies intended to achieve operational outcomes.
The design planning criteria applicable to Ausgrid’s network are set out below. The implications of the design planning criteria contained in the licence conditions, and the accompanying notes, are explained in detail in Ausgrid’s Network Management Plan.
Design Planning Criteria
Network Element Load Type
Forecast Demand or
Expected Demand
Security
Standard Customer Interruption Time
Sub-transmission Line
CBD Any N-26
Nil for 1st credible contingency < 1hr for 2nd credible
contingency Urban &
Non-Urban ≥ 10 MVA N-11 < 1 minute
Urban &
Non-Urban < 10 MVA N
Network Element Load Type Forecast Demand or Expected Demand Security
Standard Customer Interruption Time
Sub-transmission Substation
CBD Any N-26 Nil for 1st credible contingency
< 1hr for 2nd credible contingency
Urban &
Non-Urban Any N-1 < 1 minute
Zone Substation
CBD Any N-26
Nil for 1st credible contingency < 1hr for 2nd credible
contingency Urban &
Non-Urban ≥ 10 MVA N-1
1 < 1 minute Urban &
Non-Urban < 10 MVA N2 Best practice repair time
Distribution Feeder
CBD Any N-13 Nil
Urban Any N-14 < 4 Hours5
Non-Urban Any N Best practice repair time
Distribution Substation
CBD1 Any N-13 Nil
Urban &
Non-Urban Any N
7 Best practice repair time 1 For a S
ub-transmission line – Overhead and Zone substation:
(a) under N-1 conditions, the forecast demand is not to exceed the thermal capacity for more than 1% of the time i.e. a total aggregate time of 88 hours per annum, up to a maximum of 20% above the thermal capacity under N-1 conditions.
(b) under N conditions, a further criterion is that the thermal capacity is required to meet at least 115% of forecast demand.
For a Sub-transmission line – Underground, any overhead section may be designed as if it was a Sub-transmission line – Overhead, providing the forecast demand does not exceed the thermal capacity of the underground section at any
time under N-1 conditions.
2 Under N conditions, thermal capacity is to be provided for greater than 115% of forecast demand.
3 The actual security standard is an enhanced N-1. For a second coincident credible contingency on the CBD triplex system, restricted essential load can still be supplied.
4 By 30 June 2014, expected demand is to be no more than 80% of feeder thermal capacity (under system normal operating conditions) with switchable interconnection to adjacent feeders enabling restoration for an unplanned network element failure. By 30 June 2019, expected demand is to be no more than 75% of feeder thermal capacity. In order to achieve compliance, feeder reinforcement projects may need to be undertaken over more than one regulatory period. In those cases where a number of feeders form an interrelated system (such as a meshed network), the limits apply to the average loading of the feeders within one system.
5 The timeframe is expected only, and is based on the need to carry out the isolation and restoration switching referred to in note 4. This standard does not apply to interim / staged supplies, i.e. prior to completion of the entire development or to excluded interruptions outside the control of the licence holder.
6 In the CBD area, N-2 equivalent is achieved by the network being normally configured on the basis of N-1 with no interruption of supply when any one line or item of electrical apparatus within a substation is out of service. The licence holder must plan the CBD network to cater for two credible contingencies involving the loss of multiple lines or items of electrical apparatus within a substation, by being able to restore supply within 1 hour. Restoration may be via
7 Urban distribution substations shared, or available to be shared, by multiple customers are generally expected to have some level of redundancy for an unplanned contingency (e.g. via low voltage manual interconnection to adjacent substations enabling at least partial restoration).
3.2.1
Design Planning Criteria Compliance Reporting
3.2.1.1 Our
Compliance
Plan
Ausgrid has established planning processes that reflect the licence design criteria which are applied to each of the transmission, sub-transmission, distribution and low voltage areas of the network.
Major projects are planned through a geographically based Area Planning approach that integrates replacement and growth planning and establishes forward plans to meet licence conditions.
Ausgrid completed a comprehensive review of all distribution feeders in January 2013, and has identified projects that will bring all distribution feeders into compliance. Projects are prioritised for delivery based on considerations such as scope, delivery time, cost, load at risk, and likelihood of the risk.
Ausgrid has set utilisation targets for distribution substations which maintain loading within the cyclic rating in accordance with the requirements of the licence conditions.
3.2.1.2 Progress Against Our Plan
Whilst Ausgrid has made progress during 2012/13 against our plan to comply with the licence conditions, we have a significant challenge ahead. Ausgrid has a large program of investments for the 2009-14 period which is driven by the need to systematically replace a large number of ageing network assets as well as the requirement to meet the mandatory licence conditions.
Whilst Ausgrid has completed all planning required to meet the Design Planning Criteria by 30 June 2014, the practicalities of delivery timing will mean that some elements will remain outside the design criteria beyond that date. This includes a number of distribution feeders, two City CBD zones which will not meet the criteria in summer 2015/16 and one 33kV feeder which will be retired by winter 2015.
3.2.1.3 Network Elements Not Complying with the Design Planning Criteria on 1 July 2013
On 1 July 2013, Ausgrid was required to comply with the Design Planning Criteria for any new network element where planning for that network element commenced after 1 December 2007. Existing elements need to be compliant with the design planning criteria by 1 July 2014.
Whilst most existing network elements are forecast to meet the Design Planning Criteria by 1 July 2014 as required, there are some network elements that currently do not meet the requirements of Schedule 1.
Table 3.1 Sub-Transmission Lines and Substations and Zone Substations Not Complying with the Design Planning Criteria on 1 July 2013
Element including Location, Customer Numbers, Element
Length/Capacity
Description of Non-Compliance and Reason
Proposed Remedial Actions and Timetable
City Central 132/11kV CBD zone, 22,763 customers, 128MVA secure capacity
Forecast to be non compliant in Summer 2012/13, 2013/14 and 2014/15 under N-2 conditions
Transfer load at 11kV to new Belmore Park and City North zones by summer 2015/16
City South 132/11kV CBD zone, 24,864 customers, 130MVA secure capacity
Forecast to be non compliant in Summer 2012/13, 2013/14 and 2014/15 under N-2 conditions
Transfer load at 11kV to new Belmore Park zone by summer 2015/16
Element including Location, Customer Numbers, Element
Length/Capacity
Description of Non-Compliance and Reason
Proposed Remedial Actions and Timetable
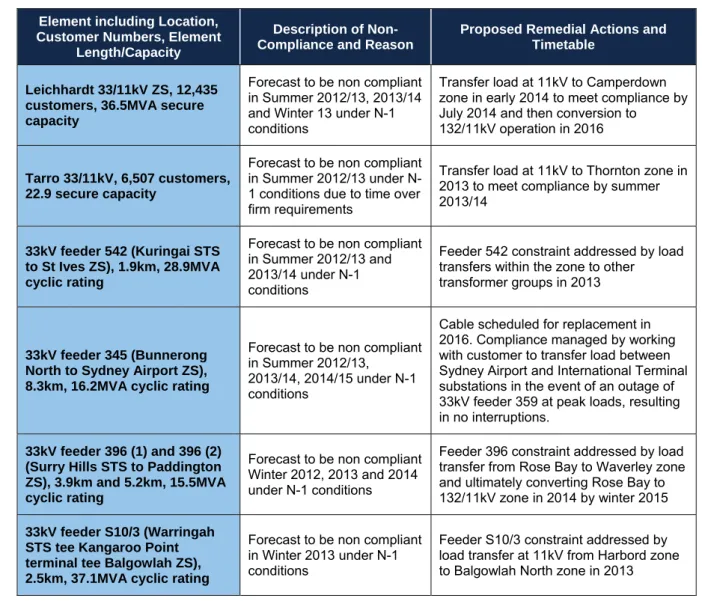
Leichhardt 33/11kV ZS, 12,435 customers, 36.5MVA secure capacity
Forecast to be non compliant in Summer 2012/13, 2013/14 and Winter 13 under N-1 conditions
Transfer load at 11kV to Camperdown zone in early 2014 to meet compliance by July 2014 and then conversion to
132/11kV operation in 2016
Tarro 33/11kV, 6,507 customers, 22.9 secure capacity
Forecast to be non compliant in Summer 2012/13 under N-1 conditions due to time over firm requirements
Transfer load at 11kV to Thornton zone in 2013 to meet compliance by summer 2013/14
33kV feeder 542 (Kuringai STS to St Ives ZS), 1.9km, 28.9MVA cyclic rating
Forecast to be non compliant in Summer 2012/13 and 2013/14 under N-1 conditions
Feeder 542 constraint addressed by load transfers within the zone to other transformer groups in 2013
33kV feeder 345 (Bunnerong North to Sydney Airport ZS), 8.3km, 16.2MVA cyclic rating
Forecast to be non compliant in Summer 2012/13,
2013/14, 2014/15 under N-1 conditions
Cable scheduled for replacement in 2016. Compliance managed by working with customer to transfer load between Sydney Airport and International Terminal substations in the event of an outage of 33kV feeder 359 at peak loads, resulting in no interruptions.
33kV feeder 396 (1) and 396 (2) (Surry Hills STS to Paddington ZS), 3.9km and 5.2km, 15.5MVA cyclic rating
Forecast to be non compliant Winter 2012, 2013 and 2014 under N-1 conditions
Feeder 396 constraint addressed by load transfer from Rose Bay to Waverley zone and ultimately converting Rose Bay to 132/11kV zone in 2014 by winter 2015
33kV feeder S10/3 (Warringah STS tee Kangaroo Point terminal tee Balgowlah ZS), 2.5km, 37.1MVA cyclic rating
Forecast to be non compliant in Winter 2013 under N-1 conditions
Feeder S10/3 constraint addressed by load transfer at 11kV from Harbord zone to Balgowlah North zone in 2013
Table 3.2 Distribution Feeder Summary Report by Class of Network Elements Not Complying with the Design Planning Criteria on 1 July 2013
CBD Total Number of Feeders Number of Feeders Without N-1 Capability (1 Minute)
Description and Reason for Non-Compliance
Proposed Remedial Actions and Timetable
167 0 Not applicable Not applicable
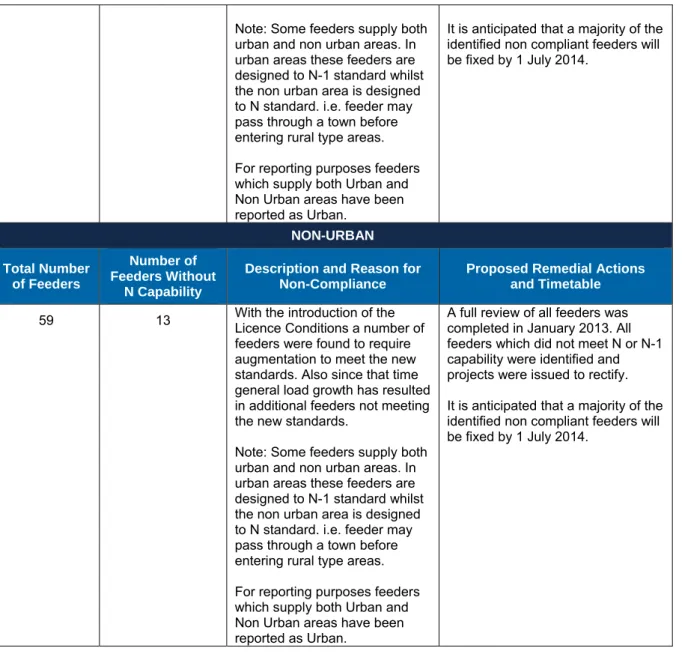
URBAN Total Number of Feeders Number of Feeders Without N or N-1 Capability
Description and Reason for Non-Compliance
Proposed Remedial Actions and Timetable
2,026 261 With the introduction of the Licence Conditions a number of feeders were found to require augmentation to meet the new standards. Also since that time general load growth has resulted in additional feeders not meeting the new standards.
A full review of all feeders was completed in January 2013. All feeders which did not meet N or N-1 capability were identified and projects were issued to rectify.
Note: Some feeders supply both urban and non urban areas. In urban areas these feeders are designed to N-1 standard whilst the non urban area is designed to N standard. i.e. feeder may pass through a town before entering rural type areas. For reporting purposes feeders which supply both Urban and Non Urban areas have been reported as Urban.
It is anticipated that a majority of the identified non compliant feeders will be fixed by 1 July 2014. NON-URBAN Total Number of Feeders Number of Feeders Without N Capability
Description and Reason for Non-Compliance
Proposed Remedial Actions and Timetable 59 13 With the introduction of the Licence Conditions a number of
feeders were found to require augmentation to meet the new standards. Also since that time general load growth has resulted in additional feeders not meeting the new standards.
Note: Some feeders supply both urban and non urban areas. In urban areas these feeders are designed to N-1 standard whilst the non urban area is designed to N standard. i.e. feeder may pass through a town before entering rural type areas. For reporting purposes feeders which supply both Urban and Non Urban areas have been reported as Urban.
A full review of all feeders was completed in January 2013. All feeders which did not meet N or N-1 capability were identified and projects were issued to rectify. It is anticipated that a majority of the identified non compliant feeders will be fixed by 1 July 2014.
Table 3.3 Distribution Substation Summary Report by Class of Network Elements Not Complying with the Design Planning Criteria on 1 July 2013
CBD Total Number of Substations Number of Substations Without N-1 Capability (1 Minute)
Description and Reason for Non-Compliance
Proposed Remedial Actions and Timetable
433 2 Substations loaded above 100%
of firm rating.
Remove overload by uprating existing substations or transferring load to adjacent substations. Overloads measured before February 2013 are due for rectification by 30 June 2014.
URBAN and NON-URBAN Total Number of Substations Number of Substations Without N Capability
Description and Reason for Non-Compliance
Proposed Remedial Actions and Timetable
31,088 236 Substations loaded above 100% of firm rating.
Remove overload by uprating existing substations, transferring load to adjacent substations via augmentation, installing new low voltage distributors or new distribution substations. Overloads measured before February 2013 are due for rectification by 30 June 2014.
Note: the Licence Condition for existing network elements does not take effect until 1 July 2014. Reporting should only be in relation to Clause 14.1 of the Licence Conditions i.e. for new network elements.
3.3 Demand
Management
Demand and capacity forecasts for the electricity supply system are identified through the planning process, and published in the Distribution Annual Planning Report (DAPR) on the Ausgrid website.
When forecasts indicate that a network need for demand related investment is required, Ausgrid will
investigate and where viable, develop and implement demand management (DM) projects to maintain network reliability. The DM investigation is comprised of five separate stages:
Stage 1: Identify network need for demand related investment
Demand management options are considered during the network planning process either as part of the development of potential credible options for individually identified network needs, or as part of the integrated consideration of potential credible options in Area Plan reviews.
Stage 2: Conduct demand management screening test for credible non-network solutions
Each potential network investment is screened to determine if it is reasonable to expect that a demand management or non-network solution could allow for a deferral or avoidance of the network investment. The screening test is a desktop study used to establish Ausgrid’s expectation of whether non-network options are technically and economically feasible. If the screening test concludes that it is reasonable to defer the proposed network infrastructure project, a Non-network options report will be issued and the options investigation process will be initiated.
Stage 3: Conduct demand management investigation including community consultation
The investigation process seeks to identify potential cost effective demand management options that could defer the network investment, and to identify the size, timing and budget costs of these feasible options. Based on the demand reduction requirements in the demand management screening test, the investigation stage identifies potential non-network solutions to achieve the demand reductions. Options are identified using Ausgrid’s existing knowledge, via public consultation, field visits to customer sites and discussions with major customers. The investigation identifies the amount of demand reductions available and the likely cost of each non-network option identified.
Stage 4: Select preferred non-network option, where viable and cost effective
Any feasible DM options are considered for development alongside network augmentation options.
Stage 5: Implement demand management solution
If a feasible DM option is determined to be the most economical solution, it is implemented with clear deliverables in terms of demand reduction, timing and cost.
A more detailed summary of this DM process is provided on Ausgrid’s website.
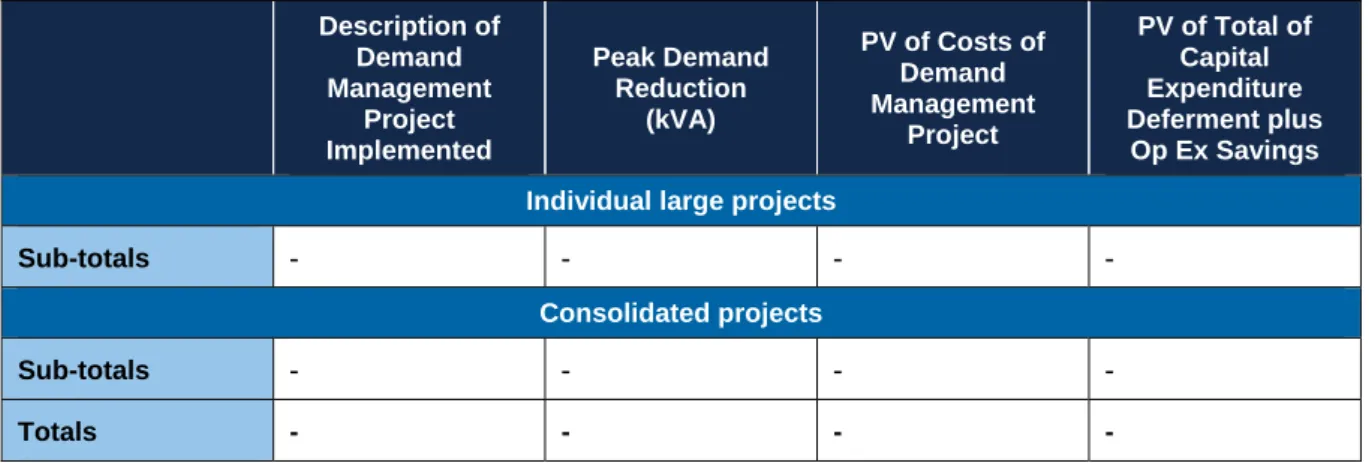
Table 3.4 Demand Management Projects Implemented During 2012/13*
Description of Demand Management Project Implemented Peak Demand Reduction (kVA) PV of Costs of Demand Management Project PV of Total of Capital Expenditure Deferment plus Op Ex Savings Individual large projects
Sub-totals - - - -
Consolidated projects
Sub-totals - - - -
Totals - - - -
* Ausgrid continued implementation of two demand management projects in 2012/13 at Medowie and North West Pennant Hills which have been reported in previous years. There were no new projects approved in this reporting year. Explanatory notes for Table 3.5:
Reports are required for large projects reported individually and for small projects reported collectively. Optionally, small projects may be individually listed, but must not be counted again in the consolidated report. Small projects could conveniently be grouped into headings such as: Customer Negotiations (Demand Reduction) or Installation of Local Generator etc. A large project is defined as proposed network expansions or augmentations, which would cost in excess of $500,000. Such large projects may be at zone substation level. Demand reductions should relate to permanent reductions only, and are the figures for the reporting year.
Table 3.5 Demand Management Investigations in 2012/13 Found Non-Viable**
Description of Potential Demand Management
Project
Investigated and Reason for Non-viability PV of Costs of Investigations
1 Beresfield Zone Substation The DM investigation was initiated. This investigation is still in progress. $3,454
2
Jannali Zone Feeders 2 & 9
The screening test was completed and concluded that DM would not be a cost effective option to enable
deferral of the supply side project. $2,807 (est)
3
Homebush Bay Zone Additional Transformer
The screening test was completed and concluded that DM would be a cost effective option to enable deferral of the supply side project. However due to a
subsequent change in the demand forecast, the
demand reductions were no longer required. $16,265
4 South Greenacre Park Zone
Development
The screening test was completed and concluded that DM would not be a cost effective option to enable
deferral of the supply side project. $2,974
5
Darling Harbour Zone Development
The screening test was completed and concluded that DM would not be a cost effective option to enable
deferral of the supply side project. $2,641
** In 2012/13 Ausgrid changed the process by which demand management options are considered in the network planning process, with DM Screening Tests now primarily integrated into the Area Plan reviews. In future years Ausgrid
4 Asset
Management
4.1 Overview
Ausgrid’s philosophy is that an integrated asset management system forms the backbone of an effective service delivery program. Ausgrid believes that through the integration of all facets of asset management, including design, procurement, maintenance activities, renewals/replacements, capital investment, condition monitoring and continuous improvement, it will deliver its business and strategic objectives. These objectives are established and documented in the Network Maintenance Plan. The service delivery program is essential to preserve the engineering integrity of assets and their continued fitness for use within the electrical system. This will enable Ausgrid to meet its commercial obligations and statutory responsibilities under the Electricity Safety Act and Occupational Health and Safety Regulation.
The asset management strategies, models and processes adopted by Ausgrid are consistent with the elements of a total asset management system as identified in the NSW Government’s Total Asset Management (TAM) Manual.
4.2
Technical Service Standards
Electricity delivered by Ausgrid’s network has particular characteristics including some interruptions to supply caused when power lines are damaged by storms, bushfires and accidents. Ausgrid’s objective is to achieve the best possible overall quality and reliability of our electricity network, given the condition and utilisation of network assets and the funding available to maintain and augment the electricity network. In addition, Ausgrid makes all reasonable and practicable efforts to ensure that in any financial year, it meets the targets set by NSW Trade & Investment, in respect to reliability standards, quality standards and individual feeder standards. The NSW Code of Practice - Electricity Service Standards1 provides a framework for supplying electricity customers on the Distribution Network. Ausgrid’s technical document Electricity Network Operation Standards2
(ENOS) sets out Ausgrid’s standards for Network Reliability and Quality of Supply that customers can expect from Ausgrid’s network.
Further technical information relating to service standards of Ausgrid’s network and supply commitments can be found on the Ausgrid website www.ausgrid.com.au or through the Ausgrid Contact Centre on 13 1365.
4.3 Quality
of
Supply
4.3.1 Overview
It is not possible to supply a customer with the idealised voltage and current due to the physical nature of the network and the characteristics of the customers’ loads. Ausgrid’s objective is to achieve the best possible overall supply quality of our electricity network, given the condition and utilisation of existing network assets, within the funding available to maintain and augment the electricity network. The National Electricity Rules require the Distribution Network Service Providers to establish Planning levels for a range of Supply Quality parameters.
At Ausgrid, monitoring for supply quality is undertaken by a number of means including fixed meters at Distribution Substations, random Power Quality (PQ) surveys at customer premises and participation in the Long Term National Power Quality Survey conducted by the University of Wollongong.
4.3.2 Performance
Data
4.3.2.1 Results from the Ausgrid Low Voltage Network Power Quality Survey
In 2012/13, Ausgrid began its new Standards based Supply Quality monitoring project, the Ausgrid Low Voltage Network Power Quality Survey. Ausgrid monitored 206 randomly selected Low Voltage customer sites for one week using temporarily installed power quality meters. These meters meet the highest accuracy
1http://www.energy.nsw.gov.au/electricity/network-connections/electricity_connect_code_of_practice_electricity_service_standards.pdf 2http://www.ausgrid.com.au/~/media/Files/Network/Documents/ES/ENOS_Oct2011.pdf
requirements (Class A) as specified in AS/NZS 61000.4.30. As this is the first year of the survey, year on year comparison will not be possible until the next reporting period.
The sites were evaluated for compliance against the relevant standards:
Range of Supply Voltage – AS 61000.3.100
Voltage Unbalance – AS/NZS 61000.2.2
Harmonic Content of the Voltage Waveform – AS/NZS 61000.2.2
Voltage Fluctuations (Flicker) – AS/NZS 61000.2.2Of the 206 sites, five sites were excluded due to insufficient data. The following sections describe the performance of the 201 sites to the relevant standards:
a) Range of Supply Voltage
AS 61000.3.100 which is written to a nominal low voltage supply of 230V, states that the 99th percentile (V99%) of the 10 minute average voltage readings for a 1 week survey should be less than 253 Volts and that the 1st percentile (V1%) of the 10 minute average voltage readings for a one week survey should be greater than 216 Volts.
In the survey all sites complied with the V1% limit and approximately 70% of sites complied with the V99% limit. The high V99% figure is a consequence of the network being historically designed for a nominal 240V range.
Based on the survey results, a relatively small drop in peak voltages of around 1.5% (based on 230V) would enable Ausgrid to meet a probabilistic planning level of at least 95% of the network delivering voltage within the AS 61000.3.100 compliance range.
Ausgrid’s 230V migration program is progressively delivering a voltage range reduction using adjustments of zone substation voltage regulation settings and distribution substation tap changes. The benefits of this program should begin to be seen in the 2013-14 reporting period with the expectation that a higher percentage of the LV sites will meet the limits.
b) Voltage Unbalance
Voltage unbalance is a condition in which the three phase voltages differ in amplitude and/or are displaced from their normal 120 degrees phase relationship.
The results of the survey show that voltage unbalance for all measured sites with three phase connection were under the Compatibility Level of 3% as specified in AS/NZS 61000.2.2. The compatibility level is a reference value for trouble-free operation of items of equipment connected to the network.
All measured sites were compliant for Voltage Unbalance.
c) Harmonic Content of the Voltage Waveform
Harmonics are sinusoidal voltages having frequencies that are whole multiples of the frequency at which the network is designed to operate (50 Hz). Total Harmonic Distortion is a measure of the harmonics in the supply voltage and is the sum of the powers of all harmonic voltages present compared to the fundamental (50Hz) voltage.
The results of the survey show that the Total Harmonic Distortion (THD) was at or below 3.6% against the Compatibility Level of 8% THD for Low Voltage as specified in AS/NZS 61000.2.2.
All measured sites were compliant for THD.
d) All individual harmonics apart from the 15th harmonic (i.e. 750 Hz) were compliant. For the 15th
harmonic, about 30% of measured sites were above the 0.3% compatibility level in AS/NZS 61000.2.2 (maximum recorded level was 0.5%). This is not seen as a significant issue in terms of causing trouble for equipment operation and it may be appropriate for the compatibility level to be increased - noting that New Zealand has chosen a higher limit of 1.8% as the Compatibility Level for the 15th Harmonic.
Voltage Fluctuations (Flicker)
Short Term Flicker (PST)
The results of the survey show that the majority (approximately 95%) of sites met the Short Term (PST) compatibility level for flicker of 1.0.
Long Term Flicker (PLT)
The results of the survey show that just over 90% of sites met the Long Term compatibility level (PLT) for flicker of 0.8.
Long term flicker (PLT) is higher than short term flicker (PST) due to the lower limit against which it is assessed (0.8 versus 1.0).
Inspection of the results show that a number of the sites with high levels of Flicker were in proximity of an Electric Arc Furnace (EAF) that is injecting high levels of Flicker onto the network. Ausgrid is planning to investigate potential mitigation methods for reducing the flicker from the EAF, however no issues have been reported by customers in relation to the EAF.
4.3.2.2 Results from Distribution Monitoring and Control Program (DM&C)
A set of 1 week’s data (recorded in April 2013) for a sample set of 1090 Distribution Transformers was analysed for Voltage performance, and was compared with data gathered from 225 Distribution Transformers in April 2012.
For Voltage, the results indicate on average, there has been a 1 Volt drop in the Median and 99th percentile values between 2012 and 2013 measured data.
Over time, as Ausgrid progresses its plan to reduce the average network voltage from around 250V to around 240V, a corresponding reduction will be observed in these readings.
4.4 Distribution
Reliability
4.4.1 Overview
This report has been prepared in accordance with the ‘Design, Reliability and Performance licence conditions’ imposed by the Minister for Energy and Utilities on 1 December 2007 and the standards issued by the ‘Steering Committee on National Regulatory Reporting Requirements’ (SCNRRR).
Two related indices are applied when reporting reliability. The first, SAIDI, is commonly referred to as the “Reliability Index” and represents the average number of customer minutes lost by all network customers. SAIFI represents the average number of interruptions for all customers.
The classification of Ausgrid’s approximately 2,100 high voltage distribution feeders into the categories CBD, Urban, Short Rural and Long Rural is reviewed at the start of each annual reporting period. To cater for augmentation work through the year new feeders are classified at the time of commissioning.
Reliability reporting uses the IEEE methodology for defining Major Event Days as outlined in the Design, Reliability and Performance licence conditions (Major Event Day is defined in Attachment A, see page 49) There are three instances where Ausgrid departs from the Definitions detailed in Attachment A to this report – departures in relation to Notes 2 and 3 of Table A.1 Reliability Measures, and in regard to the calculation for the Major Event Day Threshold (Tmed):
1. Note 2 – Ausgrid measures and records customers affected and the customer base on a daily basis. Reliability performance indices are calculated on a daily basis rather than using the average of the number of customers at the beginning and the end of the reporting period. The daily calculation method provides a more representative customer performance at the time of the event.
2. Note 3 – Ausgrid does not exclude inactive accounts. There are natural time delays in updating customer account details into the real-time Outage Management System, particularly where Ausgrid relies on information from other electricity Retailers. Ausgrid considers the recording of reliability performance for all active premises (whether the premise is vacant or not) to be a practical administrative outcome. This action has little effect on reported reliability performance. The inclusion of vacant premises increases both the customers affected (numerator) and the customer base (denominator) of the Indices calculations. 3. In regard to the calculation for the Major Event Day Threshold (Tmed), the Design, Reliability and
Performance Licence Conditions review working group had agreed, in March 2010, that the Tmed calculation should be consistent with the Australian Energy Regulator (AER) Tmed calculation method. The Design, Reliability and Performance Licence Conditions require (Schedule 6) that Planned Outages be included in the daily SAIDI dataset for calculation of the Tmed value. The AER requires (STPIS definitions November 2009) that Planned Outages be excluded from the daily SAIDI dataset for calculation of the Tmed value.
This agreed change to the Tmed calculation has not yet been amended in the Design, Reliability and Performance Licence Conditions document. However, Ausgrid has applied this change to the 2010/11, 2011/12 and 2012/13 reliability performance reporting to ensure consistency with the AER reliability performance reporting definitions, as agreed with the Minister’s Office.
4.4.2
Organisational Performance (Normalised) Trend
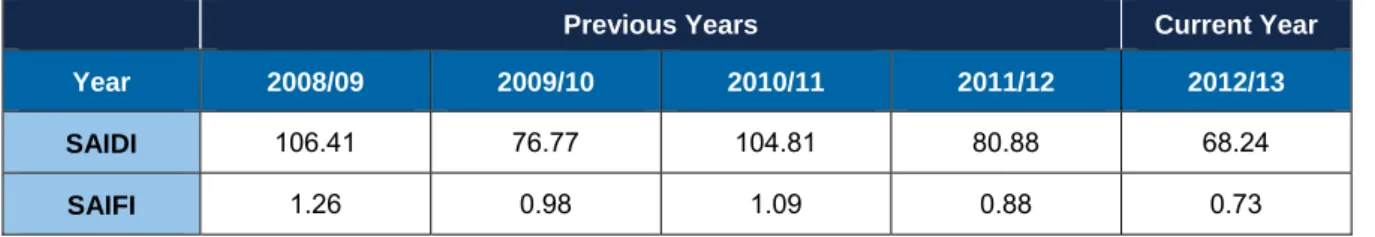
Table 4.1 Organisational Performance Trends (Normalised)
Previous Years Current Year
Year 2008/09 2009/10 2010/11 2011/12 2012/13
SAIDI 106.41 76.77 104.81 80.88 68.24
SAIFI 1.26 0.98 1.09 0.88 0.73
Figure 2 Organisational Performance Trends (Normalised)
4.4.2.1 Comment
on
Performance
The 2012/13 performance for both SAIDI and SAIFI was the best result in the last five years and has been trending downwards over this period. This year’s results can be attributed to the Regulatory Works Program as well as favourable weather conditions.
There were two Major Event Days for 2012/13, firstly on 10 August, 2012 (6.03 SAIDI for the day) and secondly on 23 February, 2013 (5.80 SAIDI for the day). Both events were predominantly due to strong wind storms impacting the entire Ausgrid Network.
The historical reliability performance has been re-calculated using the more accurate OMS connectivity data and a consistent application of the current exclusion rules across all years. As a consequence reliability figures are different from figures provided in past reports.
4.4.3
Organisational Detailed Performance Current Year
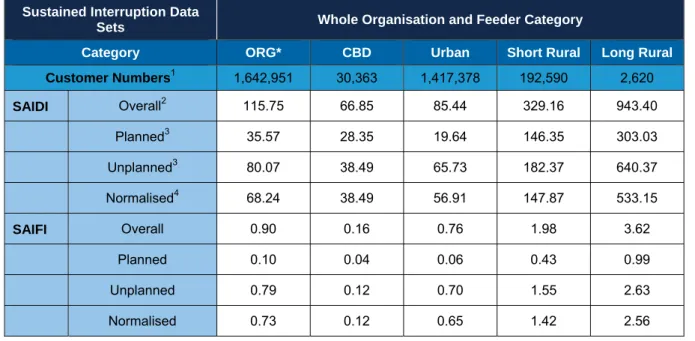
Reliability data sets for SAIDI and SAIFI are reported for the whole organisation and feeder categories in Table 4.2.
Table 4.2 Organisational Detailed Performance 2012/13
Sustained Interruption Data
Sets Whole Organisation and Feeder Category
Category ORG* CBD Urban Short Rural Long Rural
Customer Numbers1 1,642,951 30,363 1,417,378 192,590 2,620 SAIDI Overall2 115.75 66.85 85.44 329.16 943.40 Planned3 35.57 28.35 19.64 146.35 303.03 Unplanned3 80.07 38.49 65.73 182.37 640.37 Normalised4 68.24 38.49 56.91 147.87 533.15 SAIFI Overall 0.90 0.16 0.76 1.98 3.62 Planned 0.10 0.04 0.06 0.43 0.99 Unplanned 0.79 0.12 0.70 1.55 2.63 Normalised 0.73 0.12 0.65 1.42 2.56 Notes:
*ORG Refers to the average performance of the organisation overall. 0.00 20.00 40.00 60.00 80.00 100.00 120.00 2008/09 2009/10 2010/11 2011/12 2012/13
Global SAIDI Performance (IEEE)
0.00 0.20 0.40 0.60 0.80 1.00 1.20 1.40 2008/09 2009/10 2010/11 2011/12 2012/13
1 Customer numbers as at the end of June 2013 for the purposes of reliability indices only. Refer to Table 1.1 for the total of customers served.
2 Overall performance represents the total performance experienced by our customers, irrespective of cause or origin of the fault.
3 Planned and Unplanned performance is the Distribution Network Interruptions (DNI) that have all the excluded interruptions removed, except for Major Event days, as defined in Attachment A, in accordance with the "Steering Committee on National Regulatory Reporting Requirements" (SCNRRR) standards i.e. excludes TransGrid and load shedding events, Emergency Services instructed events, momentary interruptions and interruptions caused by a customer installation failure.
4 Normalised Distribution Network (NDN) performance is the DNI performance with the Major Event Days excluded, and represents the events that Ausgrid is expected to manage and be responsible for. The Major Event Days that have been excluded are defined in Table 4.7.
4.4.4
Reliability Report against Standards
Table 4.3 CBD Feeder Performance (Normalised) Trend
Previous Years Current Year
Year 2008/09 2009/10 2010/11 2011/12 2012/13 SAIDI Actual 41.24 34.94 4.57 5.36 38.49 Target 51 48 45 45 45 SAIFI Actual 0.55 0.10 0.05 0.04 0.12 Target 0.32 0.31 0.3 0.3 0.3
Table 4.4 Urban Feeder Performance (Normalised) Trend
Previous Years Current Year
Year 2008/09 2009/10 2010/11 2011/12 2012/13 SAIDI Actual 91.48 64.16 88.3 71.45 56.91 Target 86 84 80 80 80 SAIFI Actual 1.13 0.87 0.97 0.78 0.65 Target 1.24 1.22 1.2 1.2 1.2
Table 4.5 Rural Short Feeder Performance (Normalised) Trend
Previous Years Current Year
Year 2008/09 2009/10 2010/11 2011/12 2012/13 SAIDI Actual 214.43 179.25 236.88 150.92 147.87 Target 340 320 300 300 300 SAIFI Actual 2.31 1.95 2.08 1.62 1.42 Target 3.7 3.4 3.2 3.2 3.2
Table 4.6 Rural Long-Feeder Performance (Normalised) Trend
Previous Years Current Year
Year 2008/09 2009/10 2010/11 2011/12 2012/13 SAIDI Actual 620.66 423.29 440.56 516.22 533.15 Target 780 740 700 700 700 SAIFI Actual 3.78 2.93 4.23 4.19 2.56 Target 7 6.5 6 6 6
4.4.4.1 Comment
on
Performance
All feeder category performances were compliant against the Reliability Standards for 2012/13. CBD performance increased from previous years due to cable fault in pit in the CBD. Both Urban and Short Rural feeders continued to improve. Long Rural was similar to the previous year. There are so few feeders in this category that results can fluctuate dramatically year to year.
4.4.4.2 Excluded
Events
Table 4.7 Excluded Interruptions for 2012/13
Date of Event Description of Event Number of Customers Interrupted Maximum Duration of Interruption (minutes) Effect of Event on SAIDI Figure (minutes) Basis for Exclusion 23/07/2012 Transmission / Bulk Supply 516 162 0.0511 Transmission / Bulk Supply 10/08/2012
Major Event Day (The Major Event Day was
predominantly due to a strong wind storm impacting the entire Ausgrid network) 53,776 262 6.03 Exceeds Tmed 2.69 24/08/2012 Load Shed - Other Auth. Request 2 124 0.0002 Load Shed - Other Auth. Request 07/12/2012 Load Shed - Other Auth. Request
1 3498 0.0021 Load Shed - Other Auth. Request 02/01/2013 Load Shed - Other Auth. Request 3 27 0.0000 Load Shed - Other Auth. Request 14/01/2013 Load Shed - Other Auth. Request 19 119 0.0014 Load Shed - Other Auth. Request 23/02/2013
Major Event Day (The Major Event Day was
predominantly due to a strong wind storm impacting the entire Ausgrid network) 36,295 4,185 5.80 Exceeds Tmed 2.69
4.4.5
Performance against Individual Feeder Standards
The performance objectives for organisational average performances for each feeder category are not sufficient to identify when customers on a particular feeder experience unsatisfactory reliability performance. For this reason, SAIDI and SAIFI criteria (after ‘excluded interruptions’ are disregarded) act as a trigger for investigation and exception reporting purposes.
The objective of this section is to ensure that feeders performing unsatisfactorily (i.e. outside of the
performance criteria for that feeder type) are reported publicly and their performance tracked until performance is again satisfactory. The figures contained in Table 4.8 represent the Ministerially-imposed Licence
Conditions for each feeder type.
Table 4.8 Individual Feeder Standards for Exception Reporting Specified in the Licence Conditions Applicable to your Organisation
Feeder Categories
Category CBD Urban Short Rural Long Rural
(a) immediate investigation of the causes for each feeder exceeding the individualfeederstandards;
(b) by the end of the quarter following the quarter in which the feeder first exceeded the standard, complete an investigation report identifying the causes and action required to improve the performance;
(c) complete any operational actions identified in the investigation report to improve the performance of each feeder to the individualfeederstandards by the end of the third quarter following the quarter in which each
feeder first exceeded the individualfeederstandards; and
(d) where the investigation report identifies actions, other than operational actions, required to improve the performance of each feeder to the individualfeederstandards, develop a project plan, including
implementation timetable, and commence its implementation by the end of the second quarter following the quarter in which the feeder first exceeded the individualfeederstandards.
Table 4.9 Individual Feeder Performance against the Standard Summary
Feeder Type
CBD Urban Short Rural Long Rural
Feeders
(Total Number each Type) 55 1,733 287 4 Feeders that Exceeded the
Standard During the Year (Total Number)
2 59 6 0
Feeders Not Immediately Investigated
(Total Number)
0 0 0 0
Feeders Not Subject to a
Completed Investigation Report by Due Date
(Total Number)
0 0 0 0
Feeders Not Having Identified Operational Actions Completed by Due Date
(Total Number)
0 0 0 0
Feeders Not Having a Project Plan Completed by Due Date
(Total Number)
0 0 0 0
As required in clause 16.2 (b) and (c) of the Licence Conditions, each feeder currently exceeding the
Individual Feeder Standard is analysed and an investigation report identifying the causes and, as appropriate, any action required to improve the poor performance is reported in the next quarterly performance report. All actions required were completed in the relevant timeframes.
Overall, the percentage of poor performing feeders in each feeder category is relatively low.
Ausgrid has an ongoing reliability improvement program in place. The program targets those feeders that have exceeded or are approaching the Individual Feeder Standards as outlined in Schedule 3 of the Design, Reliability and Performance Licence Conditions.
4.5 Transmission
Reliability
4.5.1
Transmission Reliability Performance Data
Table 4.10 Transmission Circuit Availability (%) Trend
Previous Years Current
Year
Objective 2008/09 2009/10 2010/11 2011/12 2012/13
97.98 96.67 97.14 96.17 96.20 There has been a slight increase in circuit availability from the previous year’s result. As in recent years, the transmission availability this year was heavily influenced by the large number of outages associated with major capital build programs such as the 132kV isolator and circuit breaker replacement programs, as well as relay replacements at various sites and the transfer of 132kV feeders to the new TransGrid Beaconsfield busbar.
Table 4.11 Network Reliability Trend
Previous Years Current
Year Objective 2008/09 2009/10 2010/11 2011/12 2012/13 Network Reliability (Off Supply Event Numbers) 1 0 2 0 0
Table 4.12 Outage (Un-Planned) Average Duration (Minutes) Trend
Previous Years Current
Year
Objective 2008/09 2009/10 2010/11 2011/12 2012/13
3,279 2,291 3,497 5,810 4,734 This year’s average unplanned outage duration was shorter than last year, though still significant. Major contributors to this year’s unplanned duration index were a number of 132kV oil insulated cable failures and their long duration repair times. The most notable of these has been the repair of a leak in oil filled cable 90W, which took more than four months.
Table 4.13 Connection Point Interruptions (Unplanned) 2012/13
Connection Point Interruption Number Interruption Duration Total
(Minutes)
NIL NIL NIL
Note: This table provides a listing of customer connection points off supply events.
Table 4.14 Connection Point Numbers 2012/13
Year
5 Network
Safety
5.1 Overview
Ausgrid is committed to workplace and public safety. To meet our objectives in this regard, as well as relevant legislative and regulatory compliance requirements, we have implemented a number of safety programs and initiatives, both in relation to the safe operation of the network and workplace safety. These programs are summarised below in an extract from our Network Management Plan.
5.1.1
Safe operation of the network
Ausgrid has identified safety as a key network risk. To manage this, Ausgrid has undertaken strategic risk analysis of the types of hazardous events that may occur.
Ausgrid has identified various broad categories of risk relating to the safe operation of the network. At a strategic level, these are addressed in our duty of care plans. The planned programs of work documented in our duty of care plans are a key organisational safeguard against network safety risk.
In addition to these planned asset-related programs of work, Ausgrid has implemented various procedures and processes at an operational level for enhancing network safety, including:
an Incident Management System for managing network incidents and network emergencies that enable rapid response to hazardous situations
formal safety procedures and systems applicable when working on or near the network. This has both network safety and workplace safety implications.5.1.2 Workplace
Safety
Ausgrid has workplace safety obligations to its staff and contractors under the Work Health and Safety Act 2011 (NSW) (WHS Act) and the Work Health and Safety Regulation 2011 (NSW) (WHS Regulation).
Successful implementation of workplace safety processes and procedures also has an impact, more generally, on network safety and contributes to the safe operation of the network.
Ausgrid has numerous policies and procedures in place to ensure safe work practices. Ausgrid conducts programs to identify workplace safety risks and implements initiatives to address these risks to ensure ongoing compliance with its workplace safety obligations, and consistent application of its commitment to safety. Ausgrid’s Workplace Health and Safety Management System is called Be Safe. The Be Safe Management System has two key objectives:
the health, safety and welfare of all staff while they are at work
ensuring that people other than our staff are not exposed to unacceptable risks to their health and safety in connection with Ausgrid’s network operations.The principal document in the Be Safe Management System is the Be Safe Policy. The Be Safe Policy articulates the organisation’s commitments to health and safety through in the areas of:
Leadership
Making health and safety part of all business decisions
Awareness and Measurement
Training, Protection and Investigations.Ausgrid’s safety objectives are to ensure that those working on or near the network are competent to do so, and can do so in the intended safe manner; and compliance with the WHS Act and WHS Regulation, which require employers such as Ausgrid to identify foreseeable hazards, assess the risks of these hazards and eliminate or control these risks and review these controls.