Architecting Data-Intensive Software Systems
Chris A. Mattmann, Daniel J. Crichton, Andrew F. Hart,Cameron Goodale, J. Steven Hughes, Sean Kelly, Luca Cinquini, Thomas H. Painter, Joseph Lazio, Duane Waliser, Nenad Medvidovic, Jinwon Kim, and Peter Lean
1
Introduction
Data-intensive software is increasingly prominent in today’s world, where the collection, processing, and dissemination of ever-larger volumes of data has become a driving force behind innovation in the early twenty-first century. The trend towards massive data manipulation is broad-based, and case studies can be examined in domains from politics, to intelligence gathering, to scientific and medical research. The scientific domain in particular provides a rich array of case studies that offer ready insight into many of the modern software engineering, and software architecture challenges associated with data-intensive systems.
C.A. Mattmann () • D.J. Crichton • A.F. Hart • C. Goodale • J.S. Hughes • S. Kelly • L. Cinquini • T.H. Painter • J. Lazio • D. Waliser
Instrument and Science Data Systems, NASA Jet Propulsion Laboratory California Institute of Technology, Pasadena, CA, USA
e-mail:[email protected];[email protected];[email protected];
[email protected];[email protected];[email protected];
[email protected];[email protected];[email protected];
N. Medvidovic
Computer Science Department, Viterbi School of Engineering University of Southern California, Los Angeles, CA, USA e-mail:[email protected]
J. Kim
Joint Institute for Regional Earth System Science and Engineering (JIFRESSE), University of California, Los Angeles, Los Angeles, CA, USA
e-mail:[email protected]
P. Lean
Department of Meteorology, University of Reading Reading, UK e-mail:[email protected]
B. Furht and A. Escalante (eds.), Handbook of Data Intensive Computing,
DOI 10.1007/978-1-4614-1415-5 2, © Springer Science+Business Media, LLC 2011
Scientific domains such as climate research, bioinformatics, radio astronomy, and planetary and Earth science all face challenges related to the effective manip-ulation of large datasets, including the capture, generation, and distribution of the often complex, heterogeneous data to support various domain-specific applications including: decision support, modeling and prediction, virtual exploration and simulation, and visualization, among others.
Capturing, generating and distributing data in meaningful ways is key to ensuring that the data can be used by downstream consumers. One major impediment to these activities in modern times is the sheer volume of the data involved. Data volumes have steadily increased as the mechanisms for generating and capturing data with increasing resolution have evolved. To take a recent example from the world of radio astronomy [40], the LOw Frequency Array (LOFAR) instrument [1] currently generates 138 PB (petabytes) of data per day [2]. Other examples include climate models that produce 8 PB per run, NASA Earth science decadal missions, such as the Orbiting Carbon Observatory, with projected mission data volumes well into the hundreds of TB range [3], and the high-energy physics community’s Large Haldron Collider (LHC) instrument, generating 2 PB of data per second [4] during operation. Yet, despite its tremendous implications, data volume is only one of many challenges that must be addressed to properly architect data-intensive systems. At the same time, the rapid evolution of information technology in multiple dimensions (storage capacity, computing power, network bandwidth, computing language, and web protocols) is opening up an unprecedented set of possibilities for the large-scale analysis of data, changing the very way researchers conduct their day-to-day work. Scientific research is no longer conducted by small groups of scientists working in adjacent offices or a single laboratory, using a few pieces of hardware equipment and desktop software. Rather, scientific collaborations are increasingly distributed, often global in nature, and typically involve tens to hundreds of scientists working together from their home institutions, connected via virtual electronic environments, and accessing and analyzing massive amounts of data archived at distributed locations.
Scientific algorithms too are becoming increasingly complex, and are often implemented using a combination of many different software modules working together. The need to operate over larger and larger datasets, often in heterogeneous, multi-unit environments, and the need to distribute results not just to peers, but to a variety of audiences of vastly different backgrounds (e.g., global policy makers, public officials conducting regional and local assessments, and students and researchers of all education levels) – facilitating the transformation of big data into actionable knowledge – present significant challenges as well. This modern paradigm for scientific data analysis requires a technical infrastructure that can meet these new challenges, and at the same time keep pace with the relentless evolution of the underlying hardware and software capabilities.
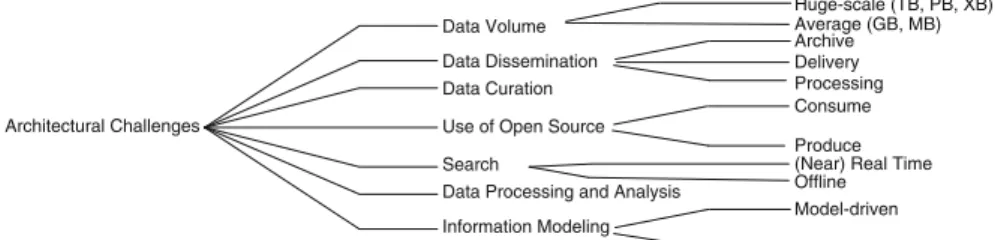
In this chapter, we will survey the state of the art in software engineering, and software architectural challenges associated with data-intensive systems, expressly focusing on the domains of science data systems. In Sect.2, we will restrict our focus to seven key challenges for data-intensive systems in this domain, specifically:
(1) data volumes, (2) data dissemination; (3) data curation; (4) use of open source software; (5) search; (6) data processing and analysis and (7) information modeling. These challenges are then illustrated via case studies in Sect.3, in which we describe our experience on several data-intensive science projects in the areas of Regional Climate Modeling, Bioinformatics, Planetary.
Science, Radio Astronomy, and Snow Hydrology. After placing the challenges, in context, in Sect.4 we describe several emerging software and architectural paradigms that we view as promising approaches to the construction of software to support data-intensive science in the aforementioned domains, and Sect.5rounds out the chapter.
Throughout the chapter, we strive to present information in an descriptive, rather than prescriptive fashion, in order to align with this book’s goal of providing a handbook in the area of data-intensive systems. We feel this approach will help to guide the reader through important projects, and architectural challenges, rather than provide a recipe applicable only to any one experience.
2
Key Challenges
Architecting data-intensive software systems in today’s highly connected, compu-tationally demanding scientific research environments presents tremendous chal-lenges that stretch to the limit the familiar software engineering approaches of the last 10 years. Many of the canonical software architecture techniques must be updated to accommodate the uniquely challenging circumstances encountered in building modern, data-intensive software systems.
In this section, we present a representative cross-section of concerns and architectural challenges inherent in modern, data-intensive systems. We do not claim this to be a comprehensive list, but rather that it is indicative of the type and complexity of the challenges that must be overcome in order to construct effective software for data-intensive applications.
We will refer back to these challenges (shown graphically in Fig.2.1) throughout the remainder of the chapter. Specifically, in Sect.3, we will illustrate the manifesta-tion of these challenges in several real-world data systems for scientific research that
Data Volume Data Dissemination Data Curation
Use of Open Source
Data Processing and Analysis Search Information Modeling Architectural Challenges Consume Produce Model-driven Exchange/Interoperability Archive Processing Delivery Huge-scale (TB, PB, XB) Average (GB, MB)
(Near) Real Time Offline
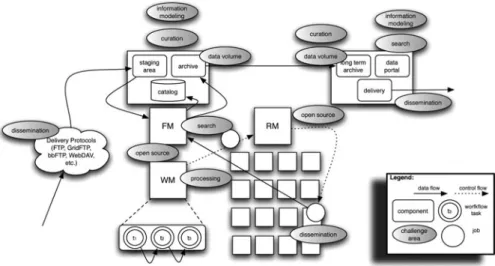
Fig. 2.2 Architectural challenge areas and their relation to the data-intensive system lifecycle. FM
stands for file management, WM stands for workflow management, and RM stands for resource management
we have constructed at NASA’s Jet Propulsion Laboratory. Further, in Sect.4, we will highlight how topical data-intensive system technologies provide a framework for understanding these concerns, and for addressing them in various ways.
Before we dive into the discussion on challenges, we must first frame them within the context of data-intensive systems architecture. The following section will revolve around the imagery seen in Fig.2.2.
2.1
The Architecture of a Data-Intensive System
As can be seen from Fig.2.2, the architecture of a data-intensive system is inherently complex. If we scan the diagram from left to right, we see that data (and metadata) enter into the system delivered (or disseminated as we will explain in Sect.2.2.2and as shown in Fig.2.1) via a number of potential protocols (e.g., FTP, GridFTP, etc.) to a staging area (shown in the upper left periphery of Fig.2.2). Once in the staging area the data and metadata are curated (as we will explain further in Sect.2.2.3) which can involve both human-in-the-loop detective work to richly add metadata and structure to the data, and can also involve automatic, software-based metadata extraction. One key component of this effort is information modeling (as we will explain further in Sect.2.2.7) wherein which models of the data and metadata set to be cataloged, and archived are derived.
Once curated, data is ingested (either manually or automatically) via some sort of file management component (shown in the middle-left portion of Fig.2.2
and labeled as FM). Ingestion involves both the cataloging of extracted metadata associated with the data and data dissemination from the staging area to a controlled,
rich archive1. The FM is also responsible for staging data and metadata to the workflow manager component (labeled as WM in Fig.2.2and shown in the bottom-left portion of the diagram) and for managing the total volume of data in the archive. The workflow management component is responsible for data processing (as we will learn more about in Sect.2.2.6). Both of these components (FM and WM) are available for consumption from a number of open source projects including within our own efforts in the Apache Object Oriented Data Technology (OODT) project [5,6], as well as within Apache Hadoop [7], Condor [8], Wings [9], Pegasus [9], and from a number of other examples that we’ll cover in Sect.4(see [10] for further information). The workflow management component orchestrates control flow (sequences of executions of work units or tasks), and data flow (passing of information in between those tasks). In science data systems, tasks traditionally correspond to some sort of data flow-style component, that takes input data files and transforms them somehow (geolocates them; calibrates them, etc.) to produce output data files.
The WM works together with a resource management component (shown as RM (another common open source component) in the middle-portion of Fig.2.2
and responsible for managing the underlying compute and storage resources shown as the boxes below RM) to execute a ready-to-run task on a set of hardware and software resources (e.g., a cluster, a grid, a cloud, etc.). The first step once the job has been batched out to a hardware node (provided there was enough disk space, compute resources, etc., as calculated by the RM) is to stage the appropriate data files required for input to the task. This involves communication with the FM component usually in the form of metadata search as demonstrated in the middle-portion of Fig.2.2. Once the input is available, it is provided (along with any other necessary run-time information) to the underlying task and the task is executed out on the hardware node, the result of which is a set of output data files (and potentially metadata). This information is then traditionally re-ingested (e.g., via a crawling process [6]) and disseminated to the file management component for preservation, and to make those output data files and metadata available to downstream tasks and processing.
At some point during the lifecycle of the data-intensive system, data is delivered from the processing archive to the long term-archive as illustrated in the transi-tion from the left-to-middle-to-right portransi-tions of Fig.2.2. This process is volume intensive, and involves dissemination in its own right. There may also been further data curation that occurs to enrich the metadata and structure of the data for the long-term archive. Once archived, the data is presented externally to the scientific user community via data portals (e.g., see [11] for some examples), where users can interactively and programmatically search for the data and metadata, and explore and consume the information model that describes the data. Users may also download the data and metadata, so dissemination is an important factor here, as shown in the right side of Fig.2.2.
In the next section, we will describe in detail the key challenges of data-intensive systems as it relates to their canonical architecture that we have covered in this section.
2.2
The Challenges
In this section, we will hone in on the seven challenges described in Fig.2.1and illustrated from an architectural perspective in Fig.2.2.
2.2.1 Total Volume
The amount of data analyzed by a single project has already reached the order of several petabytes (PB), and the exabyte (EB) is rapidly approaching mainstream vernacular. For example, a single run of a modern climate model simulation running on a high-resolution grid (such as the CESM T341, which is global grid at roughly 40 km resolution) will generate several terabytes (TB) of output. The combined total volume for all of the models comprising the Coupled Model Intercomparison Project Phase 5 (CMIP5) [12] is on the order of 10 PB. Similarly, the next generation of Earth observing satellite missions planned by NASA (such as the DESDynI [13] mission), will generate a final product stream of roughly 40 TB/day, resulting in several tens of PB over the course of just a few years.
Massive data volumes present several challenges at the architectural level. From our related experience, the fork in the road lies at the transition from gigabytes (GB) of data (up to hundreds of GB) to terabytes, petabytes and exabytes of information, as shown in the upper right portion of Fig.2.1. Modern commodity hardware traditionally ships with disks in the GB/low TB range (up to 1–2), and it is relatively inexpensive to scale up to tens of TB. However, scaling much beyond the tens of TB range not only raises costs significantly, it also increases the complexity of managing the resultant data system from an architectural perspective.
In science data systems, data is regularly stored as files on disk, and associated metadata2is stored in a file catalog such as a database, a flat-file based index (such as Lucene [14]), or simply as metadata files on disk alongside the data itself. As the data volumes increase, the challenges of partitioning the data effectively on disk, organizing the metadata efficiently for search, and providing access to both data and metadata for processing and dissemination become more pronounced. In average-scale volumes (up to hundreds of GB), the disk repositories and files can be organized in an ad-hoc fashion without becoming prohibitively complicated to traverse and explore. For repositories in the terabyte range and beyond, alternative
2Metadata refers to “data about data.” As an example, consider a book data file, and its associated
approaches are often required, including: (1) metadata based file organization – a partitioning of data based upon certain metadata attributes (e.g., for datasets that are spatially located, files might be partitioned on disk by region); (2) file management replication – replication of file management servers to partition the overall data “namespace” and its access, search, and processing; (3) careful selection of data dissemination technologies – taking into consideration the benefits and limitations (e.g., support for multi-delivery intervals, parallelized saturation of the underlying network) [13] of distribution technologies such as bbFTP and GridFTP [15], among others; and (4) the additional search, and processing challenges we discuss below. All of these challenges are illustrated architecturally in Fig.2.2.
The difficulty in dealing with massive data volumes permeates the strategies for addressing all of the other concerns and challenges from Fig.2.1, including open source (in the sense that certain open source technologies are oriented specifically for use with larger data volumes as we will describe further in Sect. 2.5). In the following section we will cover data dissemination, a challenge directly related to data volume.
2.2.2 Data Dissemination
The dissemination of data at the scales one might realistically expect to encounter in modern data-intensive software systems is no longer a trivial matter and merits careful consideration in the architectural planning phases of system development. Data volumes, coupled with the (often internationally) distributed nature of modern research teams, and the cross-domain nature of many scientific problems, imply that data holdings analyzed by a single project can no longer be assumed to exist at a single archive, but rather are likely to be distributed across multiple locations that may be both geographically and technologically distinct. At the same time, users often expect to find and interact with data as if it were a single archive. Meeting this expectation requires that data-intensive systems consider discovery and access services that conform to a common Application Programming Interface (API) to permit clients to seamlessly access data from arbitrary locations without requiring specialized code. This is seen traditionally in many modern open source file management, workflow management and resource management components in the form of extension points or “plug in” services that allow composition of existing data system components. This could be envisioned as in Fig.2.2, for example, at both ends of the diagram. On the one hand, for example, the distribution of upstream data sets across the globe, that must be brought into a data-intensive system for processing; and on the other, the data produced by a data-intensive system that must be distributed to several geographically diverse archives.
Unfortunately, in many cases, the present state of the art involves providers that run legacy services customized to the specific storage type, data format, and control policies in use at the center. Middleware code that delivers data and metadata conforming to the common API, while interfacing with the existing back-end servers and applications is often necessary to bridge the gap.
Typically, data holdings are not generated or collected on their final storage area, but they need to be moved there possibly through several stages of processing (as shown in the left-side and middle portions of Fig.2.2). This requires both the availability of a network bandwidth that is able to keep up with the data generation stream, and the utilization of data transfer protocols that are able to take advantage of that bandwidth. Historically, network bandwidth has lagged behind with respect to the continuous increase in storage capacity and computing power. Currently, the fastest networks allow transfers of about 10 GB/s, but they are available only between a few selected locations. New technologies (GridFTP, UDT, BFTP etc. [13,15] as shown in the left periphery of Fig.2.2and as could be imagined in the right) continue to emerge that aim at maximizing data transfer rates by instantiating multiple concurrent data streams, tweak the buffer size, and decompose each single transferred file. But the benefits of these technologies are still limited in most cases by the availability of the underlying high speed network as our own prior studies [13] and [15] have shown.
In the following section we will describe the importance and relevance of data curation once data has reached a staging area as disseminated from a remote site, and once data is sent from a processing system to a long-term archive (as shown in the middle left to middle right portions of Fig.2.2.
2.2.3 Data Curation
Data curation is a broad term for a set of processes designed to ensure that data in all stages of a data-intensive software system, from raw input data to processed output, exhibit properties that facilitate a common organization, unified interpretation, and contain sufficient supporting information, or metadata, so as to be easily shared and preserved. Recall the prior discussion from Sect.2.1and the left-upper portion of Fig.2.2.
While the concept of data curation is not a new one, it has taken an increasingly prominent role in the modern era of high-volume, complex data systems. The proliferation of mechanisms, formats, and standards for generating, annotating, distributing, and ultimately archiving data underscores the need to treat a policy for data curation as an essential ingredient of a data intensive software system. Our own specific experience in this area is within the context of bioinformatics systems and we point the reader to [16] and [17] for further information.
The process for data curation varies across systems depending upon factors such as the volumes of data involved, the degree of noise in the inputs, and the downstream expectations for disseminating the data for future (and perhaps even far-future) use. Furthermore, the degree of automation in the curation process is also highly variable. Some systems maintain a human in the loop, whereas others perform curation via an algorithmic, rule-based approach, without any inline human intervention.
Data curation is closely related to efforts in information modeling (discussed in Sect.2.2.7). The curation process is very often one of the chief mechanisms by
which the abstract information model is actually applied to the data in the system, and through which any modeled constraints are enforced. From this perspective, the data curation process can be viewed as a mechanism for quality assurance; it provides an opportunity to perform sanity checks and corrective action on the data as it moves throughout the system.
The benefits of data curation are not limited to error detection, however. The curation process is often viewed as a mechanism for adding value to the data. Curation provides opportunities for enriching data with contextual metadata annotations that facilitate its downstream discovery and use (e.g., via search). Furthermore, the analysis steps in many data-intensive systems are often highly context-sensitive, and depend upon information such as the provenance of the data (the detailed history of processing steps employed to generate the current data as shown in the middle-bottom portions of Fig.2.2), as well as the operational and environmental parameters for an accurate interpretation of the data. Here again, the close relationship to information modeling becomes evident. Where the information model defines concepts and relationships that must be present in the data, the data curation process must implement a mechanism for satisfying the requirements.
Finally, in addition to offering opportunities for error correction and for adding value to generated data, the curation process often provides an opportunity to address the requirements for sharing and for long-term preservation of the data (for a detailed description of this area, we point the reader to [18] and further its accompanying special issue of Nature magazine on “Big Data”). The contextual annotations described earlier provide rich technical descriptions of the data. Aside from enabling context-sensitive in-system processing, this additional detail is extremely helpful in a distributed, collaborative environment where groups of end-users may not otherwise have the same degree of detailed insight into the processes by which their data was generated. A well-curated dataset with sufficiently detailed annotations and descriptive metadata has a better chance of standing on its own as a self-contained, scientifically valuable resource than does a simple collection of raw data that lacks a curated context.
We will next change gears a bit and specifically describe the role that the use of open source software plays within data-intensive systems, and how the consumption and production of open source data management software components play a role in the overall architecture of data-intensive systems.
2.2.4 Use of Open Source
With the tremendous existing challenges of constructing data-intensive systems, the consumption and (re-)use, as well as the production of components for down-stream (re-use) is an important challenge in data-intensive systems. Open-source software is extremely common-place in data-intensive systems, and represents the implementation-level reification of (re-)use of software components. We will elaborate below.
Several areas within Fig.2.2demonstrate data-intensive components that already exist and that can be consumed off-the-shelf from many open source market places. Our purpose in this section is not to highlight the wealth of open source software products for data systems that exist; nor is it to contrast and compare them. Instead, we focus on the identification and rationale behind consuming and producing open source software components as identified in our data-intensive system architecture within Fig.2.2.
For the left side of Fig.2.2, (the file management and curation areas) protocols for data-delivery into a staging area are myriad, and can be consumed with varying levels of effort. Some data dissemination components and connectors [19] (the models of interaction between software components) vary in their non-functional properties, as well as in non-functional areas such as scalability, consistency, dependability, and efficiency [3]. In terms of production, the development of reusable connectors and protocols within this portion of the data-intensive system focuses on exploiting the underlying network, bandwidth, and hardware resources in some fashion to achieve speeds in performance, and reductions in overall memory footprint. Since connectors are inherently application independent, the development of dissemination software for open source and downstream reuse is an active area of open research.
Information modeling and curation (shown in the upper left, and upper right portions of Fig.2.2) are two areas where the stock of open source software components are relatively small and much current work in data-intensive systems focuses on the development of these components. This is in part due to the diversity and heterogeneity of the data managed, and to the scientific domain of applicability, as well as in part due to the relatively recent focus (over the past 10 years) on the capture of rich descriptions of data and metadata. So, from a open-source software production perspective, data-intensive systems are in need of (re-)usable components focused on these two challenges.
Regarding workflow management and resource management as shown in the middle portion of Fig.2.2, many existing open source components are available for consumption. We point the reader to [9] and [10] for further surveys, as well as to our own work in the area of the Apache OODT [5] project. In terms of developing open source components for workflow and resource management, effort is mostly spent in the area of supporting a variety of complex control flow (fan-in, and fan-out, as defined by directed acyclic graphs [20]) and underlying hardware and compute resources (grids, clouds, etc.). The development of effective workflow and resource management components is highly complex, and in our experience, effort is best spent in this area consuming existing open source components and leveraging existing models.
One thing worth pointing out regarding processing and resource management is that the underlying scientific tasks (thetntasks shown in the bottom-middle portion
of Fig.2.2), regarded by many scientists as representative of some step in the overall scientific process, are typically first-of-breed algorithms and the result of many years of research. Depending on the maturity of the data-intensive systems domain, these algorithms may or may not be suitable for downstream open source dissemination.
The algorithms often represent “research-grade” code and aren’t “hardened” to be suitable for other contexts, and/or scientific domains. This is due to a number of reasons that are beyond the scope of this chapter, one common of which is that the algorithms are often tied to the scientific instrument or physical process that produced the input data that they operate on. As for consuming these components from the open source marketplace, as the algorithms are often unique, their (re-)use is typically limited to the system at-hand.
Regarding the right-side of Fig.2.2, there are a number of existing open-source search components available for consumption and (re-)use within a data-intensive system. We will discuss these more in Sect.2.2.5. Data disseminated from long-term archives can best leverage the same types of connector technologies and open source software previously discussed in the beginning of this section.
Besides production and consumption of open source software, there are a number of other challenges and concerns, including understanding open source licenses, communities, development practices, and methodologies. We see this as an emerging and important area to keep within arm’s reach in understanding data-intensive systems.
In the next section, we will discuss search as a key challenge within the data-intensive systems domain. From the existing discussion and from Fig.2.2, search crops up in both the data processing (left/bottom middle) and in user-facing data dissemination from a long-term archive portions of the architecture.
2.2.5 Search
All of the effort towards collecting, ingesting, storing, and archiving is for naught unless there is some way to get that data back. Strictly regurgitating out of system all that was ingested does not suffice, as there are multiple orders of magnitude more data saved within a data-intensive system that are required for an individual analytic problem. As a result, systems need a way to search through all that data to locate items that match criteria.
Data-intensive systems therefore provide a search feature that accepts queries for data and returns a set of matching results, both useful in data processing to identify input data files and metadata to stage to an algorithm and shown in the bottom/middle-left portion of Fig.2.2, as well as in data dissemination to end-users shown in the right side of Fig.2.2. Stated informally, queries pose questions of where certain data is, and the search feature satisfies those questions with the answer of where to find such data. A query in this sense means any form of declaration of desiderata, such as “Where are readings of ocean temperature taken by an orbiting infrared CCD between 2000-01-01 and 2001-12-31?” or “What humor books published after 1950 in the northern hemisphere mention the term ‘loogie’?” The desiderata necessarily require some foreknowledge of the data curated with a data-intensive system.
Note well that retrieval and dissemination are separate operations from search. Strictly speaking, a search operation serves to locate data matching criteria and
nothing else. The results of search are the locations of the matching data, and potentially other metadata recorded about it. What happens next is up to the user demands and architects of the system. In some instances, a “results list” may be presented, ranking the matching data by some metric, and a user may then select specific data to retrieve.
Giving better morphology to results, a data-intensive system operating in a system-independent matter may present results as:
• A set of identifiers (often Uniform Resource Identifiers or URIs) that either name or locate the matching data. These may be “resolved” in order to retrieve the actual data.
• A matching set of metadata that annotate each identifier with descriptors indicate context and, optionally, relevance. Such metadata serve to guide consumers of the system towards the best result from a possibly massive set of matching results. Queries presented to a search component of a data-intensive system often take one of three forms: open, guided, and constrained.
Open queries are the easiest to use from a user standpoint and are the most familiar in today’s web-enabled internet. Anyone from the most intimate and advanced users of search engines to the casual “googler” takes advantage of the open format of queries. The open query format is merely a sequence of textual terms that the search component of a data-intensive system matches against the system’s catalog of data. Such matching may be subject to certain processing (such as conversion of terminology, synonym generation, and the like). Often, the matches to open queries depend on the data containing the actual terms presented. Open queries serve the requirements of all kinds of users, though those inexperienced or unfamiliar with what is within a data-intensive system’s catalog may not be able to present the right terms to gain any results.
Guided queries enable exploration of the corpus of data cataloged within a data-intensive system. Guided queries present a series of high-level organizational categories or “facets” of the cataloged data along with a set of applicable terms in each category. By selecting an item, the set of matching data, as well as the related categories, are constrained, presenting a narrower view. Repeating this, users can narrow down towards the sought after data while also refining their desiderata to better mesh with the cataloged entries. It enables both a broad overview of the available catalog while also providing for customized, use-case, a specific matching of results through a guided progressive disclosure. This interactive approach is ideal for new users who can gather, at a glance, a high-level view of the catalog. However, its weakness is that it requires curators of the data-intensive system’s catalog to choose categorizations that appeal to the system’s users. Inappropriate facets may lead users nowhere.
Constrained queries enable the end user or client systems of the data-intensive system to specify a series of logical constraints on any of the searchable indexes in the system’s catalog. Such constraints specify exact or relative values, such as temperature measurements equal to273ı, or in the range of273–279ı, and so forth. Multiple constraints may be joined in a logical expression, such as temperature in
the range of273–279ı OR altitude greater less than 2 km YET with number of observations greater than 20. Constrained queries allow for the most precise yet also the widest ranging potential for search throughout a data-intensive system.
The architecture of the search component in a data-intensive system typically takes the form of a distributed structure in which one or more catalogs (containers for indexes and metadata, managed by file management components as identified in Fig.2.2) are populated with information about the corpus of data to be cataloged. In this arrangement, the logical entities include the query handler, which accepts desiderata in the three forms as described above; the indexer, that provides informa-tion for queries and creates the catalog of data; the schema manager, that provides the configurable set of metadata for queries; the converter, that accepts data to add to the catalog, analyzes it, and extracts metadata, and passes such digested data to the indexer; and the storage broker, that manages the persistence for all this information. Ancillary components include replication management, controllers, authentication, and authorization.
More specifically, the query handler accepts external queries, checks if they’re well-formed, and uses the indexer for resolution. Query handlers may project a number of client interfaces, from HTML forms, to HTTP-based web services (including REST, XML-RPC, SOAP, and so forth), or language-specific application programmer interfaces. The query handler gathers results and returns them to the client, paginating as needed.
The schema manager maintains persistent metadata about indexed items. It is equipped with the system curators’ selected metadata fields, their data types, and so forth. For example, in a document data system, the schema manager would track titles, authors, and abstracts. In a climate data system, it might be latitudes and longitudes. Since search results contain only the locations of matching data and not the data themselves, it’s the schema manager’s job to annotate those results with enough useful information to inform end users of whether retrieving such data is useful.
Finally, the indexer is the heart of the search component. It provides the logic to handle queries, catalog data, and communicate with backend storage systems. When data is entered into the system, it relies on metadata extraction and analysis components to provide details to the schema manager. It relies on data conversion components to translate foreign formats. It relies on the storage broker to maintain such information over long periods of time. It builds high speed indexes for future queries. And it services those queries.
In the ensuing section, we will build upon the existing challenges and describe the relationship of data processing and analysis to them and to the data-intensive system.
2.2.6 Data Processing and Analysis
Scientific data repositories have long focused on the need to capture data from upstream data producers (instruments, sensors and other scientific activities),
without carefully addressing science user needs for turning these repositories into useful knowledge-bases. In light of this, many scientific domains have standardized over time on science user pipelines or automated software workflows which process and generate data from rich canonical science repositories, in order to provide value-added answers and outputs to scientists, and to the broader decision-support community. In a data-intensive system, this boils down to workflows, tasks, workflow management systems, and resource management components as depicted in the middle of Fig.2.2.
Often, the large amounts of data generated by a project need to be post-processed before it can be analyzed by the scientists. Such is the case for example for remote sensed data, where the data stream from the ground station needs to be transformed through several successive algorithms to generate the required data products. Another example is that of global climate model output that needs to be regridded and downscaled to provide data that can be used to predict the effect of climate change on a regional and local scale. Along the way, the relationship between maintaining data and metadata for the intermediate inputs and outputs of such science workflows and pipelines is critical since this information in many ways drives downstream processing, and ultimately other interesting areas of data-intensive systems such as provenance of output and the like. There is also a close relationship to other architectural components, including file management (to stage files and metadata for the steps in each workflow), curation, and dissemination to the node where the step is processing.
Post-processing these large volumes of data, often in real time, mandates new requirements on the computing power of the hardware employed. When the data cannot be processed on a single machine, the project needs to consider an architecture that distributes the load over several servers, possibly configured to perform different steps of the overall processing pipeline. This is demonstrated through the resource management component and its main purpose as shown in the middle of Fig.2.2. Cloud computing environments have increasingly become under consideration as a method to dynamically allocate computing resources to a data processing task, due to their ability to support sporadic burst processing, and storage. In practice, clouds, grids, clusters, and even desktop computing machines are all used and leveraged during scientific data processing, and all should be available as suitable resources for use.
The close relationship with processing and with file and metadata management also begets an important connection to information modeling. Often, science algorithms and workflow tasks are not necessarily concerned with maintaining provenance, and other data system metadata inasmuch as they are concerned with presenting the output science result or measurement. To ensure that the provenance of executing these science algorithms is captured, many data-intensive systems employ an architectural wrapper approach [21]. The wrapper orchestrates the lifecycle of the individual step in the scientific processing, ensuring the appropriate files, and metadata are provided, that the appropriate inputs are available and pre-conditions met, and that metadata and output data files are cataloged and archived
and made available for distribution. We point the reader to our own work in the context of several science data processing systems in Earth science for further information [6].
We close out this section and the discussion of key challenges below by highlighting the importance of information modeling.
2.2.7 Information Modeling
In a data-intensive software system, especially one with requirements for long-term data usability and persistence, the metadata should be considered as significant as the data. For example, a digital image is essentially useless to a planetary scientist unless information about the locations of the light source, the imaging instrument, and the target body are all known, preferably within a single frame of reference. Metadata is often captured in a data-intensive system within a catalog or registry (as demonstrated in the left upper portion of Fig.2.2). In some scientific domains (e.g., NASA planetary missions), the experiment is non-repeatable since it occurred over a particular unique space/time sequence. Because of this, it is in the best interest of the science community to collect as much information as possible about the observation and the context within which it was performed for future reference. Metadata is also required to index and classify the data for search and retrieval as described in Sect.2.2.5and throughout Sect.2.2and as shown in the upper right and lower left portions of Fig.2.2.
Information models are used to define, organize, and classify metadata. These include models for the actual data as well as models for other digital, physical and conceptual things in the domain. For example in addition to a model for a digital image file, others might be required to describe the digital calibration data required to produce scientifically useful products3, the physical instrument that collected the data, and the mission that managed it.
Data-intensive software systems also have system interoperability and data correlation requirements. Shared information models [22] are needed to meet these requirements by adding semantics, basically formally defined relationships between things in the models. Furthermore to achieve seamless connectivity important assumptions must be made about the information models being used to provide the semantics, including having a single shared ontology and the need for human assistance in the development of the ontology. Without a single shared ontology the effort to achieve connectivity across pre-existing repositories is essentially “cryptography” and rapidly becomes intractable.
Information models help describe data as it is provided to the user through data portals, search and curation tools, and to software programs looking for the appropriate files to stage for data processing and for science algorithms (shown in the upper right, and middle portions of Fig.2.2).
3In the world of science data systems and data-intensive systems in general, “products” refer to the
With the above understanding of the key challenges of data-intensive systems as they relate to software architecture out of the way, in the next section we will illustrate modern, real-world examples and manifestations of these challenges within the architectures of science data systems for regional climate modeling, astronomy and radio science, along with snow hydrology. In doing so, we will also highlight strategies and approaches for dealing with these important challenges.
3
Representative Science Data Systems
Having covered the challenges that data-intensive computing presents, we will expand on several examples from our collective project experience. It is our goal to illustrate the commonality between these examples despite the extreme variance in the area of scientific study from project to project.
The goal is two-fold. First, we demonstrate that the key challenges of data-intensive systems manifest independent of the science domain; and second, we strive to highlight successful architectural approaches and strategies (relating back to Sect.2) that have proved effective as a means for addressing these stringent challenges.
3.1
Climate Modeling
Climate modeling is a computationally expensive task, both in terms of data processing and data volumes (recall Sects.2.2.6and2.2.1). While the accuracy of climate projections is limited by both the level of understanding of the Earth system and the available computer resources, currently the bottleneck lies primarily with the computer resources [18].
By the early twentieth century, scientific understanding of the atmosphere had reached a stage where accurate predictions could, in theory, have been made if adequate computer resources had been available. This is illustrated by the fact that during World War I, mathematician Lewis Fry Richardson, devised an atmospheric model broadly similar to those in use today. He attempted to make a weather forecast using this model, but limited by the computer resources of the day (he ran the model by hand, performing calculations using pen and paper), it took him several months to produce a 6-h forecast [23]. Consequently, routine weather predictions and the even more computationally expensive problem of climate prediction were unfeasible until the advent of modern computers later in the century.
Climate models work by splitting the entire Earth system (atmosphere, land surface, ocean and sea ice) into a three dimensional grid and using the laws of physics to predict the future evolution of various state variables at each grid box. The models make projections up to 100 years ahead by calculating the evolution in sequences of short time steps (each only a few tens of minutes long). Over time,
the steady increase in computing power has allowed the model grid length to be reduced (smaller boxes give a finer representation of the atmospheric features) and the complexity of the simulations to be increased.
Recently, the scientific community has faced a challenge in how to maintain this performance increase in the face of a trend towards massive parallelization in HPC architectures. Existing climate model codes do not scale well across many thousands of CPU cores and major re-engineering may be required to take advantage of the potential of massively parallel architectures. Currently, atmospheric models are parallelized such that each core handles a geographically distinct region. However, as changes in the atmosphere at one point depend on nearby conditions, considerable communication between cores is required, reducing the scalability of the system.
As the resolution of the climate models increases, so does the volume of data produced (Sect.2.2.1). Today, climate research projects often involve international collaboration between teams from many research centers, often involving data from several models. The problems of disseminating and processing statistics (recall Sects.2.2.2and2.2.6) on such large datasets is becoming an increasingly serious challenge to the community. In addition, different models use different file formats and meta-data conventions posing significant difficulties to researchers working on output from more than one model. Currently, coordinated attempts are being made to assist in the efficient dissemination and processing (Sects.2.2.2 and2.2.6) of climate model datasets through the creation of unified data portals which provide a single source of data from multiple models in a common format.
Among the key computational aspects of climate modeling for predicting future climate and its impact on human sectors is the fact that the assessment of climate variations and change on regional sectors require high resolution information since a number of important climate features vary according to regional-scale variations in underlying surfaces. For example, precipitation and snow budget that play key roles in the occurrence of flooding and water resources in California is closely related with the regional complex terrain (e.g., [24–26]). Climate simulations at such fine spatial resolutions for time scales of a century or more, minimum for resolving long-term climate trend challenges computational infrastructure for both CPU cycles and the handling (dissemination and storage) of model output. The CPU-cycle requirement has been progressing well during the past three decades with the development of massively parallel computer architectures and programming.
The data dissemination (recall Sect.2.2.2) part has also been progressing with the progresses in physical storage; however, it is still a bottle neck in climate modeling. Because running global climate simulations at the spatial and time scales to meet the needs for impact assessment and computing long-term climate trends, respectively, remains cost-prohibitive, the climate modeling community employs nested modeling in which regional climate models are used to spatially downscale relatively coarse global model data.
Handling of massive data from regional model runs is a specially important problem. For example, one snapshot of model fields for the fine-resolution domain is about 150 MB. Multiplying this with the frequency of model data sampling (6 h, i.e., four times a day) and the simulation period (20 years for a minimum
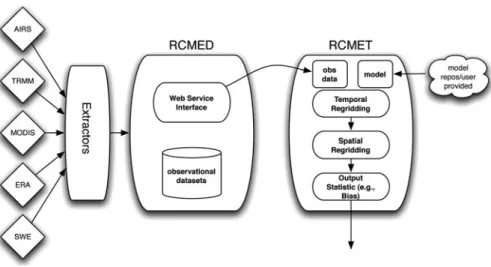
Fig. 2.3 The regional climate model evaluation system, or RCMES
to alleviate the effects of decadal variations), one regional climate run generates about 4.5 TB of model output for its total volume. As model runs for at least two periods, present-day and future, are needed for one set of climate change signals, one scenario run generates about 10 TB of data. Note that this is a conservative estimate based on the limited computational resources available to a small research group consisted of a few researchers. Recent reduction in the cost of storage media allowed regional climate modelers resolve the storage space problem somewhat; however, transferring data from supercomputer centers to local storage and the performance of local data storage in supporting data analysis remain major concerns.
Our most immediate experience in this area is centered around a project incepted in 2009 funded by the American Recovery and Reinvestment Act (ARRA). The project was focused on the assessment and generation of US Western regional climate models using multiple observational datasets from e.g., the Atmospheric Infrared Sounder (AIRS), MODerate resolution Imaging Spectrometer (MODIS), and Tropical Rainfall Measurement Mission (TRMM) projects. Leveraging the open source Apache OODT framework (that we will further discussion in Sect.4), we constructed a Regional Climate Model Evaluation System (RCMES) [27] with two principal components, shown on the left and right sides of Fig.2.3.
The Regional Climate Model Evaluation Database (RCMED) (left side of Fig.2.3) was built to warehouse data point tuples (of the form time, lat, lon, value) from the aforementioned observational datasets and their respective file formats ranging from NetCDF, HDF4/5, to GRIB [27]. The RCMED provided an external user-facing web service allowing spatial/temporal searches (recall Sect.2.2.5 and the right side of Fig.2.1) of the relevant observational data for a particular region of interest. Over the lifespan of the project, we have ingested over 14 billion data points into RCMED at a rate over 60,000 tuple records per second.
The web service’s primary consumer, the Regional Climate Model Evaluation Toolkit or RCMET, complemented the RCMES by providing temporal and spatial regridding of the observational data to match up to the provided climate model outputs (shown in the right side of Fig.2.3). This was a computationally intensive data processing (recall Sect.2.2.6) task that produced output bias calculations (demonstrating the model or observational data biases when compared), and other relevant decision-making outputs.
In the following section, we will discuss a relevant data-intensive system example in the domain of astronomy.
3.2
Astronomy
Astronomy has had a long history of data intensive problems. Even observers in the pre-telescopic era could generate stellar catalogs having 1,000 or more entries. With the invention of the telescope, and then photographic and spectroscopic systems, the data volume increased dramatically, to the point that it was necessary to employ “human computers” in order to keep up. In the modern era, telescopes and numerical simulations are being designed that challenge many aspects of data intensive processing (Sect.2.2.6), including processing, data storage, and curation (Sect.2.2.2).
Cosmology is the study of the origin and fate of the Universe, and it can be a science driver for extreme processing. Recent observations have provided a reckoning of the major constituents of the Universe, namely it is composed of approximately 4% of baryonic matter, 21% of dark matter, and 75% of dark energy. Baryonic matter is “normal” matter, composed of proton, neutrons, and electrons; dark matter is largely unknown, though its nomenclature stems from the fact that it does not appear to emit or absorb light and its presence can be inferred only from its gravitational effects; and dark energy is described largely in name only, as a component that may act effectively as if it has negative pressure but may also indicate a fundamental breakdown of our understanding of gravity on the largest scales.
Improving our knowledge of these constituents, and particularly probing the extent to which their balance may have changed with cosmic time, requires surveys of a significant fraction of the volume of the Universe. There are a number of surveys in which galaxies are used as point mass tracers of the Universe and which are either underway or being planned for this decade, and into the next, for ground-based telescopes. A partial listing includes the Baryon Oscillation Sky Survey (BOSS) and its successor BigBOSS, the Evolutionary Map of the Universe (EMU), the all-sky survey with the Large Synoptic Sky Telescope (LSST), and an all-all-sky survey with the Square Kilometre Array (SKA).
The EMU survey on the Australian SKA Pathfinder (ASKAP) and the SKA surveys could drive quite extreme processing requirements. Both ASKAP and the SKA are interferometers, in which one does not obtain an image of the sky
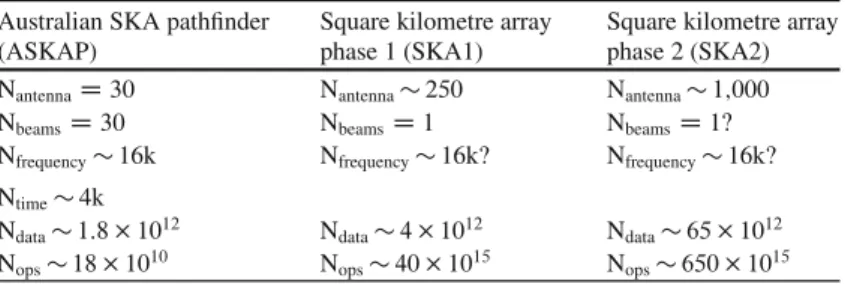
Table 2.1 Telescope parameters and resulting processing requirements
Australian SKA pathfinder (ASKAP)
Square kilometre array phase 1 (SKA1)
Square kilometre array phase 2 (SKA2) NantennaD30 Nantenna250 Nantenna1;000
NbeamsD30 NbeamsD1 NbeamsD1‹
Nfrequency16k Nfrequency16k? Nfrequency16k?
Ntime4k
Ndata1:81012 Ndata41012 Ndata651012
Nops181010 Nops401015 Nops6501015
directly. Rather, an interferometer consists ofN individual apertures (telescopes). Each unique pair of telescopes samples a particular Fourier component of the sky brightness distribution, and the whole interferometer providesN.N1//2 Fourier samples. An image of the sky is obtained by Fourier inverting theseN.N1//2 sam-ples. In practice, obtaining the image requires more than “just” a Fourier transform, as various corrections for uneven sampling and instrumental effects must be applied. Moreover, because of instrumental effects or galaxy emission characteristics or both, it is desirable to obtain samples at multiple frequencies or wavelengths, and the Universe is faint, necessitating long integrations. Finally, ASKAP will, and the SKA may, have a “multi-beaming” technology deployed that allows multiple images to be obtained simultaneously. These processing requirements are summarized in Table2.1.
The total data that must be processed in order to produce a single image is then NdataNantenna2NbeamNfrequencyNtime
where Nantennais the number of antennas in the array, Nbeamis the number of “beams”
or independent fields of view generated by the “multi-beaming” technology, Nfrequencyis the number of frequencies or wavelengths processed, and Ntimeis the
number of time samples collected. Significantly, current community estimates are that the number of operations required to correct for instrumental effects could be as large as104–105per datum. Table2.1summarizes what the telescope parameters are for ASKAP and the SKA and the resulting processing requirements. In the case of the SKA, many of the design choices are not yet finalized; thus, the values listed in Table2.1should be seen as indicative rather than definitive. Table2.1also assumes the lower value for the number of operations, namely104 per datum. Nonetheless, it is clear that even the conservative assumptions yield processing requirements of tens to hundreds of Peta-operations.
The Universe can provide a laboratory with which to test fundamental laws of physics, which in turn can drive data storage requirements. One of the most famous examples of using the Universe as a proving ground for fundamental theories was the 1919 solar eclipse expeditions that were mounted, in part, to test a prediction of Einstein’s recently published Theory of General Relativity (GR). Those expeditions
demonstrated that the stars seen near the limb of the Sun, i.e., for which the line of sight was strongly affected by the gravitational field of the Sun, had their positions shifted by an amount consistent with that of GR, and inconsistent with Newton’s Universal Law of Gravitation. Today, of course, GR has entered modern life, as GR corrections must be incorporated into satellite navigation (e.g., with the Global Positioning System or GPS).
One modern test of GR uses binary star systems. A particular class of star is a neutron star, and a subset of neutron stars is detectable as radio pulsars. These stars are the condensed remnants of massive stars, containing perhaps 150% of the mass of the Sun packed into a volume of about 10 km in radius, and they produce regularly repeating pulses of radio radiation. In the best cases, the arrival time of a pulse from a pulsar can be predicted to better than 100 ns precision. The combination of large masses and high precision makes pulsars exquisite clocks for GR tests.
The exemplar for such tests of GR is the system PSR B1913C16, which consists of two neutron stars in an approximately 8 h orbit4about each other, with one of the neutron stars detected as a pulsar. The discovery and subsequent precision timing of the pulses from this system resulted in the 1993 Nobel Prize in Physics. Since the discovery of PSR B1913C16, there have been a few other such neutron star-neutron star binaries discovered, including the recent discovery of the double pulsar PSR J07373039, in which both neutron stars have been detected as pulsars; there are also neutron star-white dwarf5binaries known that can probe other aspects of GR. In GR, the most compact object that could exist is a black hole, and there is intense interest in finding a black hole-pulsar binary as a number of previously inaccessible tests of GR would then become possible.
One of the main difficulties in conducting such tests is that sufficiently useful pulsars are rare. There are currently approximately 2,000 pulsars known. Of these, fewer than 10% can be used for high precision GR tests of one kind or another; indeed the very best pulsars may constitute only a few percent of the total known population. Estimates of the total (detectable) pulsar population in the Galaxy are as large as 20,000, suggesting that many more could be found. Moreover, for some of the tests of interest, it is useful to have pulsars distributed widely on the sky, which requires that one ultimately conduct a survey over the entire accessible sky for pulsars.
Searching for pulsars requires large telescopes because pulsars are generally quite faint. Obtaining sufficient signal to noise on pulsars also often requires collecting data over a large frequency (or wavelength) span and over a sufficient time interval. However, pulsar pulses are short durations, of order 1 ms, necessitating rapid time sampling, and their radio signals are affected by propagation through the
4The size of their orbit is comparable to the diameter of the Sun.
5A white dwarf is the remnant of a star with a mass of about that of the Sun compressed into a
volume about the size of the Earth. The Sun will end its life some five billion years hence as a white dwarf.
Table 2.2 Illustrative data volumes generated by Pulsar surveys
Green bank telescope/Arecibo
Parameter observatory/Parkes telescope SKA
Dt 20–70 min 30 min
Dt 64–82s 50S
Dn 300–800 MHz 800 MHz
Dn 24–100 kHz 20 kHz
Ndata 44–2;200109samples 1;440109samples
Pixels in the sky 350103 76106 Full sky survey 201015samples 4:61018samples
interstellar medium, necessitating maintaining a narrow frequency sampling. For each “pixel” on the sky, the number of data acquired is then
NdataD  Dt dt à  Dn dn Ã
where Dt is the total integration time, dt is the time sampling, Dn is the total frequency bandwidth processed, and dn is the frequency channelization or sampling. Table2.2presents illustrative data volume values for modern-day pulsar surveys, such as those being conducted at the Green Bank Telescope (GBT), the Arecibo Observatory, or the Parkes Telescope, and a future survey with the SKA.
For a single-dish telescope such as the GBT, Arecibo, or Parkes, a “pixel” on the sky is defined by the size of the field of view; both Parkes and Arecibo have implemented multi-feed system that effectively provides approximately 10 independent and simultaneous fields of view, increasing the data volumes by approximately an order of magnitude. Specifically, the dimensions of a single pixel could be typically 16 arcminutes (at a fiducial frequency of 800 MHz or a fiducial wavelength of 37 cm), resulting in about 350 103 pixels in total in the sky. Conversely, for the SKA, because it is an interferometer with much higher angular resolution, a typical pixel dimension might be 1.2 arcminutes, resulting in as many as 76106 pixels in the sky. Table2.2also summarizes what the resulting data volume would be for an all-sky pulsar survey, cast in terms of “samples.” Clearly, if the data represented by only 1-byte samples, it would be quite easy to obtain Exabyte data volumes.
Our focus here has been on pulsar surveys, which are conducted at radio wavelengths. However, ground-based optical surveys, such as to be conducted by the LSST, could easily generate tens of Terabytes of data per night. For instance, the LSST envisions having a 3.2 Gpixel camera that is read out every 15 s. Over the course of a night, 30 TB will be generated, or about 10 PB/year. During the LSST’s nominal 10 year lifetime, the data volume begins to approach an Exabyte.
Finally, much of this discussion has focused on data to be generated by future telescopes. Astronomy is a notable science in that the typical time scale of many phenomena can exceed a human lifetime, often by a large factor. By retaining
the data from a telescope for significant durations, it can be possible to probe the behavior of various kinds of objects on time scales that would not otherwise be possible. For example, by collecting and combining data from photographic plates and modern observations, it is possible to reconstruct the brightness variations of some sources over durations that exceed 100 years. Clearly, data curation over such durations both opens investigations that otherwise would not be possible – perhaps not even imagined at the time that the original observations were taken – but also poses significant challenges.
Experience with existing instruments, such as the Hubble Space Telescope (HST) and the Very Large Array (VLA), also has demonstrated the power of a data archive. While the archive of neither telescope is yet particularly large, they have proven quite useful, as the number of scientific papers being generated by re-analysis of archival data is now equaling or exceeding the number of scientific papers being generated from new observations. Moreover, major telescopes, such as the HST and VLA, have lifetimes that are measured in decades. Thus, it is likely to become necessary to provide for data curation on time scales of many decades.
Figure2.4 demonstrates a recent data processing system that we developed to process data from the Expanded Very Large Array (EVLA) instrument, a data-archive centric instrument with more than ten times the VLA’s sensitivity. EVLA data (the day2 TDEM 0003 10s norx) is disseminated (Sect.2.2.2) across the world-wide-web and delivered to a staging area, where it is automatically curated and metadata is extracted. The data is then ingested into the file management component (center of Fig.2.4) labeled as FM where the extracted metadata is stored in a catalog (labeled as cat in Fig.2.4) and the data itself is moved to a repository (labeled as rep in Fig.2.4). Separately, a system operator sends an event to being processing the EVLA Spectral Line Cube (evlascube in Fig.2.4) task, a Common Astronomy Software Applications (CASA) [28] program developed for the EVLA summer school in 2010. The workflow management component (labeled as WM in the middle-right of Fig.2.4) is responsible for running the CASA program, which is wrapped in a science algorithm wrapper called CAS-PGE, part of the Apache OODT project that we will describe further in Sect.4. The wrapper communicates with the file management component, figures out the locations and metadata associated with the day2 TDEM 0003 10s norx and then provides that information to the CASA program so that it can process it and generate a spectral line cube image. The result image, and calibration tables are ingested into the file management component by the wrapper, and made available to external users via a data portal (recall the upper right portion of Fig.2.2) that provides search and dissemination (recall Sects.2.2.5and2.2.2, respectively) of the results to the science community.
We will wrap up Sect.3 by describing the domain of snow hydrology, and its data-intensive challenges, along with a representative data system that we have constructed to address them.
Fig. 2.4 A prototype architecture demonstrating data processing, and archiving of extended very
large array (EVLA) data
3.3
Snow Hydrology
Snow cover and its melt dominate regional hydrology in many of the world’s mountainous regions. One-sixth of Earth’s population depends on snow- or glacier-melt for water resources, and people in these areas generate one-fourth of the global domestic product [29,30]. In the Western US, more than 70% of the freshwater supply comes from snowmelt from the geographically limited mountain ranges. Recent analyses of long-term surface observations show a declining snowpack and snow cover in the western US attributable to increasing temperature [31–33]. Investigations in the Colorado River Basin show that radiative forcing by dust from the Colorado Plateau in the mountain snow cover consistently enhances snowmelt and leads to a month’s earlier loss of snow cover extent [34].
Today, the western US face significant water resource challenges due to increas-ing demands related to population growth and for economic and environmental
Fig. 2.5 The SnowDS (data system) and its instantiation using Apache OODT
needs. If current trends continue, future demands are expected to increase by 40% in the next 30 years according to the US Western Governor’s Association and their 2006 report. The complexity of Western water management gives rise to the significant role of science and the need for improved observations to support sustainability for generations to come [35].
Resource managers are tasked with projecting run-off amounts in order to manage reservoirs, dams, and water allocations for several western States and Mexico. In the past, planners have relied on information developed from historic observations of stream flow, snow pack, soil moisture and climate drivers coupled with a sparse network of snow and stream gages as input to decision tools for seasonal and yearly planning. However, it is becoming clear that this approach is no longer viable, as historic observations perform poorly under a changing climate [36], and changes in precipitation and snow patterns hinder accurate assessments of snow and runoff conditions using the existing system of sensors. The result has been a decline in the accuracy of water supply forecasts in the western United States.
The data system infrastructure developed to support this effort consists of a scalable, end-to-end processing environment centered around custom algorithms to perform enhanced filtering of raw remote sensing observations and a distribution architecture for the generation and delivery of data products to the National Snow and Ice Data Center Distributed Active Archive Center (NSIDC-DAAC). The increased coverage and enhanced accuracy of the data products generated by the system fill critical gaps in the present snow and ice record. The data system infrastructure is show in Fig.2.5.
The first task was to obtain the required data to fully process and analyze the Colorado River Basin (CRB) using a distinct set of MODIS MOD09GA tiles. Using the Apache OODT data management framework, we immediately started to download the data into our staging area, where the files were then crawled and metadata ingested into the file management component. OODT’s file manager requires a set of XML policy files to set up the metadata structure for ingestion of
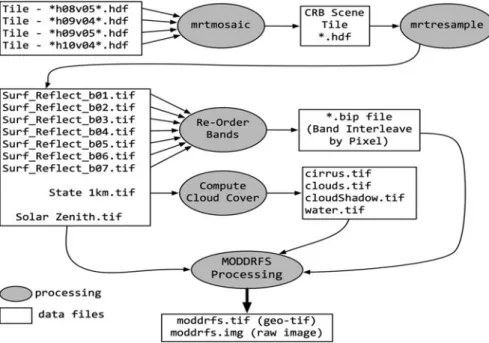
Fig. 2.6 The MODIS dust radiative forcing of snow (MOD-DRFS) algorithm and its processing
products. This “metadata first” approach helps to ensure that a common information model is in place before the data is actively placed in the archive. Figure2.4
illustrates the data ingestion pipeline that was deployed to support the on-going snow research project at JPL.
Utilizing the OODT framework offered a variety of time-saving benefits that ex-tended beyond metadata collection: by simple configuration changes, we were also able to archive the raw MODIS data files on disk within a directory structure what was organized around temporal and geospatial considerations, making downstream discovery and processing considerably easier.
After just over 2 weeks, the team had obtained over 9 years of MODIS satellite observations from the upstream archive, and the focus shifted to the processing and generation of MODIS Dust Radiative Forcing of Snow (MOD-DRFS) products. To implement the specialized algorithms, we installed the OODT workflow manager and wrapped the native Perl and IDL code used to transform MODIS products into MOD-DRFS products. Figure2.6shows the entire multi-staged process used to generate MOD-DRFS. After a number of exploratory test runs, we estimated that processing the entire dataset would take just over 16 days of uninterrupted processing, and decided to investigate the potential time savings that increased parallel processing might afford.
Apache OODT offers a resource management component that can be utilized to map workflow jobs to remote batch nodes based upon node resource availability, allowing workflow steps to be distributed and managed across multiple compute